GBPUSD Technical Expert Review - 3 May 2025🔮 Price Forecast (Main Scenarios)
📈 Bullish Scenario (if price reacts from current level):
Price may bounce from the current 1H LQ Close zone (gray).
It could rally toward the upper 1H LQ Close zone (purple) to retest it and potentially trigger Phase 2 Inducement.
🎯 First target: 1.33150
🎯 Second target: 1.33450 (just below the 4H LQ Close)
📉 Bearish Scenario (if the current zone breaks):
A clean close below 1.32500 could open the path toward the 4H LQ Close zone.
🧲 Expect potential reversal around 1.31600–1.31800 (major buy zone).
Pivot Points

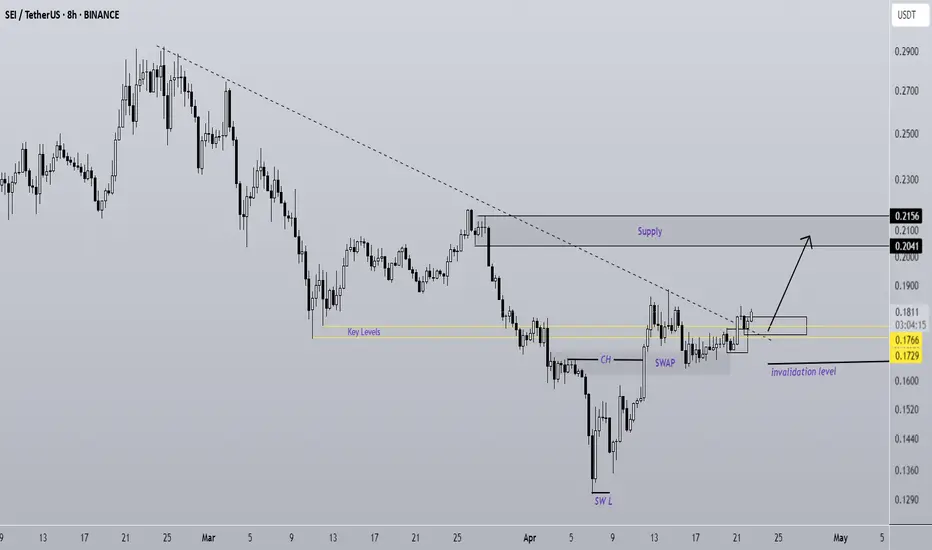
SEI Is A Rocket (8H)SEI has started a strong move from the bottom.
After breaking through a resistance zone with little to no reaction, it has now formed a SWAP zone.
Buy orders have been effectively transferred from the SWAP area into the candles, and the price shows strong momentum to push toward higher levels.
As long as the demand zone holds, SEI has the potential to reach the marked target area | or even go beyond it.
However, a daily candle closing below the invalidation level would invalidate this analysis.
Do not enter the position without capital management and stop setting
Comment if you have any questions
thank you
B3 Aanalysis (12H)The strong bullish move on B3 is turning into a 3D. It could move from the supply zone towards the SWAP zone and then get rejected upwards.
We are looking for buy/long positions in the green zone. Targets are marked on the chart.
A daily candle close below the invalidation level will invalidate this analysis.
For risk management, please don't forget stop loss and capital management
When we reach the first target, save some profit and then change the stop to entry
Comment if you have any questions
Thank You

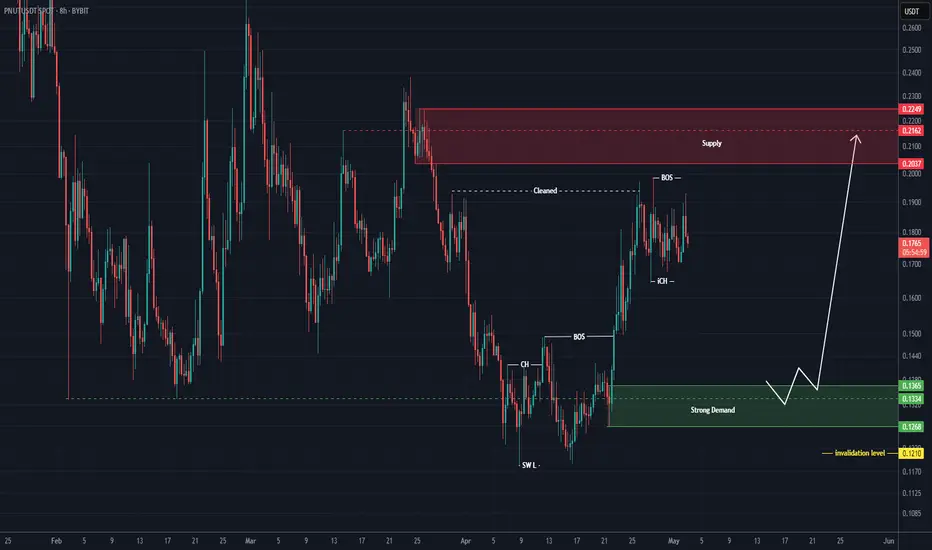
Strong rebuy setup for PNUT (8H)Note: This is not a sell/short setup | it is a buy/long setup.
After clearing resistance order blocks and a strong bullish move, buyers seem to have exhausted their momentum and may need a retracement for price to return to their base.
We are looking for a rebuy within the green zone. The price is likely to move from this area toward the red box.
A daily candle closing below the invalidation level will invalidate this analysis.
For risk management, please don't forget stop loss and capital management
Comment if you have any questions
Thank You
Where Should We Rebuy The PUMP? (8H)With the large bearish master candle formed at the top, the structure has turned bearish.
The green zone is the best and lowest-risk area for long positions or rebuys.
Reaching this zone may take some time, but you can already add this symbol to your watchlist and wait for it to reach the area before entering a position.
A 25%–45% return can be expected from this zone.
A daily candle closing below the invalidation level will invalidate this analysis.
For risk management, please don't forget stop loss and capital management
Comment if you have any questions
Thank You

DXY Technical Expert Review - 3 May 2025Weekly Price Reaction Expectations:
Overall, for this week, we expect a price reaction around the ATI candle zone, followed by another potential reaction near the upper LQCLOSE BOX area.
DXY Bullish Momentum Justification:
Additionally, since the LPP or investment liquidity has been consumed, the bullish momentum in DXY appears more justified.

Nifty EOD Analysis – May 2, 2025 - Friday🟢 Nifty EOD Analysis – May 2, 2025 (Friday)🔴
Another day... tug-of-war between buyers and sellers
📊 Nifty Summary
Another one-day tug-of-war between buyers and sellers. As usual, morning momentum — driven by buyers and short-covering — pushed the index into a bullish zone. However, profit booking and seller dominance dragged it back down, ultimately parking Nifty again in the 24,330 ~ 24,365 zone — now the 4th straight session closing within this narrow range.
Nifty opened on a bullish note at 24,311 and launched into a swift rally, breaching multiple resistance zones and clocking a new high at 24,589 within the first hour. However, the enthusiasm faded quickly. Sellers stepped in aggressively, and all the major support levels crumbled one by one. What started as a breakout turned into a breakdown.
The index drifted lower and spent the rest of the session stuck in a narrow zone of 24,330–24,365 — now for the fourth session in a row! The close at 24,346 reflects indecision and caution ahead of next week’s events.
📌 5 Min Time FrameChart
🕔 Intraday 5-Min Chart (Price Walkthrough)
🔹 Opened at 24,311 and rallied sharply to 24,589 — breaching multiple resistance zones.
🔹 Sellers took control and dragged the index back below 24,400.
🔹 Breakdown through all major support levels including PDH, CPR, and CDL.
🔹 Post-lunch session remained directionless between 24,330–24,365.
🔹 Fourth consecutive close inside this compression zone.
📌 75 Min Time FrameChart
⏱️ Intraday 75-Min Time Frame Chart
📐 First two candles formed a bullish setup, but the third candle completely reversed the gains, forming an Inside Bar breakdown trap. The remaining candles failed to break out of the previous range, with momentum fading.
⚠️ A breakout (or breakdown) from this compression is now imminent — keep your eyes on the next session for direction.
📌 Daily Time FrameChart
🕯️ Daily Time Frame Chart & Candle Breakdown
📈 Today’s Candle Type: Spinning Top with long upper wick
🟢 Open: 24,311.90
🔺 High: 24,589.15
🔻 Low: 24,238.50
🔚 Close: 24,346.70
📊 Change: +12.50 (+0.05%)
🧠 Know Your Candle:
A Spinning Top reflects market indecision — the long wicks show strong attempts by both bulls and bears, but neither managed to dominate.
Upper Shadow: 242.45 pts → Strong selling from highs
Lower Shadow: 73.40 pts → Mild buying near lows
Real Body: 34.80 pts → Modest positive close
🔍 Interpretation:
Despite an early morning breakout, the close back in the congestion zone signals a lack of directional strength. The long upper wick reflects failure to hold higher ground — bias slightly tilting bearish unless this zone is broken with conviction.
⚔️ Gladiator Strategy Update
📌 Strategy Parameters:
ATR: 317.21
IB Range: 270.30
IB Category: Medium IB
Market Structure: Balanced
📊 Trade Summary:
✅ 1st Trade (Long): Triggered at 9:25 – Target Achieved (1:2 RR)
❌ 2nd Trade (Short): Triggered at 12:25 – SL Hit
🔮 What’s Next?
The bias remains neutral to slightly bearish. Despite a strong upside in the first hour, the repeated failure to sustain above 24,400 and four closes within 24,330–24,365 suggest exhaustion.
A breakout from this tight coil should give a clear move — wait for confirmation.
📌 Support & Resistance Levels
🔺 Resistance:
24,330 ~ 24,360 (Immediate hurdle)
24,400 (PDH)
24,457
24,480 ~ 24,540
24,589 (CDH)
24760 ~ 24,800
🔻 Support:
24,190 ~ 24,225
24,120
24,050
24,000 ~ 23,950
23,820
23,710 ~ 23,660
23,500
23,410 ~ 23,370
23,215
💬 Final Thoughts
“Range traps continue to fool both sides — momentum without conviction is just noise.”
Watch the compression zone — a genuine breakout or closing above 24,365 or breakdown below 24,225 could bring clarity. Until then, trade light and watch levels.
✏️ Disclaimer
This is just my personal viewpoint. Always consult your financial advisor before taking any action.

btc fibonacci levels btc did not hold 97218 level and have fallen down to 9661 level and needs to hold this level as my next level is back down to 96000 look for a bounce if holds or we will continue to down trend

Just hit major resistance w/ bearish indicators.Target level is $415 to $400.
Political news will most likely influence this move. Earnings were great.
Huge volume profile gap that I think will be closed.
Watch out for another bull trap soon, but I think we just peaked.

btc levels my last post was off because i was trying something new pit int wrong info but got new levels btc holding 97218 if can hold this and 97037 we are going to break 97483 97825 get new resistance at 98553 lock in profits


USD/CHF For Bearishyou can go short now
general trend is up trend
current phase is pull-back
have fun :)

CAD/CHF For Bearishyou can go short now
or
wait for pull-back near by entry point and then go short
general trend is down trend
have fun :)

GBP/AUD for bearish as pull-backwait for pull-back near by entry point and then go short
general trend is up trend
current phase is pull-back
have fun :)

EUR/CHF For Bearish as pull-backwait for pull-back near by entry point and then go short
general trend is up trend
current phase is pull-back
have fun :)

AUD/CAD For Bullishwait for pull-back near by entry point and then go long
general trend is up trend
have fun :)

NZD/USD For Bullishwait for pull-back near by entry point and then go long
general trend is up trend
have fun :)

AUD/USD For Bullishwait for pull-back near by entry point and then go long
general trend is up trend
price walk inside side way channel over H4 Timeframe
have fun :)

XAU/USD For Bullishwait for pull-back near by entry point and then go long
general trend is up trend
have fun :)

The Worst Is Over – Bullish May and June AheadAfter months of uncertainty, volatility, and fear-driven sell-offs, the altcoin market is finally showing signs that the bottom may be in.
The Market Cipher indicator are flashing early bullish signals, with trigger waves beginning to play out. While we still have key resistance levels to clear, particularly the 200-day and 200-week SMAs. All signs point to a market that’s gearing up for a strong move to the upside.
Now, if Trump could just chill with the tariff war talk, we might even get some macro tailwinds to support the rally.

ETH 2000$📈 CRYPTOCAP:ETH Analysis – May 2, 2025
Ethereum is forming a bullish ascending triangle and reacting to the key resistance at 1812, possibly preparing for a breakout.
🔹 Resistances:
1812 USDT 🔼
1910 USDT 🎯
2000 USDT 🎯
🔹 Supports:
1728 USDT 🛡️
1680 USDT ⚠️
1484 USDT ⚠️

Bitcoin Terminal Price Risk IndicatorToday we’ll explore the Bitcoin Terminal Price Risk Indicator , which builds on the concept of Bitcoin Terminal Price. We’ll follow the same logic as in our previous idea on the Pi Cycle Top Risk Indicator. By the end, we'll have a new tool for analyzing INDEX:BTCUSD market cycles.
First, let’s recap Terminal Price.
Terminal Price = Transferred Price × 21
Transferred Price = Coin Days Destroyed ÷ (supply × time)
It normalizes historical spending behavior to the full 21M BTC supply. This metric has historically been effective at calling Bitcoin cycle tops whenever the price of Bitcoin crosses above it. That being said, it signaled the April 2021 peak, but not the November one.
Let’s now divide the weekly BTC price by Terminal Price. This gives us BTC-to-Terminal Price Ratio. (We use the formula from the Bitcoin Master Cycle indicator by InvestorUnknown for Terminal Price on TradingView.)
When the ratio crosses above 1, BTC price exceeds Terminal Price and signals cycle top. We can notice that each cycle top forms slightly lower ratio peaks.
Now let’s draw two logarithmic curves through the highs and lows of this ratio, and add a midline.
This creates a band within which the BTC-to-Terminal Price ratio tends to oscillate. These bounds can help anticipate major turning points in future market cycles.
Next, we normalize the ratio between these bounds: bottom curve = 0, top curve = 1.
This gives us the Bitcoin Terminal Price Risk Indicator.
Currently, risk sits around 0.46 , bouncing between 0.3 and 0.6 for ~1.5 years. This range suggests a stepwise price increase with consolidation periods in between — and no mania and blow-off top.
Historically:
Risk > 0.9 = potential selling zone
Risk < 0.1 (or < 0.05) = potential buying zone
Note: Risk stays > 0.9 for just 1–2 weeks.
Reality check: the top curve lies above 1 and slopes down only slightly.
This implies that if the ratio approaches the upper boundary, BTC price could meet or exceed Terminal Price this cycle — currently ~$155K and will be rising quickly should BTC move towards it.
However, so far we have very few data points and they don’t fit the curve perfectly. And there’s no guarantee we’ll reach that upper bound.
For a more conservative take, we can replace the log curve with straight lines.
This steeper upper line would signal a top earlier — below Terminal Price.
Using this method, risk is slightly higher now at 0.55. While also not perfect, this linear approximation can serve as a cautious alternative until more data points emerge.
We'll keep tracking these charts.

BEAMX Looks Bullish (8H)Two higher lows have been formed at the bottom of the chart, and the price has already created a bullish CH.
A trigger line has been formed, and it is expected to break after a few touches.
With the trading range maintained, the price is expected to move towards the targets, which are marked on the chart.
Closing a daily candle below the invalidation level will invalidate this analysis.
For risk management, please don't forget stop loss and capital management
When we reach the first target, save some profit and then change the stop to entry
Comment if you have any questions
Thank You
