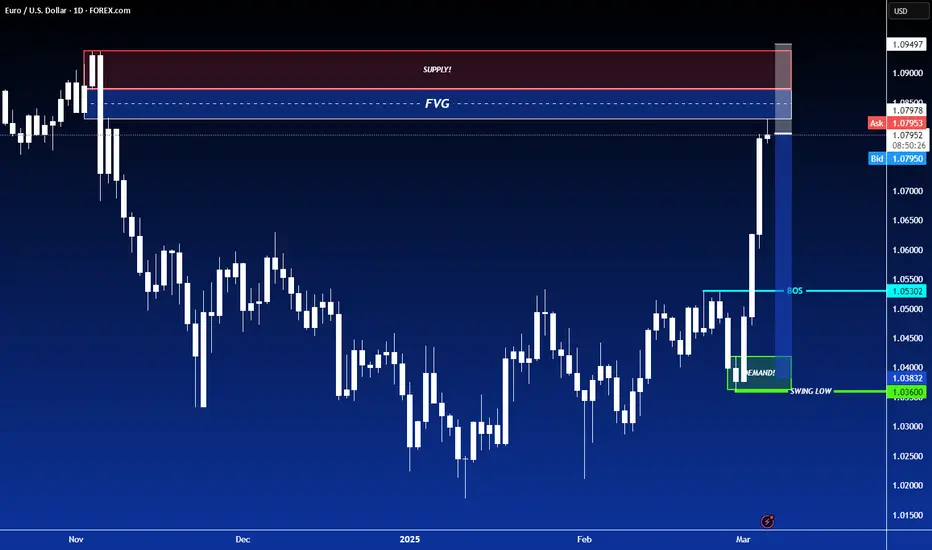
Fair Value Gap @20300Price created a break of structure preceeded by a fair value gap, which was followed by a retracement to the order block where my buy limit was
Pivot Points

SHORT ON EUR/USDEUR/USD has Reached a Major Resistance Area/Zone and is highly over brought.
The Dollar (DXY) is inverted with the Eur/usd negatively. The dollar is highly oversold and should rise from its major Demand zone.
This should cause the Euro to Fall from its resistance zone.
Dollar has news at 8:30 for Unemployment claims. If the news is somehow good for the dollar and causes it to rise, the Euro will have the potential of reaching about 400 pips over the next few days.
I will be selling EUR/USD to the demand level shown.
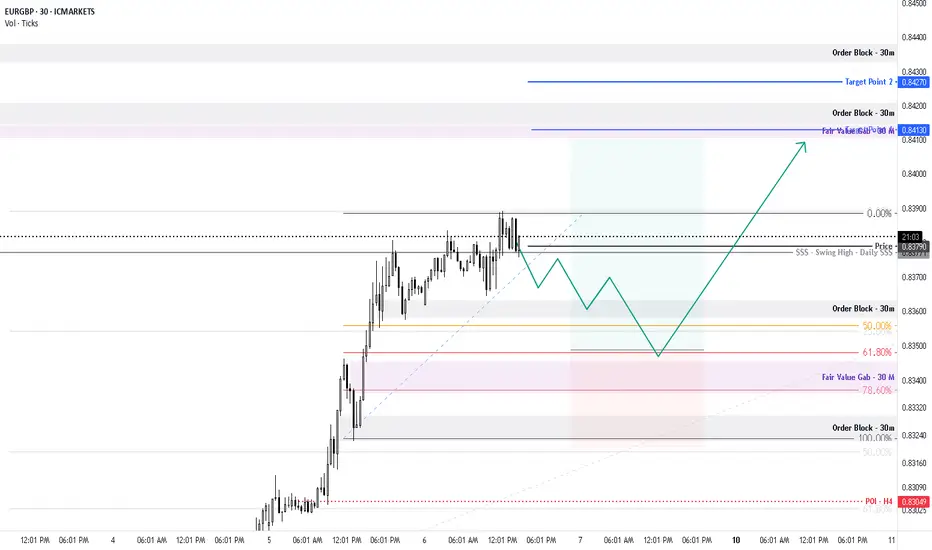
EUR/GBP For Bullishwait for entry point as pull-back and then go long
general trend is up trend
have fun :)
NZD/CAD For Bullishyou can go long now
or
wait for entry point as pull-back and then go long
have fun :)

GBPUSD is in the Selling DirectionHello Traders
In This Chart GBPUSD HOURLY Forex Forecast By FOREX PLANET
today GBPUSD analysis 👆
🟢This Chart includes_ (GBPUSD market update)
🟢What is The Next Opportunity on GBPUSD Market
🟢how to Enter to the Valid Entry With Assurance Profit
This CHART is For Trader's that Want to Improve Their Technical Analysis Skills and Their Trading By Understanding How To Analyze The Market Using Multiple Timeframes and Understanding The Bigger Picture on the Charts

USDCHF Short at 0.89099 w Technical analyis;Fundamental,..Trade Idea: Short USD/CHF
Entry: 0.89118
Stop Loss: 0.89293
Take Profit: 0.88528
Risk-to-Reward Ratio: 3.25:1
Risk per Trade: 1,8%
Analysis: OANDA:USDCHF
• Technical Setup: Price is rejecting the MR50 and pivot point, showing bearish signals.
Long wicks suggest a potential reversal.
• Indicators: Williams %R shows overbought conditions, supporting the short setup.
• Timeframe: Entering on the 50-minute chart after confirmation of price rejection or
lower highs.
Fundamentals:
• Swiss CPI: 0.6% (actual) vs 0.5% (forecast) indicates a stronger Swiss Franc,
supporting the short trade on USD/CHF.
• COT Data: Positions are bearish on USD and bullish on CHF, aligning with the setup.
Market Sentiment:
• DXY: A bearish USD supports the downside in USD/CHF.
• Overall Sentiment: Bearish sentiment towards USD in March suggests continued
weakness for USD/CHF.
Risk Management:
• Stop Loss at 0.89313 and take profit at 0.88528, offering a 2.97:1 risk-to-reward
ratio.
This is a high-probability short setup with solid technical, fundamental, and sentiment alignment. Always use proper risk management. (70-75% Probability of Winning this Trade)

Google Update - Trade this range and new ATH Identified Update video on the google Long that has been planned since early FEB. The level has now been hit and we got a nice reaction off that level . In this video I look into where I think we go next and how price plays out .
In the video I use the following tools TR Pocket FIB , 0.618 FIB , Pivots , Parallel Channel and the Fixed range Vol Profile.
If we stay range bound inside the channel then we have the potential to see a new high on google at the top of the channel in confluence with 1-1 ext + tr pocket expansion .
Watch the video and mark the levels on your chart and ensure to set your alerts .
Dont forget to Boost the chart Please and i welcome any questions TY


XAUUSD Sell setup XAUUSD | H1 timeframe 🙌
There are some rules to follow this setup ❗️
Candle should be below under our observation point which is at 2919.00 point
We will see the gold for upcoming days at 2902.00 and furthermore 2895.00 again if the closing below the previous Support at 2895.00 then next benchmark would be at 2880.00
You guys need to follow this trade with proper risk management and stoploss

UK100 (FTSE)-Weekly forecast, Technical Analysis & Trading IdeasMidterm forecast:
8380.25 is a major support, while this level is not broken, the Midterm wave will be uptrend.
Technical analysis:
A trough is formed in daily chart at 8611.20 on 02/21/2025, so more gains to resistance(s) 8854.99, 9000.00, 9100.00 and more heights is expected.
Take Profits:
8664.21
8765.00
8854.99
9000.00
9100.00
__________________________________________________________________
❤️ If you find this helpful and want more FREE forecasts in TradingView,
. . . . . . . . Hit the 'BOOST' button 👍
. . . . . . . . . . . Drop some feedback in the comments below! (e.g., What did you find most useful? How can we improve?)
🙏 Your support is appreciated!
Now, it's your turn!
Be sure to leave a comment; let us know how you see this opportunity and forecast.
Have a successful week,
ForecastCity Support Team

EUR/CHF For Bearish as Pull-backyou can go short now
price make price action at M30 Time Frame so we will go short and out when price make higher low between 50 : 61.8 fibo levels
have fun :)

EUR/CHF For Bullishyou can go long now
or
wait for entry point as pull-back and then go long
general trend is down
current phase is pull-back
have fun :)


NZD/CHF For Bullishwait for entry point as pull-back and then go long
general trend is down trend
current phase is pull-back
have fun :)

NZD/USD For Bullishwait for entry point as pull-back and then go long
general trend is down
current phase is pull-back
have fun :)

AUD/USD For Bullishwait for entry point as pull-back and then go long
general trend is down
current phase is pull-back
have fun :)


EUR/USD Massive Breakout After Liquidity Grab!Analysis:
A strong bullish breakout on EUR/USD after a clear liquidity grab at the lows! The buy order at 1.05 survived the stop hunt, and price surged towards the take profit zone near 1.07.
📊 Key Observations:
✅ Liquidity Sweep: Smart Money engineered liquidity below key support.
✅ Explosive Reversal: Price aggressively pushed up post-sweep.
✅ Bullish Confirmation: A daily breakout could indicate more upside.
🔔 What’s Next?
Will EUR/USD hold above this key level or fake out?
Watch for potential retracements into discount zones before another leg up.
💬 Do you think the bulls will take control from here? Drop your thoughts below! 👇
#PriceAction #LiquidityGrab #OrderBlock #ForexSignals #FXTrader #Breakout

Gold resistance at 2922Gold is fighting with the 4H resistance at 2922, which also marks the neckline of its head and shoulder pattern. Best entry will be for it to close above 2522, retest that level again. That will open the doors for the 2525/26 area and possibly higher for today. Conversely, if gold starts breaking below the 2,890 level then it should open door for more downside.

GOLD SHORT ENTRY
AronnoFX will not accept any liability for loss or damage as a result of
reliance on the information contained within this channel including
data, quotes, charts and buy/sell signals.
If you like this idea, do not forget to support with a like and follow.
Traders, if you like this idea or have your own opinion, please feel free command me.

STX ANALYSIS (2D)The STX pair has reached a demand zone.
A price movement fractal seems to be repeating (highlighted by the orange and white boxes).
In the orange boxes, every time STX has dropped more than 72%, it has made a rebound move to the upside.
We are looking for buy/long positions around the demand zone.
The targets for STX are $0.93 - $1.10 - $1.30.
A daily candle close below the invalidation level will invalidate this analysis.
For risk management, please don't forget stop loss and capital management
When we reach the first target, save some profit and then change the stop to entry
Comment if you have any questions
Thank You

BTC in Support Zone Does BTC Going Upside From Here!Bitcoin (BTC) Market Update:
Caution is advised as manipulation appears to be influencing the BTC market, characterized by sudden pump and dump activity.
Key Support Level:
The current demand zone (marked on the chart) is a critical support level. If the price respects this zone, a recovery in BTC is possible.
Alternative Scenario:
Conversely, a breakdown below this level may trigger further downward momentum, leading to increased selling pressure in BTC and potential contagion to the broader cryptocurrency market.
Personal Insight:
Based on current market dynamics, a breakdown below the demand zone appears likely, potentially leading to further price deterioration in BTC.

Taking profits on EURUSD
Yesterday, EURUSD broke the previous high and reached 1,0637.
This fulfilled the expected upward movement, making it a good time to take profits.
The next resistance level based on Fibonacci extension is at 1,0675.
At the current levels, reducing the risk on active long positions is advisable.
