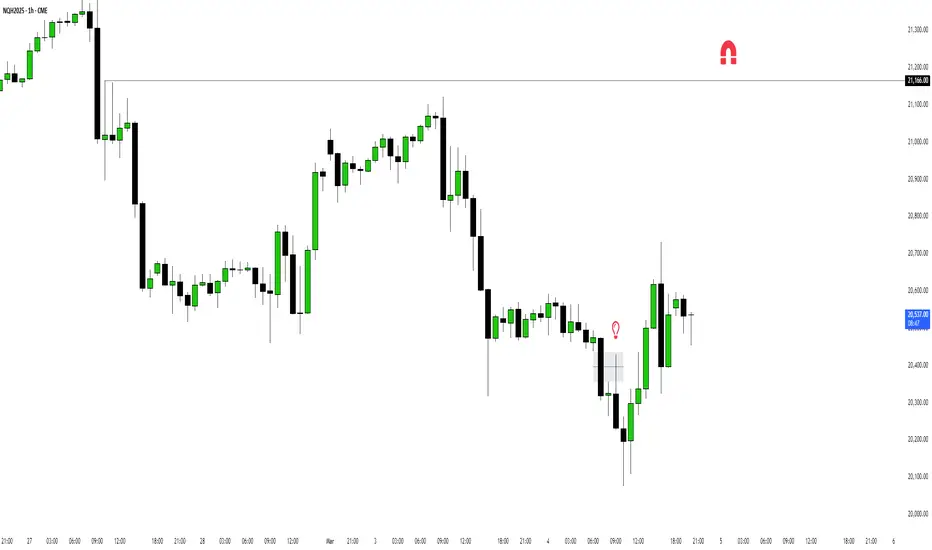
Pivot Points
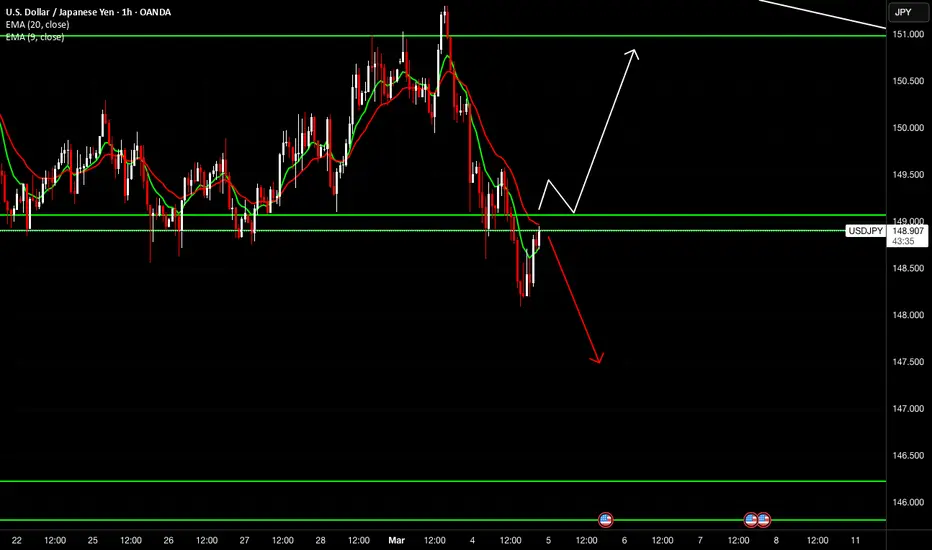
USDJPYPrice has broken a mojor H4 support zone and making a retest, If respected we should see more downside. Only sell if bearish signals are met.
First short gold, then long goldBros, driven by risk aversion, gold has risen rapidly to above 2920, breaking through the recent consolidation range of 2895-2885. However, due to the promotion of news, the continuity of gold's rise may not be strong. We must be careful of the trend of falling after rising, so we cannot aggressively chase long gold in short-term trading;
After consolidating in the past two days, gold has risen through the stimulation of news and got rid of the bottom area, and the rising structure is relatively complete. Then gold may try to rush into the upper 2930 resistance area again with the support of the rising structure, or even near the previous high of 2956. So in the next transaction, we can wait for gold to fall back to the 2900-2890 zone and try to go long on gold;
Of course, for now, before gold falls back to 2900-2890, we can safely short gold again in the 2915-2925 zone; after gold falls back to 2900-2890, we will go long on gold.Bros, profits are the ultimate goal in trading. Accumulating profits is what changes lives and destinies. Choosing wisely is far more important than just working hard. If you want to replicate trade signals and earn stable profits, or if you want to deeply learn the correct trading logic and techniques, you can consider joining the channel at the bottom of this article!

BTC New Update (4H)This analysis is an update of the analysis you see in the "Related publications" section
As you can see in this analysis, the demand zone from the previous analysis was slightly hunted, but it is still valid and considered a demand zone.
We have reduced the timeframe slightly (4-hour).
Our expectation for price action is to see a slight bounce upward in this zone with some time consolidation.
After consuming the buy orders in this area and spending some time, Bitcoin may even move toward lower zones.
Let’s see what happens.
For risk management, please don't forget stop loss and capital management
Comment if you have any questions
Thank You

GOLD (XAUUSD): Support & Resistance Analysis
Here is my latest structure analysis and important
supports and resistances on Gold.
Resistance 1: 2916 - 2932 area
Resistance 2: 2952 - 2956 area
Resistance 3: 2998 - 3002 area
Support 1: 2832 - 2853 area
Support 2: 2772 - 2786 area
Support 3: 2714 - 2740 area
It looks like we are going to see a test of the current all-time high soon.
Remember that its breakout will push the prices much higher.
❤️Please, support my work with like, thank you!❤️
I am part of Trade Nation's Influencer program and receive a monthly fee for using their TradingView charts in my analysis.

RUNE sell/short setup (4H)The RUNE token, after experiencing heavy drops due to negative news, is now trading within a range.
A price top has been fake out, leading to a drop. On a retracement to higher levels, we can look for a sell/short setup.
We have identified two entry points for a short position.
Targets are marked on the chart.
A daily candle closing above the invalidation level will invalidate this view.
For risk management, please don't forget stop loss and capital management
Comment if you have any questions
Thank You

Todays Gold Market Update.Gold Market Analysis:
The gold price is currently trading within a weekly bearish Falling Volume Gap (FVG) pattern. A break below the 50% level of this FVG has occurred, and the market is now testing a critical resistance zone.
Key Levels to Watch:
- Resistance: $2893.500
- Support: $2887.500
- Potential target (bullish): $2900
- Potential target (bearish): $2873
Trading Strategy:
A close above $2893.500 on the 4-hour chart, confirmed by a 4-hour candle close above this level, may indicate a bullish breakout. Conversely, a break below $2887.500, followed by a 4-hour candle close below this level, may confirm a bearish downtrend.
Investors are advised to closely monitor these key levels for trade confirmation and adjust their strategies accordingly.

#TATAMOTORS Demand ZoneBuying pressure is strong enough to overcome selling pressure.
The price has historically reversed upward from this zone.
Traders expect the price to bounce back if it reaches this zone again.

Gold rebounds as expected, get ready to short goldBros, as the trading strategy I published in the last article, we went long on gold near 2860 as scheduled according to the trading plan today. In order to lock in profits in time, we closed the order near 2870. In just half an hour, we made almost 100 pips of profit.
At present, gold continues to rebound to around 2875. Although the rebound process is relatively continuous, the overall rebound strength is not strong, so we can't chase gold too much; gold fell from the stage high of 2956 to around 2830, and gold turned from strong to weak. Its 50% retracement level is in the 2890-2895 zone, and the 38% retracement level is near 2880.
Therefore, the current rebound cannot be regarded as a reversal, but only a technical rebound repair. If gold rebounds to the 2880-2890 zone, I am still willing to short gold. Before gold is determined to reverse the trend, I think gold must at least retrace the 2860-2850 zone to form a technical double bottom support.
Bros, profits are the ultimate goal in trading. Accumulating profits is what changes lives and destinies. Choosing wisely is far more important than just working hard. If you want to replicate trade signals and earn stable profits, or if you want to deeply learn the correct trading logic and techniques, you can consider joining the channel at the bottom of this article!

ALGO buy setup (1D)Here, we have a high-potential zone for ALGO.
The green zone represents strong support, and if the price reaches this area, we will look for buy/long positions.
The red box is a fresh order block that hasn’t been tapped yet, containing the main sell orders.
The target can be this red box.
Closing a daily candle below the invalidation level will invalidate this analysis.
For risk management, please don't forget stop loss and capital management
Comment if you have any questions
Thank You

USDJPY BuyUSDJPY Trade Signal
📉 Pullback & Potential Reversal
Price Level: 150.41
Support Zone: 148.37 - 149.98
Resistance Targets: 152.06 / 154.00
📌 Trade Plan:
Wait for a pullback confirmation before entering long.
Stop Loss: Below 148.37
Targets: 152.06 → 154.00
⚠️ Risk Management: Control risk and wait for a clear breakout.

Sell EUR - 4HTrade Setup
Trade Bias: Bearish (Price is making lower highs and lower lows, with recent rejection from a resistance zone.)
Entry Price: 1.0380 (After a minor pullback to previous support turned resistance.)
Stop Loss: 1.0430 (Above the recent swing high and key resistance.)
Take Profit Levels:
TP1: 1.0320 (Previous support zone.)
TP2: 1.0275 (Extended target near the next major support.)
Risk-to-Reward Ratio: 1:2+ (Depending on execution, targeting at least twice the risk.)
Trade Rationale:
Price action shows a bearish structure with lower highs and lower lows.
The market recently rejected a key resistance zone.
A pullback to 1.0380 could provide an optimal short entry before continuation downward.
Bearish momentum aligns with the overall trend, increasing the probability of further downside.
www.tradingview.com

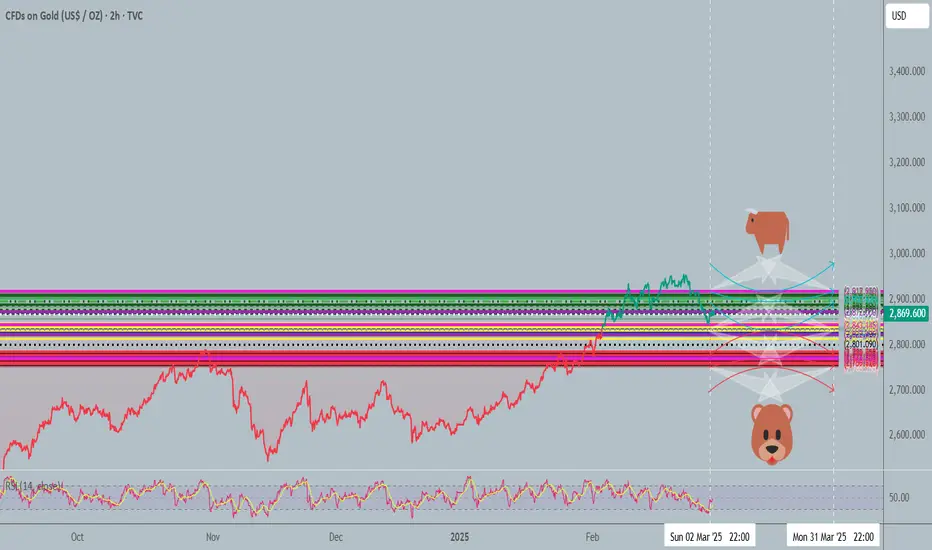
Baseline the Month 03.2025 ∷Gold∷ .B🔳Monthly baseline🔲 03.2025🐍.B
b.area
Middle-base
2895🏛
🏛2833🏛
2770🏛
Sunac China Holdings: A Distressed Developer’s Road to RecoveryThe Chinese real estate market has been in turmoil, with developers facing liquidity crises and mounting debt. Sunac China Holdings Limited (1918.HK), once a dominant player, has struggled to regain stability following severe financial distress. After defaulting on its offshore debt in 2022, Sunac embarked on an extensive restructuring process to avoid collapse.
Financial Troubles and Restructuring Efforts
In 2023, Sunac successfully completed a $9 billion offshore debt restructuring, converting part of its obligations into long-term bonds and equity. The restructuring reduced immediate repayment pressures but did not eliminate financial risks. By the end of 2024, Sunac’s total assets stood at approximately RMB 880 billion ($123 billion), while total liabilities remained elevated at RMB 972 billion ($136 billion).
Sales performance has been weak, reflecting the broader industry downturn. Sunac’s contracted sales for 2024 reached RMB 104 billion ($14.5 billion), down from RMB 523 billion ($73 billion) in 2021, highlighting the impact of regulatory crackdowns and reduced consumer demand. However, its cash balance improved slightly to RMB 38 billion ($5.3 billion), aided by asset disposals and government easing measures.
Market Conditions and Government Support
China’s property sector remains fragile, but recent government policies offer some support. Mortgage rates have been lowered, and restrictions on home purchases in key cities have eased, which could provide a demand boost. Sunac, with its extensive portfolio, stands to benefit from these policy adjustments, though recovery will be gradual.
Stock Performance and Investment Risks
Sunac’s stock has been highly volatile. Trading at HKD 1.80 in early 2025, it remains far below its peak of HKD 42 in 2020. Despite restructuring, Sunac’s high debt burden and ongoing project delays pose significant risks to investors. Credit rating agencies still classify Sunac’s bonds as distressed, with yields reflecting continued default concerns.
Investment Outlook
For high-risk investors, Sunac presents a speculative opportunity. If China’s property sector stabilizes and Sunac can improve sales, there is upside potential. However, liquidity risks remain high, and its ability to meet long-term obligations is uncertain. Investors should approach with caution, considering the ongoing financial and regulatory challenges.

Rebuy Setup For VTHO (12H)After its sudden pump, the price is now correcting. Along its path, there is a confirmed swap zone, which serves as a key area for scalping this coin.
In spot trading, with proper stop-loss placement and volume management, we can place buy orders within the green zone.
Targets are marked on the chart.
A daily candle closing below the invalidation level will invalidate this analysis.
For risk management, please don't forget stop loss and capital management
When we reach the first target, save some profit and then change the stop to entry
Comment if you have any questions
Thank You

BTC dell 120.000$📊 BTCUSDT Analysis:
Current Price: $102,859.06
Sell Zone: Near $120,000.00 (🟢 Major resistance)
Support Zone: $77,777.00 (🛡️ Key level for potential rebound)
🚨 Signal:
Bearish Scenario: If BTC reaches $120,000.00, it’s a sell opportunity 📉.
Bullish Scenario: In a strong bull trend (📈), you can buy dips around $77,777.00 (🚀 support area).
💡 Strategy:
Take profits near $120,000.00 🎯 if already holding BTC.
Watch for entries at $77,777.00 🔍 if BTC retraces.
📈 Trend: Overall Bullish unless support at $93,175 or $77,777 breaks (🔻).
🔐 Risk Management:
Stop-loss for buys: Below $73,316.18 (⚠️ Critical level).
Let me know if you need further clarification or tailored strategies!

My FINAL Bitcoin chart and Idea (forever)Everyone is too busy focusing on the wrong Technicals. Fear and Greed, RSI, MACD, Stock Markets, etc. All of these are good tools but we have to remember a few things:
1. Zoom out (Bitcoin follows the same 4-year cycle every time... this time is NOT different)
2. Keep it Simple (I'm tired of messy charts, only put what you need for the current timeframe)
3. Avoid Leverage (These areas are too risky and much too volatile... liquidity is getting grabbed at almost every level) Stay safe.
I expect Bitcoin to retrace to $57k and then bounce back up... clear skies ahead if we can break out of this pattern I have drawn up. (If not we keep ranging as follows until we break significantly above the previous ATH)
Peace out! It's been fun... I may return to crypto one day (if ykyk)

EMA Crossover StratBuy and Sell signals based on EMA crossovers with buy and sell signals as well and TP abd SL

EUR/USD: Liquidity Grab in Motion - 2H View for Precision Lining up the play on the 30M, but posting the 2H for a cleaner look—this setup is all about patience. Buy-side liquidity (BSL) needs to get swept first before I entertain any sells. Once that liquidity grab is in the bag, I’m looking to ride price down into the 4H order block (blue zone) for the real reaction.
No guessing, no forcing—just calculated execution. Let the market tip its hand first.
#Forex #EURUSD #SmartMoney #LiquiditySweep #OrderBlock #PrecisionTrading #NoFOMO
Bless Trading!

EUR/USD: Setting the Trap - 12H for ClarityZooming out to the 12H for a clearer view—bullish intent is set, but I’m not biting just yet. The real move begins once inducement gets swept and that 4H order block (blue zone) gets mitigated.
That 30M supply (red zone)? Just an internal move that needs tapping before price pushes lower into the real demand. Once that happens, I’ll be watching for my confirmation to strike.
No chasing—just precision. Let the market show its hand first.
#Forex #EURUSD #SmartMoney #Inducements #OrderBlock #TradeWithPatience
Bless Trading!

Bitcoin - Weekly Forecast - Technical Analysis & Trading Ideas!Midterm forecast:
73777.00 is a major support, while this level is not broken, the Midterm wave will be uptrend.
Technical analysis:
A trough is formed in daily chart at 78181.05 on 02/28/2025, so more gains to resistance(s) 98489.63, 101430.12, 105431.17 and more heights is expected.
BITSTAMP:BTCUSD
Take Profits:
94200.00
98489.63
101430.12
105431.17
109932.89
115000.00
120000.00
125000.00
130000.00
134142.91
__________________________________________________________________
❤️ If you find this helpful and want more FREE forecasts in TradingView,
. . . . . Please show your support back,
. . . . . . . . Hit the 👍 BOOST button,
. . . . . . . . . . . Drop some feedback below in the comment!
🙏 Your Support is appreciated!
Let us know how you see this opportunity and forecast.
Have a successful week,
ForecastCity Support Team

EUR/GBP: Smart Money at Play - Ready for the Upside?The market just did its thing—swept liquidity, induced early sellers, and now we’re parked inside a clean 4H order block. That’s where the real game begins.
Breakdown:
✅ Major HH broken, clearing minor liquidity + inducement.
✅ 4H order block in play—watching for bullish momentum.
✅ 30M TF will confirm the execution—waiting for the market to tip its hand.
No chasing, no FOMO—just precision. If the market respects structure, I’ll be taking this ride to the upside.
#Forex #EURGBP #SmartMoney #Inducements #TradeWithPatience
Bless Trading!

ENA Rebuy Setup (1D)The ENA structure has been bearish for a while. Given its significant drop and the upcoming support zones, we have identified two potential entry points for this asset. The target is marked on the chart.
A daily candle closing below the invalidation level will invalidate this analysis.
Do not enter the position without capital management and stop setting
Comment if you have any questions
thank you
