NVDA LTFLocal price action - the gap from 4/29 was filled in, but it left another gap on 4/30. During aftermarket hours, the price jumped up and approached the weekly level above but got rejected and finished the day red. We got a naked untapped pivot point below along with the range POC point of control.. not a bad week of price action.
From a range perspective price deviated to both sides and finisheded the day seemingly falling back into range. Let's see how the week ends.
Pivot Points

Nvda low time frameLocal price action - the gap from 4/29 was filled in, but another was left on 4/30. During aftermarket hours the price jumped up to approach the weekly level above and dropped back down. We got a naked untapped pivot point below along with the range POC point of control, not a bad week of price action.

btc fibonacci levels Trade Strategy
Long to May 4 High:
Entry: If BTC breaks above $94,310 (Square of Nine 90°) with a green candle, enter long.
Target: $96,472 (Square of Nine 720°), aligns with your $95,976.36.
Stop-Loss: Below $92,781 (Square of Nine -360°), risking ~$1,500.
Time: Exit by May 4 (50-day cycle).
Short for May 14 Dip:
Entry: If BTC reaches $96,472 and shows rejection, enter short.
Target: $91,567 (Square of Nine -720°).
Stop-Loss: Above $96,472, risking ~$1,000.
Time: Expect the dip by May 14 (60-day cycle).

ETHEREUM is getting ready for a major breakout (12H)This analysis is an update of the analysis you see in the "Related publications" section
The red zone represents a supply area based on the Philip strategy. It’s possible that the price might not be able to break through this zone on the first attempt. If the price gets rejected, the lower green box will be a re-entry opportunity for those who missed the move.
Let’s closely monitor this chart and see how it plays out.
A daily candle closing below the invalidation level will invalidate this analysis. invalidation level : 1198$
For risk management, please don't forget stop loss and capital management
When we reach the first target, save some profit and then change the stop to entry
Comment if you have any questions
Thank You

ZK Secondary trend.-82% Wedge. Reversal zones. 01 05 2025Logarithm. Time frame 3 days. Decrease from listing about -82%. For cryptocurrencies of such liquidity and capitalization, this is not the maximum decrease (-90-96%). But sometimes from such values as now (-82-85%), taking into account the news hype during the listing "whales $ 458 million", a reversal and strong pumping can occur under the market as a whole. For example, like another hype project of "hanging noodles" - Flare (distributed to XRP holders). Decrease by -82% and then pumping slightly above the listing price under the next alt season of the cycle + 560%.
This does not necessarily mean that this will happen, this is an example of what happens from such values of decline with such liquidity and hype. In some ways, not only in the structure of the TA formation, but in the hype and disappointment of "investors", the projects are identical.
Main trend , and the previously shown zone, in which the price is now.
ZkSync Main trend. L2 for ETH. $458 million funds 21 02 2025
Main trend now in the moment (full trading history).
There is no need to guess the minimums and maximums. It is important to know these zones and have an acceptable average price, from the position of the trend and its potential. It is regulated by the distributed entry volume (in advance) at potential reversal zones.

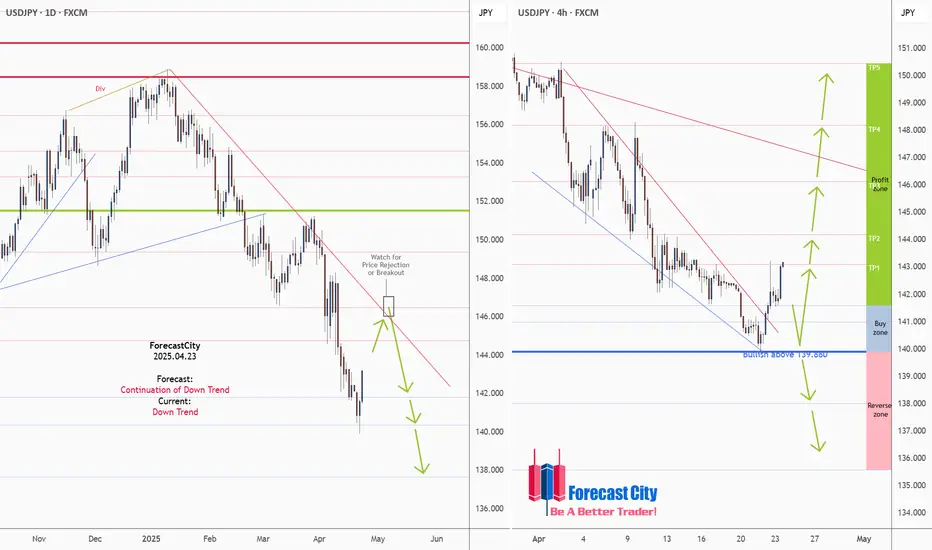
USDJPY Daily & H4 Forecasts, Technical Analysis & Trading IdeaTechnical analysis is on the chart!
No description needed!
FX:USDJPY
________________________________________________________________
❤️ If you find this helpful and want more FREE forecasts in TradingView,
. . . . . . . . Hit the 'BOOST' button 👍
. . . . . . . . . . . Drop some feedback in the comments below! (e.g., What did you find most useful? How can we improve?)
🙏 Your support is appreciated!
Now, it's your turn!
Be sure to leave a comment; let us know how you see this opportunity and forecast.
Have a successful week,
ForecastCity Support Team
EUR/JPY For Bullishwait for pull-back near by entry point and then go long
general trend is up trend
JPY under pressure
have fun :)

XAG/USD For Bearishwait for pull-back near by entry point and then go short
general trend is down trend
current phase is pull-back
have fun :)

XAU/USD For Bearish as pull-backwait for pull-back near by entry point and then go short
general trend is up trend
current phase is pull-back
have fun :)

INIT buy/Long Setup (4H)On INIT chart we do not yet have a bearish CH on the chart, and within the substructure, we can look for potential buy/long positions.
There is an unmitigated POI zone, and once the price reaches this area, we can look for buy/long setups.
The targets are marked on the chart.
A daily candle close below the invalidation level will invalidate this analysis
Do not enter the position without capital management and stop setting
Comment if you have any questions
thank you

ORCA Buy/Long Setup (4H)The ORCA structure is bullish and shows strong bullish momentum. Therefore, we can look for buy/long positions at the origins of the moves.
We have identified two entry points on the chart, where we will be looking for buy/long setups.
Target levels are marked on the chart.
A daily candle closing below the invalidation level will invalidate this analysis.
Do not enter the position without capital management and stop setting
Comment if you have any questions
thank you

Nifty Analysis EOD - April 30, 2025 - Wednesday🟢 Nifty Analysis EOD - April 30, 2025 - Wednesday 🔴
🗓️ One more expiry day ended in suspense, surprise and a last-minute spike!
📊 Nifty Summary
Nifty opened slightly green at 24,342, just 6 points above the previous close. A quick dip below the previous day’s low was swiftly recovered, triggering a rally towards 24,400. However, most of the session turned into a slow grind between a narrow 40-point range as both bulls and bears hesitated.
As is typical on expiry days, a sudden burst in the last 5 minutes added 198 points to the move — a nightmare for option sellers but a jackpot for Hero-Zero traders. The day’s true intraday close stood at 24,243, while settlement was at 24,334, reflecting a wide 90-point gap traders must factor in.
🕔 Intraday 5 Min Time Frame Chart
🔁 Intraday Walk
🔹 Opened at 24,342 with a quick drop below PDL, then rebounded.
🔹 Rallied to 24,400 within the first 30 minutes.
🔹 Ranged for hours between 24,330–24,370 with no clear breakout.
🔹 A 198-point spike in the final 30 minutes caught most off-guard.
🔹 True intraday close = 24,243 vs. settlement = 24,334 → Huge difference!
⏱ Intraday 75 Min Time Frame Chart
📐 75-Min Chart Analysis / Zone Commentary
The last 3 sessions showed repeated failed attempts to close above 24,365 (the previous week's high). A symmetrical triangle was clearly visible and delivered a classic trap: a false breakout, a liquidity grab, and an immediate pullback to meet the pattern’s target. Unfortunately, the real breakout happened around 2:35 PM — just after most had packed up for expiry!
📅 Daily Time Frame Chart
🕯️ Daily Candle Breakdown
Today’s Candle Type: Spinning Top (Bearish Tilt)
Today’s OHLC:
Open: 24,342.05
High: 24,396.15
Low: 24,198.75
Close: 24,334.20
Change: –1.75 (–0.01%)
Know How of Candle Type:A Spinning Top reflects indecision — a small body with long shadows shows a battle between buyers and sellers with no clear winner.
Key Observation:
Real Body = 7.85 points → Minimal net movement
Upper Wick = 54.10 pts
Lower Wick = 143.30 pts → Stronger buyer defense but weak follow-through
What It Implies:Buyers showed strength at lower levels but couldn't close strong. Despite the strong lower wick, the red close tilts sentiment mildly bearish. The breach of previous day’s low confirms weakness unless reversed tomorrow.
⚔️ Gladiator Strategy Update
Strategy Parameters:
ATR: 313.49
IB Range: 126.40
IB Category: Medium IB
Market Structure: Balanced
Trade Highlights:
📉 No Trade Triggered
Gladiator system remained silent today amidst the choppy expiry behavior.
🔮 What’s Next? / Bias Direction
Although the larger bias had been mildly bullish, the breach of the 24,290 low shifts the short-term view to slightly bearish. However, one more session confirmation is needed before taking any aggressive stance.
📌 Support & Resistance Levels
🔺 Resistance Zones:
24,290 (PDL)
24,330 ~ 24,360 (Immediate hurdle)
24,396 (CDH)
24,457 (PDH)
24,480 ~ 24,540 (Incl. 24,500 psych level)
24,800
🔻 Support Zones:
24,190 ~ 24,225
24,120
24,050
24,000 ~ 23,950
23,820
23,710 ~ 23,660
23,500
23,410 ~ 23,370
23,215
💬 Final Thoughts
“Expiry days are for the patient and the prepared. Today was a perfect example of how calm waters can suddenly become tidal waves.”The pattern, structure, and volatility continue to show that structure is key — respect it when it holds, and adapt when it breaks.
✏️ Disclaimer ✏️
This is just my personal viewpoint. Always consult your financial advisor before taking any action.

JOE Looks Bullish (1D)A 3D divergence is visible on the chart, indicating that sellers have exited their short positions.
A key trigger line has been broken, and the price has reclaimed critical levels.
We have identified two entry points where we plan to open buy/long positions.
A daily candle closing below the invalidation level will invalidate this analysis
Do not enter the position without capital management and stop setting
Comment if you have any questions
thank you

ALGO/USDTThe coin is exhibiting a local bullish market structure. A long position may be considered from the marked demand zone, contingent on favorable entry conditions. Upside targets are set at 0.2389, 0.2602, and 0.3078

SATS Buy/Long Setup (1H)Given the bullish structure, the formation of bullish BOS (Break of Structure), the preservation of the trendline, and the absence of any significant supply zone in front of the candles, we can consider entering this setup with proper risk and capital management.
The targets are marked on the chart. If the stop-loss is hit, it will indicate the invalidation of this trade and the position should be closed accordingly.
Do not enter the position without capital management and stop setting
Comment if you have any questions
thank you

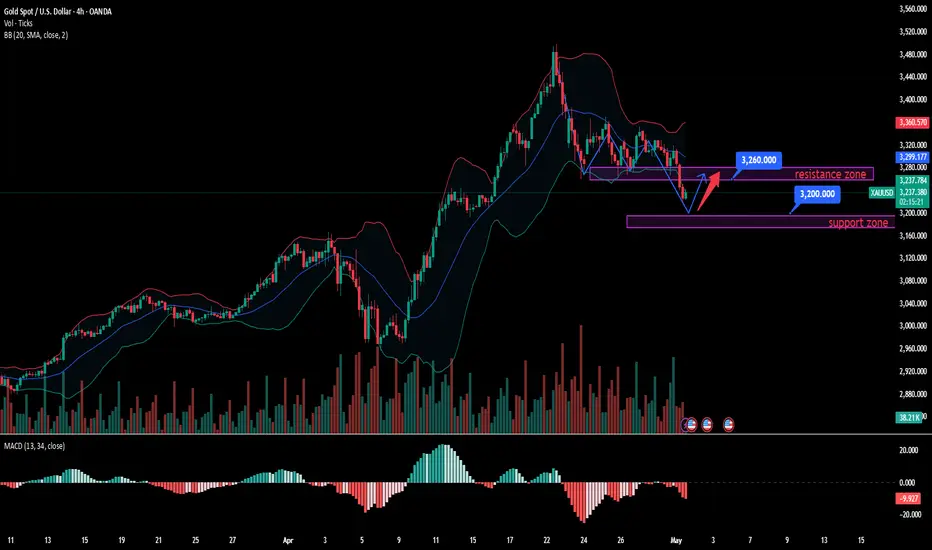
XAUUSD:Sharing of the Latest Trading StrategiesYesterday, catalyzed by the ADP and GDP data, gold rebounded. However, today the United States and Ukraine reached an agreement, and the Trump administration hinted at a possible reduction in tariffs on some trading partners. The market's expectation for the relaxation of the trade situation has increased, leading to a decline in the safe - haven demand for gold. Currently, the key support level has been broken. The support at 3,260 has turned into resistance, and the important technical support below is at 3,220. Above this level, a rebound can be expected. If 3,220 is broken, the strong support at 3,200 will be the next target. But before it is broken, it is advisable to go long. There will be important data such as the non - farm payrolls released on Thursday and Friday. Do not blindly chase the short - side.
The signals in the introduction have brought about continuous profits, and accurate signals are shared every day. Hurry up and click to get them!
👇 👇 👇 Obtain signals👉👉👉
LEVER Looks Bullish (4H)The structure of the Lever symbol has turned bullish.
Within the internal substructure, we are looking for buy/long opportunities.
We have identified and marked two optimized entry points on the chart. These are the levels where we plan to open positions.
Target levels have been set.
A daily candle closing below the invalidation level will invalidate this analysis.
Do not enter the position without capital management and stop setting
Comment if you have any questions
thank you

UK100 Bulls Charging – Will They Breach 8,490 or Stall?Price is currently consolidating just below the 8,490 🔼 resistance after a strong bullish rally. The structure remains bullish with consistent higher lows, and price is testing a key supply-turned-resistance zone. Bulls need a clear breakout to maintain momentum.
Support at: 8,378 🔽, 8,165 🔽, 7,935 🔽, 7,600 🔽
Resistance at: 8,490 🔼, 8,625 🔼, 8,729 🔼
Bias:
🔼 Bullish: A confirmed breakout above 8,490 could trigger a continuation toward 8,625 and 8,779.
🔽 Bearish: Rejection at 8,490 or break below 8,378 could initiate a drop back to 8,165 or lower.
📛 Disclaimer: This is not financial advice. Trade at your own risk.

AMD Key Long-term LevelsThese are key Long-term Levels for AMD.
Currently it is reacting positively at the key support zone of 80 to 90.
Considering the earnings release date is on 6th May 2025, monitoring the price action post earnings need to be observed. Any positive impact could possibly push the price higher.
The next key Target in the medium-term is around 120 to 130 Level.
Disclaimer:
This chart is for educational purposes only and does not constitute financial advice.

#ETHUSDTTwo areas for selling trades are marked with a reward of one to three. It is better to enter in the higher area because it is less risky, and the lower area is more risky because the price may hit the lower area stop to reach the upper area.

USDT Dominance Update (12H)It seems it can drop a bit more. Upon reaching the green box, it could reverse upwards and lead to a market correction in crypto.
In the green zone, caution is needed, and new purchases in the crypto market should be accompanied by precise capital management.
For risk management, please don't forget stop loss and capital management
Comment if you have any questions
Thank You

Short-term BTC (Long & Short) Strategies12HR Supply Box
MITIGATED FVG
Only look for "Missed Pivot" Indicator and a pin bar candle to plan a short entry
SL is going to be swing high above pinbar candle
BTC bullish if BTC breaks 95,164.3 on 1D chart (in 13hr) to long $96,484.1 (1.38%)
If market drops below 95,164.3,
buy Long on 20 day average (around $90,126) or
Buy at $93,802.5 @ Support (BUT must see Pin bar Support Candle w/ "Missed Pivot" signal indicator) SL below the pinbar
Tip: only open trade on TAP new FVG
This is only suggestion, trade responsibly.

EUR/GBP For Bullish as pull-backwait for pull-back near by entry point and then go long
general trend is down trend
current phase is pull-back
have fun :)
