Pundi X: What One Does, The Rest Follows!Pundi X is growing more than 70% in a single day and more than 140% since the 7-April bottom low, this is what will happen with all the Altcoins.
Notice the chart pattern, it is the same as all the others we've been looking at in the past three weeks.
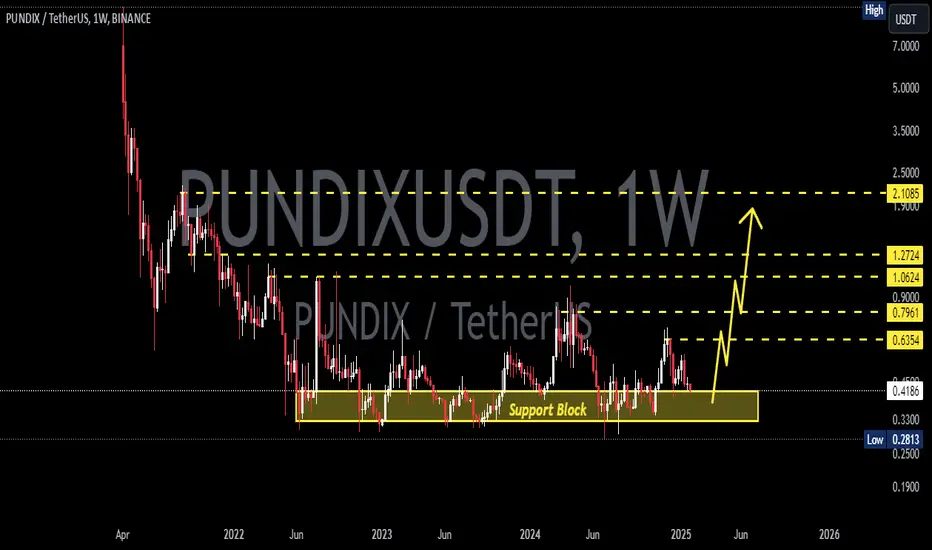
» A strong bullish wave starts November 2024 and ends December 2024.
» The end of this bullish wave marks the start of a strong correction.
» This correction ends up producing a lower low compared to the start of the previous bullish wave. (Some pairs are producing higher lows —the stronger ones.)
» This low or higher low ends up happening exactly on the 7th of April.
» The session that produced the low has either low bearish volume or ended up closing green.
» Trading volume starts to rise after this major low with a small recovery and then...
» A massive bullish jump, a strong breakout to market the start of the next bull market phase.
Most of the Altcoins are producing the exact same fractal, same price dynamics and chart patterns. All that is left, is for the bullish breakout. We will see hundreds of pairs moving up at the same time in the coming days. May is just around the corner, this is the month when everything will grow.
Are you ready?
Thank you for reading.
Namaste.
Pundixusdt

PUNDIXUSDT 1DPUNDIX ~ 1D Analysis
#PUNDIX Buy after successfully penetrating the resistant line of this pattern with a short -term target of at least 10%+.

PUNDIXUSDT 1WPUNDIX ~ 1W Analysis
#PUNDIX This is the lowest support block for now. Buy from here if you still have a Conviction on Coin. with a minimum target of 20%+.

PUNDIXUSDT 1WPUNDIX ~ 1W Analysis
#PUNDIX So far it still maintains this support block. Buy from here if you still have a Conviction on this coin with a minimum target of 20%+
PUNDIXUSDT IDEA WEEKLY TIMEFRAMEBINANCE:PUNDIXUSDT
Pundix Usdt weekly time frame bullish bottom out.
I think it will blast upto 150% 200%.
NOT A FINANCIAL ADVISE DYOR

PUNDIXUSDT(PUNDIX) Daily tf Range Updated till 01-05-24PUNDIXUSDT(PUNDIX) Daily timeframe range. PA struggling here. volume is draining but 0.5403 needs to hold or space till 0.4006 is pretty much open if 0.5403 breaks clean. if 0.5403 can hold than it will test 0.7383 again.

PUNDIX/USDT Main trend. Channel. Triangle. 21 10 2023Major trend. This idea is a continuation of a closed idea on this pampa coin published 1.5 years ago before a series of significant pumping (in a bear market) in the process of forming a channel with a wide range.
PUNDIX/USDT Major trend. Downtrend channel. Pivot zone
The main trend is a descending channel. Now the volatility is narrowing under the descending trend line, and a descending triangle is forming. The reversal zone. The denouement in the near future.
The descending triangle itself is a bearish formation, but at the moment it has formed at -91% of the price highs (liquid high zone, not listing) and under the descending trend channel. This is a positive sign. It is important to hold the "level" of 0.3181.
It is worth noting that due to low liquidity, all price movements have a huge percentage. Stops on such coins due to price slippage (low liquidity) are useless, even with a large step (irrational). It is preferable to work from the average set/reset price with a pre-allocated position according to your risk management. The exception is protecting profits or entering a trade with stop loss after they are knocked out (very hard to catch in time).
1) Breaking a downtrend under a pamp alts - trend reversal. Significant Pump.
2) Breakdown of descending triangle support - dump, descending triangle targets.
Line chart.
Locally given large triangle in its final phase of formation.

PUNDIX/USDT A successful break the key resistance will bullish!💎 Paradisers, #PUNDIX has recently exhibited significant market dynamics. Currently, PUNDIX is attempting to move upward and break out of the key resistance area.
💎 However, it has faced rejection multiple times in the past when trying to break out. If PUNDIX successfully breaks above the resistance area this time, it could potentially continue its upward movement and reach our target area at the strong resistance level.
💎 On the other hand, if PUNDIX fails to break out of the resistance area once again, there is a possibility of it retracing back to the support area around $0.76 to gather momentum for another attempt.
💎 At the support area, it is crucial for PUNDIX to bounce and resume its upward movement in order to make another breakout attempt. However, if PUNDIX breaks below the support, it could confirm a bearish trend continuation, leading to further downward movement.
MyCryptoParadise
iFeel the success🌴

PUNDIXUSDT(PUNDI X) Daily tf Range Updated till 05-04-24PUNDIXUSDT(PUNDI X) Daily timeframe range. not very far from 0.9598 when it took a retrace. now it needs to stay above 0.7500 to reach there again. or else breaking 0.7500 clean will led it to 0.5908.

PUNDIX/USDT in a Perfect Position to Rally? 👀🚀PUNDIX Analysis💎Paradisers, turn your attention on #PUNDIXUSDT, as the current indicators point towards a potential bullish resurgence from a key support zone.
💎In our latest analysis of #PundiX's market behavior, we've observed a 36% retracement from its recent high. Nonetheless, the steadfastness at the $0.529 support level suggests a potential for upward movement.
💎While challenges in surpassing previous highs or breaking past records have led to a short-term bearish sentiment, the $0.529 threshold remains critical for #PUNDIX. This level is on the verge of initiating a significant bullish wave with further assessment.
💎Being strategic in our trading approach means having a Plan B. Should #PUNDIX's strength at this support wane and it descends further, we're set for a bullish recovery starting from the next support at $0.437. It's important to note, however, that a breach below this marker could indicate the onset of a deeper bearish phase.
💎Keep your trading strategies flexible and your eye on the market, Paradisers. Your ParadiseTeam is closely monitoring, poised to steer you through these evolving market conditions.

PUNDIX/USDT Gearing for a Bullish Leap? 👀🚀PUNDIX Analysis💎Paradisers, let's take a closer look at #PUNDIXUSDT, as the current trend suggests a strong possibility for a bullish recovery from its important support zone.
💎Examining #PundiX's recent market trends, we've noticed a steady 33% decrease from its latest peak. Yet, its resilience at the support level of $0.365 indicates the likelihood of an upward trajectory.
💎Despite difficulties in reaching new highs or breaking through past levels, which has contributed to a temporary bearish outlook, the $0.365 mark is pivotal for #PUNDIX. This level could be the catalyst for a significant bullish movement upon another test.
💎As strategic traders, we're always prepared with an alternative plan. If #PUNDIX weakens at this support and drops further, we're aiming for a bullish resurgence from a secondary support level at $0.313. However, be aware, falling below this level might point to more pronounced bearish trends.
💎Stay versatile with your trading strategies and keen on the market's pulse, Paradisers. Your ParadiseTeam is diligently observing, ready to provide guidance through these market shifts.

#PUNDIX/USDT#PUNDIX
The price is moving in a downward channel and sticking to its limits well
It was penetrated upwards forcefully and was stabilized above it
We have a higher stability Moving Average 100 in red
We have an uptrend on the RSI that the price is following well
Entry price is 0.4734
The first target is 0.5022
The second target is 0.5352
The third goal is 0.5748

PUNDIXUSDT 1D LONG📈Hi all. PUNDIX has been forming a triangle for almost 2 years. I am considering a long break/retest. Marked targets and levels on the chart.

PUNDIX in SPOT gets ready for at least 3xPUNDIX in spot makes huge bullish movements in 1W timeframe and is expected to make 3x from here.

pundix breakout confirmed with potential 150% bullish wave seems like pundix is ready too with the trend
symmetrical triangle breakout confirmed recently expecting pretty decent recovery in coming days expecting 120 to 150% bullish wave in coming days

PUNDIXUSD 1W#PUNDIX ~ 1W 📈
Make purchases gradually from here, target at least 20%. This is a risky trade.

Support range: 0.3113-0.3560Hello?
Hello traders!
If you "Follow" us, you can always get new information quickly.
Please also click “Boost”.
Have a good day.
-------------------------------------
(PUNDIXUSDT chart)
The key is whether the price can be maintained by rising above the 0.4288-0.5108 range.
(1D chart)
On the current chart, it appears that it must rise above at least 0.759 to escape the bottom section.
If you touch the HA-Low indicator, go up, touch the HA-High indicator, and then fall again and touch the HA-Low indicator, it is considered to be a trend reversal period.
Accordingly, we can see that the trend reversal has failed so far.
This time, if it receives support in the 0.3113-0.3560 range and rises above the 0.3830-0.43 range to maintain the price, it is expected that the trend will be successfully reversed.
However, we need to check whether it can rise above the previous box range of 0.4720-0.6470.
-------------------------------------------------- -------------------------------------------
** All explanations are for reference only and do not guarantee profit or loss in investment.
** Trading volume is displayed as a candle body based on 10EMA.
How to display (in order from darkest to darkest)
More than 3 times the trading volume of 10EMA > 2.5 times > 2.0 times > 1.25 times > Trading volume below 10EMA
** Even if you know other people’s know-how, it takes a considerable amount of time to make it your own.
** This chart was created using my know-how.
---------------------------------

A huge breakout for Pundi X!!Will we see all time highs coming in this breakout!? We'll have to wait and see. It looks like it's definitely pushed through and doesn't seem like it's slowing down as of yet.

Finally Pundix Breaking Long Downtrend Seems Like Pundix Has Already Bottomed Out Moving Averges Golden Cross Also confirming Strength Of Pundix
Testing More Then Year Old Trendline Incase Of breakout Expecting 180 To 200% Bulish Move


PUNDIX formed big bullish Gartley for upto 15% pumpHey dear friends, hope you are well and welcome to the new trade setup of PUNDIX with BTC pair.
On a daily time frame, PUNDIX has formed a bullish Gartley setup
Note: Above idea is for educational purpose only. It is advised to diversify and strictly follow the stop loss, and don't get stuck with trade

PUNDIX formed big bullish Gartley for upto 89.50% pumpHi friends, hope you are well and welcome to the new trade setup of PUNDIX with US Dollar pair.
On a 4-hour time frame, PUNDIX has formed a bullish Gartley pattern.
Note: Above idea is for educational purpose only. It is advised to diversify and strictly follow the stop loss, and don't get stuck with trade

Pundi X (PUNDIX) - August 1Hello?
Welcome, traders.
By "following", you can always get new information quickly.
Please also click "Like".
Have a good day.
-------------------------------------
(PUNDIXUSDT 1W Chart)
The key is whether it can be supported in the 0.772-0.910 section.
(1D chart)
Primary resistance: 0.841
Secondary resistance: 0.910-0.963
Support: 0.738-1.772
In order to continue the upward trend, it must rise above the HA-High indicator.
therefore,
- Maintain the price by rising above 0.963 as it is, or
- It should go down, causing the HA-High indicator to decline.
In order for the uptrend to continue, the horizontal line of the HA-Low indicator must be longer than that of the HA-High indicator.
It is expected to swing up and down to reverse the trend in the current flow.
If the price holds above 0.578, I think it is likely to lead to further gains.
------------------------------------------------------------ -------------------------------------------
** All indicators are lagging indicators.
Therefore, it is important to be aware that the indicator moves accordingly with the movement of price and volume.
However, for the sake of convenience, we are talking in reverse for the interpretation of the indicator.
** The MRHAB-T indicator used in the chart is an indicator of our channel that has not been released yet.
** The OBV indicator was re-created by applying a formula to the DepthHouse Trading indicator, an indicator disclosed by oh92. (Thanks for this.)
** Support or resistance is based on the closing price of the 1D chart.
** All descriptions are for reference only and do not guarantee a profit or loss in investment.
(Short-term Stop Loss can be said to be a point where profit and loss can be preserved or additional entry can be made through split trading. It is a short-term investment perspective.)
---------------------------------
