$HII Earnings Beat and Breakout ContinuationI have been long this name since April 17th. I held through earnings as it has been a slow but steady gainer.
Revenue did fall about 2% YOY. However, this is a good candidate for the new ship building initiative.
If you like this idea, please make it your own and be sure to follow "your" rules of trading. If you like this idea or any others I publish (and they are not always right) follow me on X where I post more often.
Huntington Ingalls Industries Beat Expectations
Thursday, May 1, 2025 at 7:15 AM ET
Huntington Ingalls Industries (HII) reported earnings of $3.79 per share on revenue of $2.73 billion for the first quarter ended March 2025. The consensus earnings estimate was $2.90 per share on revenue of $2.79 billion. The Earnings Whisper number was $3.00 per share. The company beat expectations by 26.33% while revenue fell 2.53% compared to the same quarter a year ago.
The company said it continues to expect 2025 revenue of $11.80 billion to $12.20 billion. The current consensus revenue estimate is $11.95 billion for the year ending December 31, 2025.
HII is a global, all-domain defense partner, building and delivering the world’s most powerful, survivable naval ships and technologies that safeguard our seas, sky, land, space and cyber.
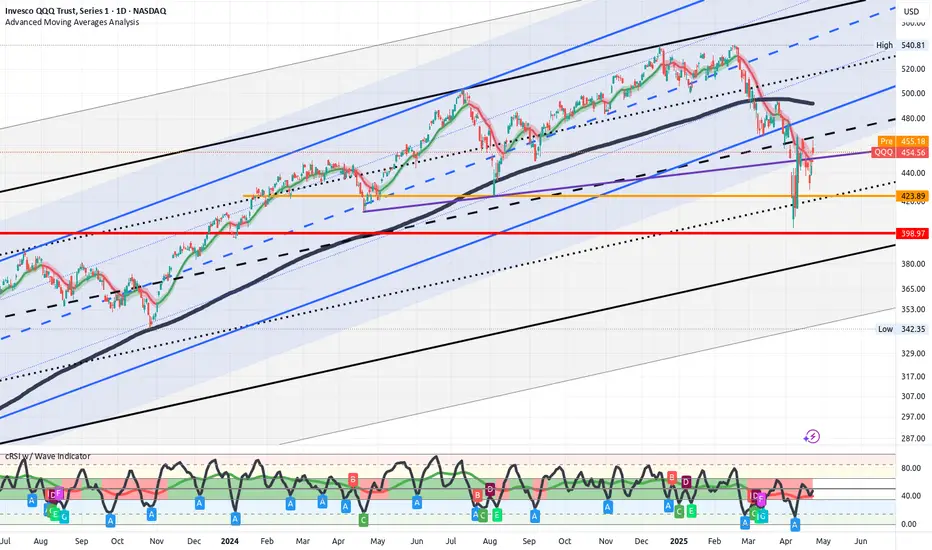
QQQ

SPY/QQQ Plan Your Trade For 5-1 : Bottom-104Today's Bottom pattern suggests the markets will attempt to move downward - trying to find support.
Even though it may appear my May 2-5 Major Bottom pattern will not happen as I expect - this is a very good lesson for traders.
I'm not 100% accurate all the time. Sometimes, the markets do things that are not aligned with my research/patterns and sometimes the markets can be far more irrational than traders expect.
For example, I believe this current rally is more of a speculative rally in the SPY/QQQ/BTCUSD. There is nothing I'm seeing in the Crash Index (or TRAN) to support this upward price move other than traders attempting to "buy the dip".
Ultimately, I believe the current contraction in the global economy based on policies, tariffs and economic disruptions will continue to drive a consolidation, basing type of price trend, traders are buying into this dip and attempting to drive price upward on expectations of a growing global economy.
Time will tell how things play out - but my longer-term modeling systems are still Bearish.
I will be on the road with my father today - so I'm not going to be as available to answer questions.
Watch this video twice if you need to. It will be interesting to see how the next 5+ days in the markets play out.
As I stated, I'm not 100% accurate all the time. I do my best to try to help guide all of you through these market trends with my research and cycle patterns - but, that is not enough to guarantee 100% accuracy on any trade.
That's just how it is in the world. No one is 100% perfect at predicting market moves.
Get some.
#trading #research #investing #tradingalgos #tradingsignals #cycles #fibonacci #elliotwave #modelingsystems #stocks #bitcoin #btcusd #cryptos #spy #gold #nq #investing #trading #spytrading #spymarket #tradingmarket #stockmarket #silver

anyone that is buying is missing outgreat discounts I guess sir Warren Buffet is to buy now? still this good discounts are for everyone to buy.

SPY/QQQ Plan Your Trade Update For 4-30 : Moving Into FlaggingThis quick update video should help you understand how my May 2-5 Major Bottom pattern could represent a move into FLAGGING within an inverted EPP pattern.
If my research is correct, the next move for the market will be a moderate downward price trend that will represent the FLAGGING portion of the inverted EPP pattern.
You've all see how bullish EPP patterns play out over the past 3 to 5+ months. Now we get to see how this recent SPY low near 480 turns into an inverted EPP pattern. This is basically the same pattern - but forming in an inverted mode.
As we transition through this inverted EPP pattern, what I'm looking for is a breakdown move to create the new FLAGGING formation. This move aligns perfectly with my May 2-5 Major Bottom pattern and could be a perfect setup for the attempted "breaking of the Flag High" in late May 2025.
I'm watching Gold and Silver stay relatively strong today. So I'm seeing today's market move as a "reversion move" - not really a breakdown move (yet).
It will be interesting to see how this plays out.
If the markets move into Flagging, as I expect, the big opportunities will be to ride the Flagging & Breakdown patterns over the next 30+ days before we move into either an INVALIDATION or CONTINUATION phase of the inverted EPP pattern.
Price is the ultimate indicator - you just need to know what to look for.
Get some.
#trading #research #investing #tradingalgos #tradingsignals #cycles #fibonacci #elliotwave #modelingsystems #stocks #bitcoin #btcusd #cryptos #spy #gold #nq #investing #trading #spytrading #spymarket #tradingmarket #stockmarket #silver

SPY/QQQ Plan Your Trade For 4-30 : Carryover PatternToday's Carryover pattern suggests the markets may attempt to trend slightly upward after the big downward pressure/GAP sets up this morning.
As many of you are already aware, I have been predicting a May 2-5 Major Bottom in the markets.
I would suggest today's carryover pattern may be negated by an early breakdown in the markets. If my May 2-5 Major Bottom pattern is going to show up, the markets would likely start to break downward today and tomorrow - leading to the Major CRUSH pattern on Friday.
Gold and Silver appear to be consolidating into a flagging/cradle pattern. I believe the downward pressure on the markets will likely prompt a flush-out low in metals before another big rally phase sets up.
BTCUSD is stalling and will likely pull downward as my May 2-5 Major Bottom pattern plays out.
Basically, HEDGE your positions.
This market looks like it will roll into a moderate low over the next 4-5+ days, then base and bottom after May 10th or so.
As I've suggested, I positioned for this move about 4-5 days ago. Now, I just need to ride it out and start booking profits when they happen.
Get some.
#trading #research #investing #tradingalgos #tradingsignals #cycles #fibonacci #elliotwave #modelingsystems #stocks #bitcoin #btcusd #cryptos #spy #gold #nq #investing #trading #spytrading #spymarket #tradingmarket #stockmarket #silver

$QQQ Inverse H&S ready to GO!NASDAQ:QQQ
We’ve spotted an Inverse Head & Shoulders breakout on the 1-hour chart, and we’re currently in the retest phase.
- Measured Move (MM): $483.55
- Measured Timeframe (MT): May 1st @ 7 PM
Let’s see if we can maintain momentum tomorrow and steer clear of any unexpected news or market shocks tonight.
Not financial advice

SPY/QQQ Plan Your Trade For 4-29 : BreakAway in CarryoverToday's pattern is a Breakaway in Carryover mode.
That suggests today's price move will attempt to break away from yesterday's body range and may be somewhat similar to yesterday's price action.
I interpret this pattern as a potential breakdown (breakaway) attempting to possibly find support below 540.
Remember, we are moving into the May 2-5 Major Low cycle pattern - so price should attempt to move downward at this stage.
Gold and Silver are moving through a consolidated topping phase. Where price attempts to push higher through a series of tops. Ultimately, I believe Gold and Silver will make a big breakout move higher (above $3500, $35.00) and attempt to rally up - breaking the $4200+ level (eventually).
Bitcoin seems to be stalling, like the SPY/QQQ, near upper resistance (near the FIB 50% level).
I see this stalling as the markets searching for a trend.
As I keep saying, I have a hard time seeing any reason why the markets will rally to new ATHs in the current environment (except the possibility of pure speculation).
We need to see some real growth expectations for the markets to begin another big rally phase.
Right now, I'm looking for confirmation of my breakdown into the May 2-5 Major Bottom pattern. Let's see if that actually happens or not.
Get some.
#trading #research #investing #tradingalgos #tradingsignals #cycles #fibonacci #elliotwave #modelingsystems #stocks #bitcoin #btcusd #cryptos #spy #gold #nq #investing #trading #spytrading #spymarket #tradingmarket #stockmarket #silver

SPY/QQQ Plan Your Trade Update : Playing Into The Major BottomThis update highlights what I believe will be the last level of defense for price (support) on the SPY and why it is so important to HEDGE the markets right now.
The upward price move has reached the ULTIMATE HIGH (I believe) and is now moving into a Bullish EPP pattern (shifting into the downward pullback, then it will move into the flagging phase).
This flagging phase will be the deciding move (IMO) related to IF the markets attempt to break upward or downward near the current Fib 50% level.
This is why it is so important to HEDGE all open positions right now.
This battle zone in the markets (near the Fib 50% level) is not a guaranteed move higher or lower. Basically, we are watching the battle take place in live trading.
What we can do is try to rely on the EPP patterns and other formations to help guide us to the highest probable outcome, but we have to stay liquid and fluid as the markets trend.
Right now, I would suggest the breakdown (Major Low) outcome is about 70-80% likely. Thus, the breakaway (upside) outcome may be 20-30% likely based on my analysis.
But that could change if the SPY moves above $555.
Thank you again for all the great comments. I'm trying to help as many traders as I can. But this move to the 50% level is very "indecisive". So, I'm having to rely on Fibonacci Price Theory and other techniques (money management/HEDGING) as a way to protect my capital while I trade.
This is a great example of how you can learn techniques (beyond technical analysis) related to what to do when you really don't know what the markets may do in the near future.
The answer is HEDGE ACTIVE POSITIONS - or pull trades off (even if they are at a loss) and then HEDGE whatever you want to keep active.
No one is going to laugh when you tell them, "I protected my capital by hedging last week" when they are looking at severe losses and you are NOT looking as severe losses.
It is SMART TRADING.
Get some.
#trading #research #investing #tradingalgos #tradingsignals #cycles #fibonacci #elliotwave #modelingsystems #stocks #bitcoin #btcusd #cryptos #spy #gold #nq #investing #trading #spytrading #spymarket #tradingmarket #stockmarket #silver

SPY/QQQ Plan Your Trade For 4-28 : Inside Breakaway In TRENDToday's Inside Breakaway pattern in Trend mode suggests the SPY will attempt to break away from Friday's body range. The Weekly Bias turned to BULLISH last week.
I believe today's price move will be indicative of the rest of the week. We are moving into a very strong Major CRUSH pattern on Friday and I believe that pattern will be a big breakdown move in price.
Thus, I believe the early trading this week (today and tomorrow) will set the tone for the rest of the week.
If we see a rotation in price near the 550 level (to the downside) then my May Low pattern will likely transition into a price breakdown this week.
If we see more upside price action on Monday/Tuesday, then I would be very cautious of the end of this week as a sudden price breakdown may happen.
Gold and Silver will likely stay very muted for the next two trading days. The Canadian Elections will likely cause the US to briefly pause as one of our closest neighbors and trading partners moves through this pivotal election.
Bitcoin will also likely pause a bit in early trading this week and BTCUSD moves up to the $95-96k upper resistance area.
I suggest traders take advantage of this pause in price action to HEDGE their open positions. I believe the bigger move is still to the downside, but I also believe the markets could continue to push a bit higher before ROLLING into that May 2-5 Major Bottom.
At this point, near the 50% Fib retracement level, the markets could break in either direction. But I still believe the May 2-5 Major Bottom will play out as a unique lower low price level - below $525-530 on the SPY.
Get some.
#trading #research #investing #tradingalgos #tradingsignals #cycles #fibonacci #elliotwave #modelingsystems #stocks #bitcoin #btcusd #cryptos #spy #gold #nq #investing #trading #spytrading #spymarket #tradingmarket #stockmarket #silver

$SPX Sell in May, Go Away, $5k, Dead Cat to $5.3k, $4.8k by EOMAlrighty. My forecast is as follows. I made a video explaining just a quick thought and here's the video in a written version for the most part. Basically, I'm a pattern chart trader and I spend the majority of my days looking for specific candlestick patterns that match candle for candle. I cannot find anything remotely close to today's Price Action besides October 2001. I have been and will continue to be doubted and that's okay. I am not here for anyone except myself and anyone that wants to gain a fresh unbiased perspective. People have called me a Permabear but that only pertains to my personality, which is that of a realist. I do not believe investing for the next 20-50 Years will work for everyone. You'd have to do it well and continuously contribute even during the down days. Either way. This is the analog I will be following. Fib is Extended way beyond Blow Off Top measurements imo. The market gained 50% in One Year and Three Months. I'd like to think that the uncertainty being priced in will cause these Deeper Fib Retracements. We already crashed down to the 1.61 GOLDEN POCKET from above and now bounce back to Secon Golden Pocket at 2.61. Based on the past behavior, now we move back to 2.0 for a move to the original extension of the 1.00 Fib. If we lose this, we start moving back to the 1.27 near $4.74k on SPX where I will then be looking for one final dead cat to $5300 by mid August, Every July dip being grabbed up ... Final Sell in August for an End of Year Crash to Mark 2025 as one of the worst years ever in Life as far as the Market goes. Good Luck everyone. Tips always welcome.

QQQ: Bearish Continuation is Expected! Here is Why:
Our strategy, polished by years of trial and error has helped us identify what seems to be a great trading opportunity and we are here to share it with you as the time is ripe for us to sell QQQ.
Disclosure: I am part of Trade Nation's Influencer program and receive a monthly fee for using their TradingView charts in my analysis.
❤️ Please, support our work with like & comment! ❤️

$MSFT : A 'Teflon' stock refusing to budge under pressureI promised multiple times that a detailed analysis of NASDAQ:MSFT will be published. Its time, today we analyze the levels to watch for and the future price points in this stock.
A large cap stock like NASDAQ:MSFT is a difficult ship to navigate. During the recent turbulence the stock lost almost 33% of its value. Even during these times, it never broke below the prior cycle highs of 345 $ in contrast to other MAG7 stocks like NASDAQ:TSLA which then led to more than 50% downturn in the stock. But as the headline says NASDAQ:MSFT is Teflon stock with resistance to go down. In the weekly chart we see that the stock never broke below the midpoint of the upward sloping regression band channel which is @ 375 $.
Now where does the stock go from here? If we plot the Fib levels on NASDAQ:MSFT we see that it is firmly at 0.382 which lies at 392 $. Next level is at 415 $, and we have an earning catalyst upcoming for NASDAQ:MSFT and if the stock closes above 425 $ then we can easily touch 422 $.
Verdict : NASDAQ:MSFT keep on DCAing. Earnings quality with low volatility.

MAGS SUPER STRUCTURE FORMING CAUTION!We have MEGA superstructures forming everywhere. H&S Eiffel Towers, etc.. None will be more devastating to 401ks and people's portfolios than the MAGS breaking down from this mammoth structure.
Last chance to GTFO forming.
CAUTION is in order!
Click Boost, Follow, Subscribe. Let's get to 5,000 followers ))

S&P 500 - Key Levels and Measurements (Bonds vs Yields vs Homes)Happy Friday!!!
Starting with a BLANK chart, here are my key levels and measurements for the S&P 500
Earnings season is stable, more MAG 7 next week with AAPL, AMZN, META, MSFT
Trump and Company are softening the trade war narrative quickly and the market
is taking notice. Prices recovered nicely this week
5500 SPX is a key level for the bulls to push above - if done look for open space
melt-up into 5700-5800 resistance
If SPX rejects 5500 early next week we will be dealing with some more noise
and intermediate levels
4830 lows will be absolutely critical to maintaining a long-term bull market. You will
see why with this analysis.
Last piece is talking about bonds vs yields and the current housing market in the US
My belief is that yields stay sticky and home prices MUST drop to see any improvements
in affordability
Thanks for watching - have a great weekend!!!

𝗧𝗲𝘀𝗹𝗮 𝗕𝗿𝗲𝗮𝗱𝗸𝗼𝘄𝗻: Priced for perfectionPriced for perfection in an imperfect market
NASDAQ:TSLA nearly hit its 200dma and key resistance area (~288–292) after a roughly 20% post-earnings squeeze, and as long as it stays below that level, it risks retesting the long-term uptrend line that has marked major lows twice since COVID.
𝘛𝘢𝘳𝘪𝘧𝘧 𝘢𝘯𝘥 𝘴𝘶𝘱𝘱𝘭𝘺-𝘤𝘩𝘢𝘪𝘯 𝘳𝘪𝘴𝘬: Tesla depends heavily on Chinese-made battery and electronic components now hit by reciprocal U.S. tariffs, while over 60% of global neodymium and dysprosium—vital for its EV motors—are mined and processed only in China, creating a critical bottleneck that could sharply elevate its input costs.
𝘔𝘢𝘳𝘨𝘪𝘯 𝘱𝘳𝘦𝘴𝘴𝘶𝘳𝘦 𝘷𝘴. 𝘭𝘰𝘧𝘵𝘺 𝘷𝘢𝘭𝘶𝘢𝘵𝘪𝘰𝘯: Q1 price cuts of up to 20% on core models drove Tesla’s auto gross margin to its lowest since 2020, calling into question the sustainability of its >70× forward P/E multiple, which assumes exceptionally high profits from future ventures like robotics and autonomous fleets.
$NQ_F NASDAQ:NDX NASDAQ:QQQ NASDAQ:AMZN NASDAQ:META NASDAQ:NVDA NASDAQ:SOX $ES_F AMEX:SPY SP:SPX TVC:DXY NASDAQ:TLT TVC:TNX TVC:VIX #Stocks #TrumpTariffs 🇺🇸 #ChinaTariffs 🇨🇳

SPY/QQQ Plan Your Trade For 4-25 : Inside Breakaway patternToday's Pattern is an Inside Breakaway pattern. I suggest this pattern could play a pivotal role in how the markets setup for the May 2 Major Bottom pattern I'm expecting.
You'll see in this video how any move to the upside could present a broadening of the consolidation range - resulting in even bigger price volatility going forward.
Yet, I believe the markets will stall and roll a bit downward/sideways today. Possibly resulting in a move back into the lower consolidation range as we ROLL off resistance.
As I suggested last weekend, I see no reason to assume the markets are "cleared for take-off" yet. Tariffs and political concerns are still driving uncertainty.
I think we are seeing Q1 earnings inflate the markets while the fundamental elements of the global markets are still somewhat unsettled.
I urge traders to HEDGE any open trades going into this weekend. If the markets don't make any clear moves today, hedge any positions you hold into next week.
Gold & Silver are showing signs of minor panic selling. I see that as traders wanting to retest the $3300/$33 levels for Gold/Silver.
I still believe Gold/Silver will skyrocket higher. But, probably not going to happen today.
BTCUSD is making an interesting move higher. Potentially invalidating the previous EPP pattern and/or setting up a very broad consolidation range.
It will be interesting to see how BTCUSD continues to trend over the next few months.
Remember, I'm hopefully helping all of you find ways to improve your trading and find better results.
Get some..
#trading #research #investing #tradingalgos #tradingsignals #cycles #fibonacci #elliotwave #modelingsystems #stocks #bitcoin #btcusd #cryptos #spy #gold #nq #investing #trading #spytrading #spymarket #tradingmarket #stockmarket #silver

$GOOG Possible Demand Zone 155-143 Targeting 178 By earning!One of worst weekly candles and 3 bearish soldiers pattern made it extremely bearish but now entered the demand zone between 155 to 143 expecting accumulation into this range then possible bottom by mid of April then moving higher after earning targeting upper gap but we keep the target more secure by targeting 178 as closing trade. 161-164 is strong resistance . so the idea bye with weakness and accumulate during coming days with stop loss below 140 approx. Earning estimate 1.6 which is a drop from 2.4 last quarter by 30% - P/E at 19.98 EPS at 8.12 - Average analyst rating at 215 (+60$) from last close at 156. these fundamental make this idea is much likely to succeed. Good luck - please like and share . thanks

SPY/QQQ Plan Your Trade Update : EPP Flag Setup CompleteI created this video to highlight the current EPP Flag setup in the SPY/ES.
It is my opinion that the market are about ready to ROLL OVER into a downward trend because of this current EPP setup.
Once the FLAG forms (in this case a BULLISH FLAG), the next phase is a BREAKDOWN INTO CONSOLIDATION.
It is my belief the current FLAG will prompt a breakdown in price - moving into a lower consolidation range.
I'm highlighting this EPP pattern to help everyone learn how to use them more efficiently.
Get ready. If I'm right, we're going to see a big move downward over the next 2-4+ days.
Get some...
#trading #research #investing #tradingalgos #tradingsignals #cycles #fibonacci #elliotwave #modelingsystems #stocks #bitcoin #btcusd #cryptos #spy #gold #nq #investing #trading #spytrading #spymarket #tradingmarket #stockmarket #silver

SPY/QQQ Plan Your Trade for 4-24 : Carryover PatternToday's Carryover pattern suggests we'll see similar price action today to what we saw yesterday.
We will very likely see a little support in early trading today, followed by a moderate meltdown-type trend.
I'm not expecting much to happen today - but we could get some news or other data that may prompt some type of bigger move in the markets.
Yesterday evening, I shared an "Update" video with everyone. In that video, I highlighted some of my active trades.
I've gotten a few messages from followers asking if I can share more data related to my trades. I'm sorry, but that won't happen in these FREE Plan Your Trade videos.
I shared some of my trades yesterday to highlight how I had moved into a moderate Short/PUT position, trying to stay ahead of the bigger market trend.
In other words, I'm not chasing the nickels. I'm setup to try to profit from the DOLLARS.
Gold and Silver may stay somewhat muted over the next 48 hours. But, I do expect them to try to melt upward.
BTCUSD appears to be setting up a BULL TRAP. I, personally, don't trust this upward price move because it is counter to the EPP price structure. I could be wrong.
But right now, I just don't trust the upside move in BTCUSD, knowing the SPY/QQQ should move into a deeper MAJOR LOW in early May.
Again, these videos are designed to help you build your skills and find your own style of trading.
I really do hope all of you are benefiting from my continued work to deliver these videos.
GET SOME...
#trading #research #investing #tradingalgos #tradingsignals #cycles #fibonacci #elliotwave #modelingsystems #stocks #bitcoin #btcusd #cryptos #spy #gold #nq #investing #trading #spytrading #spymarket #tradingmarket #stockmarket #silver

QQQ - Your guess is as good as mineMarkets are all over the place. I know ground breaking info. I don't think there is any clear answer to what is next.
Even if Trump does reduce tariffs on China, they are still going to be some of the highest in recent history. However, it looks like Trump has flinched and China has the upper hand. That is just likely going to make Trump more erratic since his policies are emotional/ego driven and not strategic.
Overall, there are likely some short-term gains to be have as the market likes to always push up when not in an panic sell. For now, the worst of the news is over and the low from the other week is likely going to be the bottom for the near future. I expect stock to continue this up and down until the tariffs work there way through the system and we see the true effect on the economy.
We punched above the 20 day SMA yesterday and will likely test it for support today and tomorrow. If it holds, I wouldn't be surprised to see prices test the 200 day. Hard to know what crazy stuff Trump will do over the weekend, so we will have to see. Good luck and enjoy the ride.
$PLTR Trade: Buy $90.86 , Target $101.35Beep Beep. Hope everyone is taking care of their trading accounts during this volatile phase in the markets. I noticed an identical setup on the weekly from back in August 24' and I'm looking to take advantage. We have a trend reversal on the Tom Demark sequential that helps identify trend exhaustion through a 9 Count. Currently on a 2 Count, we're testing the gap while simultaneously testing the 10WMA at 90.86.There is also a weekly gap at 101.35 ... Entry would be the 10WMA. Target the weekly Gap. Trade is as follows:
Trade Idea - Swing NASDAQ:PLTR $95 Calls 4/25
Entry - 10 WMA @ $90.86
Target - Gap on Weekly at $101.35

SPY/QQQ Plan Your Trade Update For 4-23 : Rally-111 PatternToday's pattern really showed up pre-market.
Where was the rally today? It happened before the US markets opened for business.
The SPY/QQQ had already moved up into my upper resistance area on strong buying overnight.
I knew I had to run my father around most of the day, so I booked my profits this morning and tried to catch one little SPY rally (that didn't work out).
So, I started taking some positions for next week's potential downtrend, and I thought, "How much risk am I taking on these trades if the markets continue to move upward?"
I realized I would be taking about $1000 to $1400 in total risk, but my expiration date is near May 16. So my target for any profit really needs to be before May 10th or so.
If the markets do what I expect, I'll be sitting back, watching my profits grow as the markets trend downward into my May 2 Major Bottom (I hope).
I created this video to highlight the now partially confirmed inverted EPP pattern that setup the Ultimate High in early trading today.
Now that we've completed the inverted EPP pattern, we should be looking for the ES/SPY/QQQ to move downward, shift into a sideways/upward price flag. Then, break down into the new Consolidation phase.
Essentially, if my EPP patterns play out well, I timed my move away from longs/calls and into shorts/puts almost perfectly. Now, I just need to sit back and wait for the markets to make a move.
This is what trading is all about. You can't kick the markets to do what you want them to do. You have to learn to take what the markets give you and fall in line with market trends.
When you do that well, profits start to fall into your lap (if you are patient).
Follow along as I break down these market trends and learn how to develop your own skills.
GET SOME.
#trading #research #investing #tradingalgos #tradingsignals #cycles #fibonacci #elliotwave #modelingsystems #stocks #bitcoin #btcusd #cryptos #spy #gold #nq #investing #trading #spytrading #spymarket #tradingmarket #stockmarket #silver

April 23 Trade Journal & Stock Market Analysis April 23 Trade Journal & Stock Market Analysis
EOD accountability report: +2325 on Eval, didn't trade funded
Sleep: 10 hour, Overall health: :check:
— 9:00 AM Market Structure flipped bullish on VX Algo X3!
— 11:30 AM Market Structure flipped bearish on VX Algo X3!
— 12:30 PM VXAlgo ES X1 Buy signal (triple buy signal) B+ set up
— 1:33 PM VXAlgo YM X1 Sell Signal (triple sell signal) B+ set up
— 1:55 PM Market Structure flipped bullish on VX Algo X3!
— 2:30 PM Market Structure flipped bearish on VX Algo X3!
— 3:31 PM VXAlgo ES X1 Buy signal (double signal)
Next day plan--> Short 48m MOB
Video Recap -->
