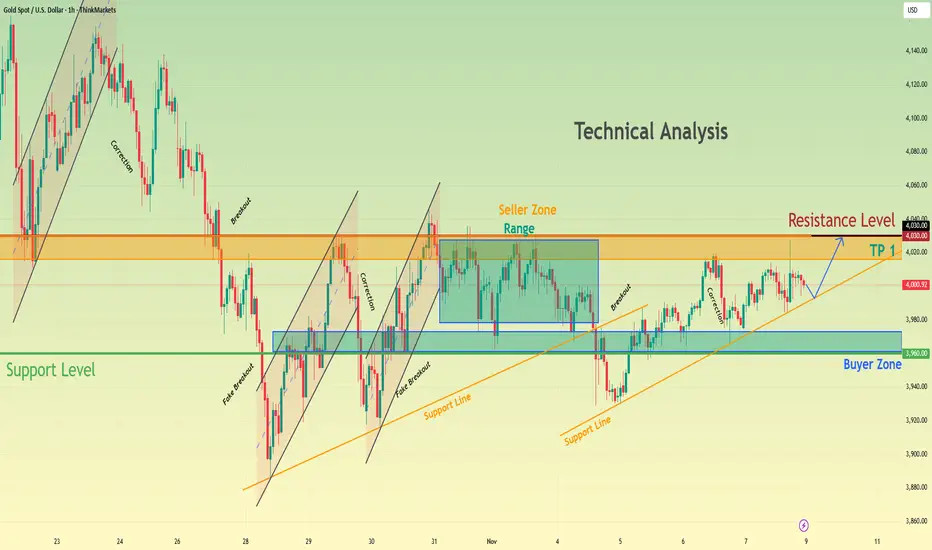
XAUUSD Retests Resistance — Pullback Toward $4,060 SupportHello traders! Let’s take a look at XAUUSD (Gold). After a prolonged bullish movement within a well-defined ascending channel, price reached a significant Resistance Level near $4,200, where sellers stepped in to regain control. This resistance coincides with the upper boundary of a descending resistance line, confirming its importance as a reaction area. Following this rejection, Gold experienced a sharp correction, forming a Range structure near the top before breaking below it — marking a shift in short-term sentiment. The breakout from this range confirmed the beginning of a downward phase, where price continued to move inside a new descending pattern. Currently, XAUUSD is testing the resistance line once again after a breakout retest from below. This area aligns with a former pivot zone where several reversals occurred in the past. The overall structure suggests that buyers are losing momentum, while sellers are preparing to defend this key zone. As long as price remains below the $4,160–$4,200 resistance, a corrective pullback toward the $4,060 Support Level (TP1) looks likely. This area also aligns with the ascending support line, which may act as the next major decision point. A clean break below $4,060 could extend the decline toward the $3,950–$3,970 zone, while a confirmed breakout above $4,200 would invalidate the short scenario and potentially trigger another bullish continuation phase. Please share this idea with your friends and click Boost 🚀
Range

XAUUSD: Bounce from Support Zone Targets $4,280 ResistanceHello everyone, here is my breakdown of the current Gold setup.
Market Analysis
Gold (XAUUSD) continues to maintain a bullish market structure after successfully recovering from the Support Zone near $4,090–$4,100, where buyers stepped in to defend a key demand area. Following a fake breakout to the downside in late October, price regained momentum and established a new Upward Channel, characterized by higher highs and higher lows — a strong sign of renewed buying pressure.
Currently, gold has already completed two major breakout phases, first reclaiming the support range and then extending toward the mid-channel zone. The current consolidation suggests a temporary pause before another impulsive leg upward. Price is now trading between the $4,190 support and the $4,350 resistance area, where previous reactions indicate strong liquidity. This resistance has acted as a cap for prior rallies, making it a crucial target zone for bulls. As long as the metal holds above the channel’s lower boundary, the short-term trend remains bullish. A minor pullback toward the support area could serve as a healthy correction before another rally unfolds. However, a confirmed break below $4,190 could temporarily weaken the bullish momentum and lead to a deeper retracement.
My Scenario & Strategy
I expect XAUUSD to maintain its bullish trajectory while respecting the ascending channel structure. Buyers may look for potential long setups near the $4,190–$4,200 support zone, targeting the $4,320–$4,350 resistance area (TP1). A breakout and close above $4,350 would open the path toward $4,400+ levels, confirming further continuation of the bullish cycle.
Conversely, a strong bearish break below the channel and support zone could signal a short-term correction toward $4,100 before buyers attempt to regain control. For now, sentiment remains optimistic, and gold continues to look poised for another bullish leg higher within its well-defined upward channel.
That's the setup I'm tracking. Thank you for your attention, and always manage your risk.

BTCUSD Long: Rebound From Demand Line Targets $104K ResistanceHello traders! Bitcoin (BTCUSD) continues to trade within a well-defined structure, showing a gradual transition from a bearish phase toward potential accumulation. After an extended decline inside the Descending Channel, the market found strong support around the $100,600–$101,000 Demand Zone, where a fake breakout occurred — signaling liquidity grabs and renewed buyer interest. This zone has acted as a major reaction area multiple times, marking it as a key demand region. Following the rebound from this level, BTCUSD formed a Pivot Point near $101,200, initiating a mild bullish recovery along the Demand Line, which now serves as dynamic support. However, price remains capped below the $104,000 Supply Zone, an area that aligns with both the upper boundary of the current Range and the previous Fibonacci Arc retracement, where sellers previously re-entered the market.
Currently, Bitcoin is consolidating between $101,200 support and $104,000 resistance, reflecting indecision before a potential breakout. If buyers manage to defend the Demand Line and reclaim $103,000, a move toward $104,000 and possibly higher could follow, completing the short-term recovery phase. Conversely, a confirmed breakdown below $101,000 would invalidate the bullish scenario, likely driving price back toward the $100,000–$99,600 zone for another liquidity test.
I expect the current structure suggests Bitcoin is in a neutral-to-bullish phase, with attention focused on how price reacts around the Demand Line and Range boundaries. A strong rebound from current levels could trigger the next leg toward $104,000 resistance. Manage your risk!

NZDJPY - The Wall of Sellers Awaits!⚔️NZDJPY is once again approaching a massive resistance zone highlighted in red, an area that has rejected price multiple times in the past, acting as a strong supply wall.
📉As the pair nears this level , I’ll be looking for potential short setups, expecting a bearish rejection that could drive price back toward the lower support zone around the previous lows.
This range has defined the market for months, and until a clear breakout occurs, playing the range remains the optimal strategy, sell high, buy low.
Will the bears defend this zone one more time? 👀
⚠️ Disclaimer: This is not financial advice. Always do your own research and manage risk properly.
📊All Strategies Are Good; If Managed Properly!
~Richard Nasr

EURUSD Retests Buyer Zone — Bullish Momentum Aiming for 1.1600Hello traders! I’d like to share my view on EURUSD. After an extended bearish trend inside a descending channel, the pair finally found strong buying interest around the 1.15300–1.15400 Buyer Zone, where price reacted multiple times in the past. This area aligns with both the horizontal Support Level and the ascending Support Line, which together form a solid base for potential bullish continuation. Recently, EURUSD broke above the descending resistance line, confirming a possible short-term trend reversal. The price is now retesting the breakout area, showing signs of accumulation above support. As long as price remains above 1.15300, the bullish structure stays valid. The immediate upside target (TP1) is seen around the 1.16000–1.16100 zone, which coincides with the previous consolidation and minor resistance area. A breakout and confirmed close above this zone could open the way toward the 1.16600 Resistance Level. However, a clear bearish rejection pattern near 1.16000–1.16100 might lead to another corrective pullback back into the Buyer Zone before further continuation. Please share this idea with your friends and click Boost 🚀

BTCUSD Long: Breakout From Descending Channel Targets $108KHello traders! Bitcoin is showing a potential continuation of bullish momentum after breaking out of the descending channel, where sellers had previously maintained control over the market structure. During the prolonged downtrend, the price consistently made lower highs and lower lows, until forming a strong Pivot Point near the $100,500–$101,000 Demand Zone — an area that has historically triggered solid bullish reactions.
Currently, after a fake breakout below this demand zone, the price quickly recovered, signaling liquidity sweeps and seller exhaustion. Since then, BTCUSD has rebounded strongly, confirming a structural shift from bearish to bullish control. The pair has now broken above the channel resistance, establishing a short-term bullish bias supported by steady higher lows. At the moment, Bitcoin is approaching the $107,500–$108,000 Supply Zone, which coincides with previous market consolidation and marks a potential reaction area where sellers might temporarily slow down the move. A clean breakout and close above $108,000 would open the door for a further rally toward the $111,000 Supply 2 Zone, reinforcing the medium-term bullish structure.
I expect the $104,500–$105,000 area to act as immediate support and a key retest level, allowing buyers to maintain momentum and target $108,000. Holding above this zone maintains the bullish scenario, while a confirmed break below it could trigger a pullback to the previous demand level before a new rally develops. Manage your risk!

XAUUSD: Buyers Defend $4,040 — Targeting $4,140 ResistanceHello everyone, here is my breakdown of the current Gold setup.
Market Analysis
XAUUSD has recently confirmed a bullish structure after bouncing strongly from the $4,000–$4,040 Support Zone, an area that coincides with the ascending Trend Line visible on the chart.
This level has repeatedly acted as a Buyer Zone, where multiple fake breakouts occurred — signaling liquidity sweeps and failure of sellers to maintain downward momentum. Each test of this support has been followed by a sharp bullish reaction, confirming strong demand and accumulation activity in this zone.
Currently, Gold is showing a controlled recovery phase, moving above the $4,040 Support and gradually approaching the $4,120–$4,160 Resistance Zone, which also aligns with the Trend Line extension and previous consolidation area. This zone represents the next critical reaction level for price. A confirmed breakout above it could open the way toward further continuation, while a rejection may lead to a corrective pullback back toward the $4,040 support. The recent price behavior — including several fake breakouts followed by strong recoveries — suggests that large buyers remain active, defending the bullish structure. As long as price holds above $4,040, the overall sentiment stays constructive and favors a gradual continuation toward the upper resistance levels.
My Scenario & Strategy
As long as XAUUSD remains above the $4,000–$4,040 Support Zone, the bullish bias remains valid.The next upside objective is located around $4,140–$4,160, where sellers may reappear based on past reactions. I expect the market to potentially form a small pullback before resuming its move higher. A sustained breakout and close above $4,160 would confirm a continuation toward $4,200 and possibly higher in the medium term.
However, if Gold breaks below $4,000, this bullish setup becomes invalid, and the price may return toward deeper support levels near $3,960–$3,940 before any new buying interest develops.For now, the structure supports buying pullbacks while the price stays above key support.
That's the setup I'm tracking. Thank you for your attention, and always manage your risk.

XAUUSD Holds Buyer Zone — Potential Recovery Toward $4,030Hello traders, I’d like to share my view on Gold (XAUUSD). The market has been holding a constructive bullish structure, developing higher lows along the rising Support Line. Each time price approached this trendline, buyers reacted strongly, confirming persistent demand. Meanwhile, the $3,960–$3,980 Buyer Zone has acted as a key accumulation area, where several fake breakouts occurred, but price quickly returned back above support — indicating seller failure and liquidity sweeps before bullish continuation. On the upper side, we have a clear Resistance Level and Seller Zone near $4,020–$4,040, where the market previously consolidated inside a range. Multiple rejections were seen in this zone, suggesting that sellers are active here and this remains the next significant reaction area for price. Recently, Gold has been gradually moving upward from the buyer zone, forming a steady corrective climb inside the current structure. At this stage, the trend remains bullish while price stays above the ascending Support Line and Buyer Zone. The immediate objective for buyers is a retest of the $4,020–$4,030 Resistance Level, where price may react again based on previous market behavior. A confirmed breakout above this zone would open the way for further continuation, while rejection could lead to another pullback into the support structure. Please share this idea with your friends and click Boost 🚀
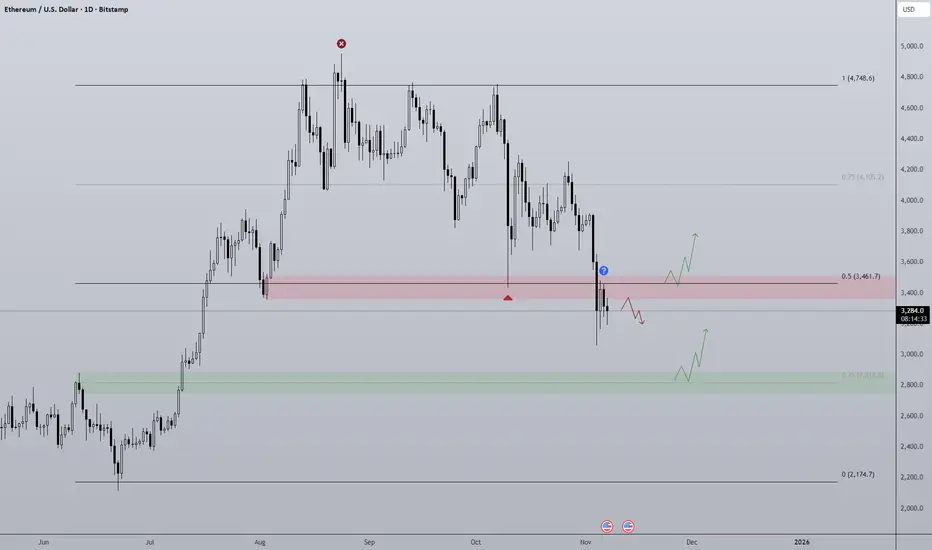
ETH Losing Range Midpoint? Similarly to Bitcoin, Ethereum finds itself around the midpoint of the high time frame range, only ETH has already lost the level and has rejected when retesting. Such a lack of strength is concerning for the project as well as the broader altcoin market.
So there are a few actionable moves I'm looking out for:
Bullish scenario is we maybe chop for a while around/under the midpoint then with high volume the midpoint gets flipped with conviction. That would open the door for the top half of the range to be accessible again. I think this scenario relies on the US Government shutdown coming to an end and QT also ending. Right now there just isn't the liquidity needed to prop up prices hence the slow bleed.
Bearish scenario is a simple continuation of the local bearish trend where 0.25 ($2,800) is the target. This area signaled the break in structure responsible for the previous rally and so I believe it will provide support but is also the target for the bears to reach.
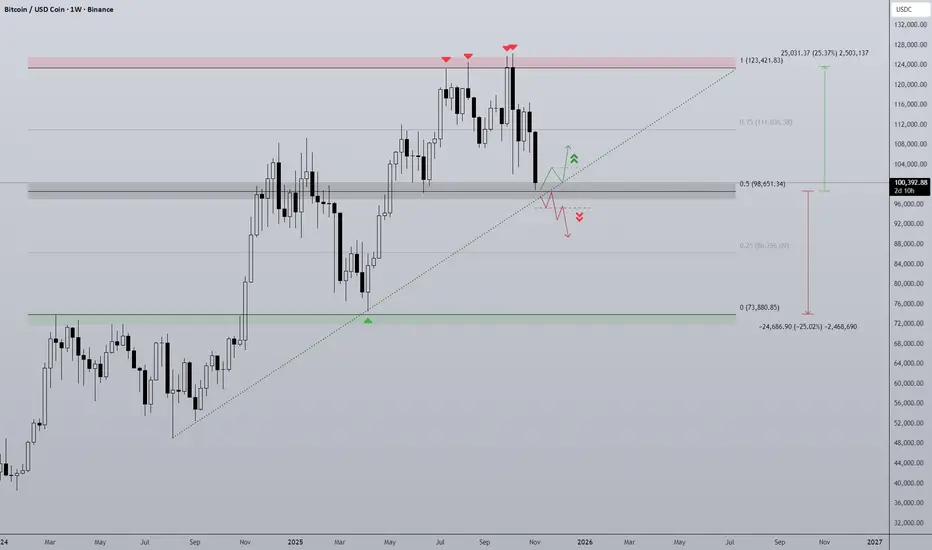
BTC Line In The Sand Bitcoin has had a turbulent Q4 so far and finds itself at ~$100,000 at the start of November.
The chart clearly defines the structure of the move since the beginning of 2024. Once breaking above last cycles ATH of ~$69,000 BTC's price has moved in relatively typical fashion for a bullrun uptrend. The tariff war marking the range low back in April and the highs have been capped at ~$125,000, on 4 separate weeks this area has rejected and remains major resistance.
As of now BTC is retesting the midpoint as support as it did back in June. Where this time is different is the momentum difference, since the first test of range highs the trend has gone into a choppy phase with lower lows being printed. This distribution pattern is vastly different and quite bearish. Another element to this is the diagonal support trendline that intersects the midpoint at roughly current price, losing this trendline would be added confluence that the bullish trend is over.
Should midpoint and diagonal support be lost the bottom half of the range comes into play, a 25% range that would open the door to a full retrace of this cycles progress back to 2021's ATH.
A strong bounce at midpoint keeps the uptrend alive at least in the short term but BTC would need to finally break range high.
EURUSD: Rebound Phase Developing From 1.1510 Support ZoneHello everyone, here is my breakdown of the current Euro setup.
Market Analysis
EURUSD has been forming a complex market structure, transitioning through several distinct phases. Initially, the pair traded within a Range Zone, showing indecision between buyers and sellers. A strong bullish breakout from the range led to the creation of an Upward Channel, where buyers maintained momentum until the price reached the 1.1660 Resistance Zone. This level acted as a significant supply area, resulting in multiple rejection points and eventually a bearish breakout from the channel.
Recently, EURUSD began consolidating in a Descending Triangle Pattern, with the Triangle Resistance Line serving as a dynamic barrier against bullish attempts and the Triangle Support Line acting as a demand zone. Currently, the pair is testing this support zone around 1.1500–1.1480, which has already provided several short-term rebounds. A clear break below this area could confirm a continuation of the bearish structure, potentially pushing price lower toward 1.1450 and even 1.1400. On the other hand, a rebound from the support line with strong bullish momentum could signal the beginning of a reversal move, targeting the resistance levels at 1.1530–1.1540.
My Scenario & Strategy
From my perspective, EURUSD sits at a pivotal technical point. If the Triangle Support Line continues to hold, I expect a bullish breakout attempt above the triangle’s resistance, confirming a possible trend reversal toward higher levels. Short-term traders could look for long entries near the 1.1500 support zone with tight stop-losses below 1.1480, aiming for a retest of 1.1530–1.1540. However, if the pair breaks and closes below 1.1480, it would invalidate the bullish scenario and likely trigger renewed selling pressure toward 1.1450–1.1400. For now, I remain cautiously bullish, expecting a potential rebound from the support base before a decisive move unfolds.
That's the setup I'm tracking. Thank you for your attention, and always manage your risk.

Euro continued Weakness Points to 1.1480 RetestHello traders, I’d like to share my view on EURUSD. The current market structure shows a clear bearish momentum, with the pair consistently forming lower highs and lower lows inside a well-defined descending channel. The rejection from the 1.1660 Resistance Zone — which coincides with a strong Seller Zone — marked the beginning of a sustained downtrend. After a fake breakout attempt above the resistance, the market quickly reversed and continued to decline, confirming that sellers remain in control. The pair is now trading close to the Buyer Zone, which aligns with the Support Level around 1.1500–1.1480. This area has historically acted as a key demand region, making it crucial for the next price reaction. At the moment, EURUSD is respecting both the Resistance Line and the Support Line within the channel, showing the continuation of the bearish cycle. My primary scenario anticipates a potential short-term pullback toward the upper boundary of the channel (around 1.1560–1.1580) before another bearish impulse develops toward TP1 at 1.1480. However, a confirmed breakout above 1.1600 could invalidate this bearish setup and open the way for a broader correction toward the 1.1660 Resistance Level. Until then, the trend remains bearish, and I favor short opportunities targeting 1.1480 as the next key level. Please share this idea with your friends and click Boost 🚀

HOW-TO: Ranger in TradingViewChart patterns and ranges are essential in technical analysis, helping traders identify potential support/resistance zones, volatility expansions, and reversal points. However, manually detecting daily or weekly ranges can be time-consuming and subjective. In this post, we describe how to effectively use the Automatic Range Detection feature inside the ZenAlgo - Ranger indicator, which calculates VWAP-based ranges and standard deviation lines automatically to save time and improve accuracy.
Using the Range Detection Feature
Add the Indicator : Access the ZenAlgo - Ranger and add it to your chart. It works on any timeframe up to 4H for optimal performance.
Key Settings :
Show Today's VWAP Range : Enabled by default. This displays the current day's range based on VWAP ±2.0 standard deviations (core range).
Show Previous Day's Range : Toggle to view historical daily ranges (up to 70 days back).
Show Monday Range : Activates weekly-like ranges derived from Monday's data (shiftable forward for projection).
Standard Deviation Lines : Customize visibility for ±3.0 to ±10.0 (and halves like ±0.5, ±1.5). Highlighted lines (e.g., ±5.0, ±10.0) use solid styles for emphasis.
Monday Range StdDev Lines : Extended up to ±40.0 for advanced volatility analysis.
Box Transparency : Adjust for visual clarity (0-100%).
Tip : Start with defaults – today's range in teal, previous in gray, Monday in yellow/blue – and tweak based on your asset's volatility.
The indicator uses a locked 1-min VWAP calculation for precision, incorporating buy/sell volume delta from 4H data to color ranges dynamically.
Range Detection Overview
ZenAlgo - Ranger detects and plots:
Daily Ranges : VWAP-centered core (±2.0 std) with extensions via std dev lines. Supports up to 50 previous days.
Monday (Weekly Projection) Ranges : Special ranges from Tuesday's data (representing Monday's VWAP), extendable up to 30 weeks. Includes core levels (25%, 50%, 75%) and extreme std devs (±40.0).
Half StdDev Lines : For finer granularity (e.g., ±2.5, ±3.5).
Volume Delta : Integrated buy/sell volume calculation for each range, helping identify bullish/bearish bias.
Return Labels : Automatically labels entries back into the range (e.g., "dS" for daily short return above RH).
Detection relies on VWAP and std dev thresholds – higher std lines indicate potential overextensions.
Examples
Here are some practical examples on BTCUSD (see chart snapshots below):
Daily Range in Action : The red box shows today's VWAP range (±2.0 std). Notice how price bounces off the midrange (MID) acting as resistance.
Previous Ranges for Context : Gray boxes overlay past days. In a trending market, price often respects these as dynamic S/R – e.g., breaking below a previous RL signals strength.
Monday Range Projection : Yellow core with blue borders. Shift forward to project weekly volatility. The 50% midline often acts as equilibrium.
StdDev Extensions : ±5.0 (solid) and ±10.0 lines for extreme targets. Useful in high-vol assets like crypto.
Tips
Validate ranges with volume delta for bias confirmation.
Use on intraday charts; combine with other indicators for entries.
For volatile markets, enable higher STDs on Monday ranges.
Gold Nears Resistance — Buyers Target $4,130 BreakoutHello traders, here’s my current outlook on Gold (XAUUSD). The market structure shows that Gold has recently shifted from a sharp bearish phase into a short-term recovery pattern, finding solid demand near the $3,940–$3,950 Buyer Zone. After the last strong drop from the $4,130 Resistance Level, price stabilized within this accumulation area and began forming an ascending structure supported by a clear Support Line. Currently, Gold is trading inside a rising wedge pattern — a signal of a tightening market where buyers are gradually gaining ground. The Resistance Line near $4,050 represents a short-term barrier, and a confirmed breakout above this level could open the way for a move toward the $4,130 Resistance Zone (TP1), which aligns with the previous Seller Zone. From my perspective, as long as the price remains above the $3,940–$3,950 Support Zone, the bullish bias remains valid. A successful breakout above $4,050 would likely confirm the continuation of the current upward momentum, targeting $4,130. However, if the price fails to break above resistance and falls below the ascending support line, a short-term pullback toward the Buyer Zone could occur before any new bullish wave develops. In my opinion, the market structure currently favors buyers, with strong support underpinning the move. Therefore, I’m expecting a potential bullish continuation toward $4,130 as the next key target.

XAUUSD Long: Demand Zone Holding, Eyes on $4,080Hello traders! Gold (XAUUSD) is currently showing a corrective phase within its broader bullish trend. After a strong rally from the $3,850 Demand Zone, price climbed steadily along the ascending Trend Line, forming higher highs and higher lows until reaching the $4,150–$4,180 Resistance Area. This zone acted as a key pivot point, where buyers lost momentum and sellers initiated a retracement.
Following this, the market broke below the Trend Line, signaling the start of a short-term correction. The correction found temporary support near the $3,950 Demand Zone, where buyers have recently stepped in again. This level coincides with a previous pivot and a key structural support area, suggesting a potential rebound setup. At the moment, price is consolidating between the $3,950 Demand Zone and the $4,080–$4,150 Resistance Area, indicating indecision before the next move.
From my perspective, Gold is likely to attempt a bullish correction toward the $4,080–$4,150 Resistance Zone, which aligns with both the previous Trend Line and recent pivot structure. A successful break and close above $4,150 would confirm a trend continuation toward higher levels. However, if the price fails to break above this resistance area and gets rejected, sellers could regain control, pushing the market back down toward $3,950 or even lower. For now, I’ll be watching for confirmation of a bullish reaction from the $3,950 Demand Zone to validate a short-term long setup targeting $4,080. Manage your risk!

EURUSD: Bounce from Support Could Trigger Move Toward 1.1640Hello everyone, here is my breakdown of the current Euro setup.
Market Analysis
EURUSD has been trading in a corrective phase after breaking down from the Upward Channel that previously guided its bullish movement. The pair formed a Range near the 1.1760 Resistance Area, showing consolidation before sellers regained control. Multiple Breakouts confirmed shifts in market structure — first to the upside within the channel, and later to the downside, signaling the transition from bullish to neutral-bearish momentum.
Recently, price found strong demand within the 1.1550–1.1560 Support Zone, which aligns with the Triangle Support Line. This level has been tested multiple times, acting as a significant pivot point for potential bullish reactions. The Triangle Resistance Line above continues to limit upward movement, forming a contracting structure that reflects growing pressure from both sides.
My Scenario & Strategy
From my view, EURUSD is currently setting up for a possible bullish rebound from the support zone near 1.1560. If buyers defend this level, the price could rise toward the Triangle Resistance Line around 1.1630–1.1640. A confirmed breakout above this resistance could open the way toward the key 1.1760 Resistance Zone, signaling a shift in sentiment back to bullish.
However, if the pair fails to hold above the Triangle Support Line, a breakdown could trigger a deeper decline toward 1.1500. For now, I maintain a short-term bullish bias, looking for long opportunities near support with clear confirmation signals.
That's the setup I'm tracking. Thank you for your attention, and always manage your risk.

Gold Rebound: Bulls Target 4,130 ResistanceHello, traders, I want share with you my opinion about Gold. Gold has been trading within a broad technical structure, evolving from a strong bullish phase into a corrective descending channel. The previous uptrend was clearly defined by an ascending channel, which guided the price through multiple impulsive rallies and pullbacks. However, after forming a double-top pattern near the 4320 resistance level, buyers began to lose momentum, resulting in a sharp decline. Currently, the price is trading within a well-defined descending channel, where sellers have been maintaining short-term control. After a deep test of the Buyer Zone around 3920, the market has shown early signs of a potential rebound. The asset is now pulling back from this support area and is approaching the resistance line of the descending channel. In my opinion, this upward correction represents a short-term recovery within a larger bearish context. I expect that the price will rally towards the Resistance Level near 4130–4140, where strong selling pressure may reappear. This area is also aligned with the upper boundary of the descending channel, creating a strong confluence zone. A rejection from this resistance line would confirm the continuation of the bearish structure. The next potential move could be a rotation back down towards the Buyer Zone, or even a deeper retest of the Support Line around 3920. My take-profit (TP1) for the corrective rally is placed at 4108, targeting the upper range of the structure before the next potential reversal. Please share this idea with your friends and click Boost 🚀

Bitcoin Approaches Key Resistance — Bulls Eye 117K BreakoutHello traders, I want to share my view on Bitcoin (BTCUSD). The current market structure shows a gradual recovery phase following the previous breakdown from a large range near the 118,000 level. After a sharp decline and retest of the 106,400 support zone, the market found strong buying interest, forming a new ascending channel structure. This setup has been characterized by steady higher highs and higher lows, confirming the presence of short-term bullish momentum. At this stage, BTCUSD is approaching a key resistance level around 116,000, which aligns with both the upper boundary of the current channel and the prior horizontal resistance zone — a region that previously acted as a strong supply area. This confluence suggests that the market could face a short-term pause or pullback before attempting another bullish impulse. My primary scenario anticipates that if the price holds above the support line near 113,000–113,500, buyers may maintain control and push toward the 117,000 target (TP1) — the next logical resistance level and the top of the channel. However, a clear rejection from 116,000 without follow-through could open the door to a corrective pullback toward 110,500–111,000 for another demand test. In my opinion, the structure remains bullish in the short term, as long as the lower boundary of the ascending channel holds. Therefore, I continue to favor a long scenario with a TP at 117,000, expecting a potential breakout or test of the upper resistance. Please share this idea with your friends and click Boost 🚀

BTCUSD Short: Sellers Aiming for a Pullback Toward 109,600Hello, traders! Bitcoin (BTCUSD) continues to trade within a broader corrective structure after losing momentum from its previous bullish phase inside the Ascending Channel. The breakdown from the channel shifted the short-term sentiment from bullish to neutral-bearish, with sellers now defending the upper boundary of the current Supply Zone. After the strong rejection from the 118K–116K region, BTC entered a range-bound phase between 109,600 (Demand Zone) and 116K (Supply Line). This range represents a period of accumulation or distribution — depending on how the price reacts at its edges.
Recently, the price retested the upper boundary of the Supply Zone, where a fake breakout occurred, followed by selling pressure — a clear sign that supply remains dominant. Now, the market is showing early signs of potential correction back toward the Demand Line near 109,600, where buyers previously stepped in to defend the trend.
If the bearish momentum continues, I expect a move down toward the Demand Zone around 109,600–107,700. This area aligns with both a key pivot point and the ascending demand line, which could act as a springboard for another bullish rebound. Conversely, a confirmed breakout above 116K would invalidate the short-term bearish outlook and signal a possible continuation toward higher resistance levels. For now, my bias remains bearish-to-neutral, anticipating a short-term correction before a potential bullish reaction from the demand area. Manage your risk!

EURUSD: Buyers Gaining Momentum Near Key Support ZoneHello everyone, here is my breakdown of the current Euro setup.
Market Analysis
EURUSD has been moving within a clear downward channel, forming consistent lower highs and lower lows over the past few weeks. Each attempt to break above the resistance line has resulted in a fake breakout, confirming that sellers have maintained control through most of this structure.
Recently, the pair found strong buyer support near 1.1550, a key support zone that has held multiple times in the past. After testing this level, the price bounced upward, breaking the channel’s upper boundary and forming a triangle structure — signaling that market momentum is shifting from bearish to corrective. Currently, EURUSD is testing the Triangle Resistance Line around 1.1670–1.1700, an important resistance area where previous rallies have stalled. The overall structure suggests that the market might face renewed selling pressure from this zone.
My Scenario & Strategy
From my perspective, EURUSD could see a short-term pullback from the resistance area before any potential breakout confirmation. A rejection here would likely push price back toward the Triangle Support Line or even the 1.1580–1.1550 support zone, where buyers could reenter.If, however, the pair manages to break and hold above 1.1700, it would indicate growing bullish momentum, possibly targeting 1.1750 — the top of the previous resistance area.
Until such confirmation appears, I expect a corrective move downward within the triangle formation as part of a broader consolidation phase.
That's the setup I'm tracking. Thank you for your attention, and always manage your risk.

BTC/USDT — New Volume Entry Zone Forming - 117KBTC/USDT — New Volume Entry Zone Forming 💥
Bitcoin is stabilizing above the pre-cycle range and building new volume around the $115K zone.
This could mark the next accumulation area before continuation if support holds here.
📊 Key Range: $115K–$116K
📈 Focus: Maintaining this new volume base for further upside to 117K

BTCUSD Short: Rally will Continue in ChannelHello, traders! The prior market structure for BTCUSD saw a major reversal after a strong rally failed to sustain its momentum, peaking near 126000. This established a new bearish phase, with the price action since being clearly contained within a well-defined descending channel, confirming that sellers currently have the initiative.
Currently, the price is in a corrective phase within this channel. After bouncing from the lows, the auction has rallied back up and is now directly testing the descending supply line. This is a critical inflection point where the dominant downtrend could resume with force.
My scenario for the development of events is that this corrective rally will fail upon testing the channel's resistance. I expect a rejection from this supply line to confirm that sellers are still in control. In my opinion, this will trigger the next impulsive move down, which should be strong enough to break the key 108700 demand level. The take-profit is therefore set at 104250, targeting a new lower low. Manage your risk!

GOLD Analysis: Watching for Reaction Near Buyer ZoneHello traders, I want to share with you my opinion about Gold. The market for Gold has been in a strong bullish trend for quite some time, forming a clear upward channel structure. Each impulse has been followed by a short consolidation phase (range), allowing the market to gather liquidity for the next push higher. However, after reaching the key Resistance Level near 4368, the price entered a Seller Zone where heavy supply emerged, triggering a sharp correction. This move broke the short-term market structure and pushed the price down towards the Buyer Zone — an important support area that previously acted as a base for a strong rally. Currently, Gold is trading near the bottom of a descending correction channel, approaching a crucial decision point. I expect the market to make a small corrective move to retest the Resistance Line of this channel, and if rejection follows, it could open the way for another bearish leg toward my TP around 4020. From a broader perspective, this decline still looks like a healthy correction within a major uptrend, so I’ll be watching closely how the price reacts inside the Buyer Zone — it might offer great opportunities for the next bullish impulse later on. Thank you for reading! Please share this idea with your friends and click Boost 🚀
