USD-JPY Local Short! Sell!
Hello,Traders!
USD-JPY is trading in a range
Between the horizontal resistance
And the horizontal support
And now the pair is set to retest the resistance
From where a move down is likely
Sell!
Like, comment and subscribe to boost your trading!
See other ideas below too!
Range

Buy the support - Range Strategy (+ 3000 points)Hey everyone,
I'm very happy to share with you my first chart posted on TradingView. This is a bullish setup on USOIL based on several elements that i've found through technical analysis. Usually the winning rate of this type of trade is around 70%, so if having a correct management of risk its a very profitable idea.
Buy Setup USOIL :
- price ranging between 90 and 120
bounce on important support
- Ema bounce
- bullish engulfing
aiming for 124 lvl

How To Trade Probability Ranges The Critical Rule of 1/3Using the Rule of Thirds to Master Probabilities in trading and investing ranges
--------------------------------------------------------------------------------
Stocks typically remaining in consolidation ranges 70% of the time while trending the remainder.
Using the rule of thirds, we can use statistics, prior price action and the probabilities of success to determine when to enter trades where the odds are stacked in our favor.
1) We start by finding a stock that is in a consolidation range, and identify the nearest important support and important resistance levels based on your targeted trading timeframe.
2 ) We take the range between the support and resistance levels and divide it into thirds, so we have three zones within the consolidation range.
3) When going long, you want to BUY the stock when it is within the bottom third or the zone from support to the 1st third level. Once you buy, your objectives are to hold during the middle third of the range, and sell during the top third.
When you buy in the first third, this gives you a 66 percent chance of success. If you buy in the second third of the range, you only have a 50/50 chance of success. Going long in the top third of the range, gives you only a 33% chance of success because you are already close to the resistance level.
When going short, the sequence and odds are reversed. You sell during the top third of the range, hold during the middle third and exit in the bottom third. This again gives you a 66% chance of success when you enter in the top third, 50/50 chance if you enter in the middle third, and a 33% chance of success if you enter in the bottom third as you are already close to the support zone.
****Using this simple trick, you can quickly evaluate trades based on probabilities and selectively enter trades where the odds of success are the highest and avoid likely losing trades. The rule of thirds also also gives you the confidence to continue to hold trades based on previous important ranges, and provides clear levels where the stock is likely to either reverse or start trending.
Hope It Helps to your Trading & Investing Success
Marc

Bitcoin in 1 Minute - Day 21Hello TradingView Family / Fellow Traders. This is Richard, as known as theSignalyst.
Quick Brief:
BTC is still stuck inside the red range and we are expecting a couple of days more inside it until we eventually break the range upward or downward.
Meanwhile, we will be trading the range, and we can clearly see that the range is getting contracted forming a symmetrical triangle which usually happens before an aggressive breakout happens.
But of course, a breakout of the symmetrical triangle would be an early alert and might result in a fakeout, the real breakout would be above or below the red horizontal range.
21 out of 500 days done.
I truly appreciate your continuous support everyone!
Let me know if you like the series, and if you would like me to change or add anything.
Always follow your trading plan regarding entry, risk management, and trade management.
Good Luck!.
All Strategies Are Good; If Managed Properly!
~Rich

NZDJPY Short Term Buy IdeaH4 - Currently it looks like the price is moving inside a range.
Price respected a key support zone and is bouncing higher.
Bullish divergence.
H1 - Bullish convergence.
Currently it looks like a pullback is happening.
Until the key support zone holds I expect the price to move higher further in the short term after pullbacks.


USDCAD might do wonders!!!no comment. At this time of the day, i do not expect such movement in price, but technically speaking this might be another sell setup, following the london open sell that occured in the morning.


EURUSDI set this up as a short on confirmation, reacting off of resistance. However it may also be setting up a range between 1.04633 and 1.03863. I think it could range there until midweek and by then a re-analysis would be necessary.
Scalpers will almost certainly have opportunities long to 1.04633.

JICPT| BTC is probably heading to $15500 for another range move!Hello everyone. There is a lot of news circulating in the crypto market, from the sudden crash of Terra luna to the 3AC liquidation. It seems buyers are reluctant to get in after 70%+ drop of BTC based on the volume market in the chart.
Where could it go?
It could be on the way to test $15500 by measured move. In the short term, I don't see any rebound happen soon as there is no huge volume and reversal candle patterns formed.
What do you think? Give me a like if you're with me.

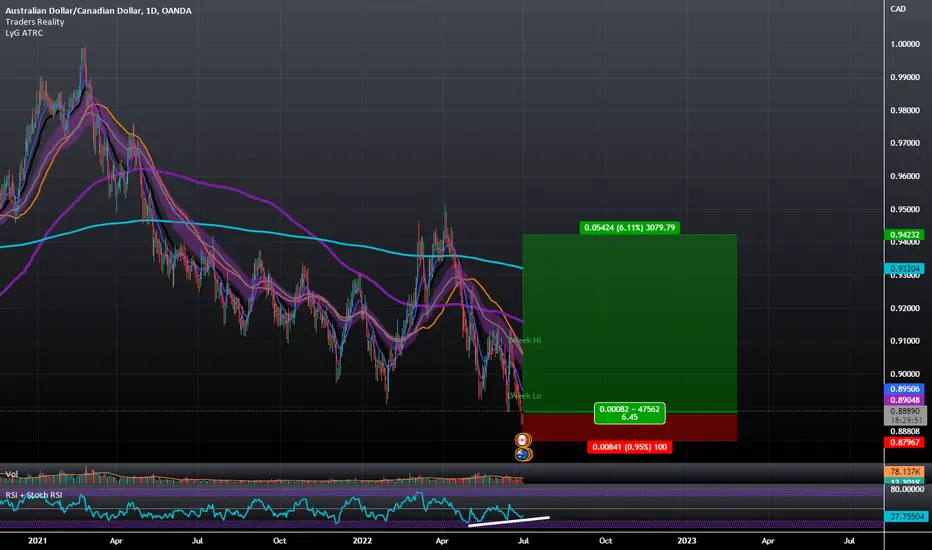
AUDCAD Daily Bullish Divergence within RangeDaily Triple Bullish Divergence on the RSI seems to be hinting towards a future scenario where the AUD will see a Bullish Rally against the CAD to the top portion of the range it's formed down here.
BTC what's gonna be?At this time I expect 2 scenarios:
Form a Cup and Handle Pattern and break the neckline.
Continue to Range and breaks the top of the TR.
That aside we have a gap of CME ~ 28000$ that soon or later will be filled.
Cm your opinion.

DAX Will Keep Falling! Sell!
Hello,Traders!
DAX is trading in a downtrend
And the index has been stuck in a range
For quite some time, but we are bearish biased
Thus, after the bearish breakout we will be expecting
The index to go further down
Sell!
Like, comment and subscribe to boost your trading!
See other ideas below too!

How to find THE BEST SHORT entry in a Range bounding market !!!!Welcome to this tutorial
This is my personal take from multiple resources and +20 hours of research and my own experience with trading in a range-bound market.
Range-bound trading or in this case shorting in a range-bound market contains 5 simple phases:
phase A
Range High + Range low forms which lead us to have a Range market.
phase B
Price tends to deviate above the Range High or simply sweep (upthrust) above it.
Reasoning and psychology behind that= in order to catch the liquidity above the range high and trap breakout traders who just opened a long above the high before nuking to the Range Low.
phase C
BOS happens in ltf , triggering a trend reversal.
Supply forms below the resistance, that's where we would like to build our short position later on.
phase D
ltf Range forms after the first sell-off, creating our base to revisit the supply that previously formed above it.
(Ideally, you can enter a scalp long trade in this phase and close right at the supply)
phase E
Price finally revisit the supply in order to test it as resistance. Any bearish price action at the supply or ltf BOS triggers our entry, targetting the Range Low as our take profit point.
There you can have a nice +4 R/R short setup, remember to place your invalidation above the newly made local high just to be safe from stop hunters ;)
Make sure to leave a like and a comment if you find this small article useful
I will share 2 more topics about range bound market and how to trade it in near future so follow me on Tradingview so you don't miss them xoxo

EURGBP: Strong Supply After various liquidity sweeps within this range, we may finally be ready to see some selling pressure.
I will be observing price action within this supply to locate a potential sell.
If price fails to reject this zone then we have to let price travel up to the main supply at the high before we search for sells again.

GBP-USD Local Long! Buy!
Hello,Traders!
GBP-USD is trading in a kind of a range
And the pair has retested a local horizontal support
And we are now seeing a bullish rebound
So I think that the upward correction will continue
And the pair will likely hit the target above
Buy!
Like, comment and subscribe to boost your trading!
See other ideas below too!


BTC: Surviving the Chop! / Visual MapMorning/Evening all!
BTC has entered a very choppy range, which means the price moves in a tight range bouncing between many levels chopping positions of all market participants, shorts and longs alike.
In this picture I have marked and mapped the choppy areas as well as the zones that should be considered Resistance and Support.
There are two ways to use this chart depending on what you are looking for:
A) SWING TRADING THE TREND
If you have entries in the green (support) zone and you want to catch bigger moves then hold your positions until price goes into the red (resistance zone). If this happens pay attention to momentum. If the momentum is strong you might want to keep your positions and let the price pump higher (which means you will be looking at taking profit around 25-28k area).
Ignore the chop zone completely. It's there to make you let go of your positions, lose money or both.
B) SCALPING
If you are interested in scalping every move then the orange (chop) zone is your bread and butter. You try to get entries at the lowest parts of this range and take profit at the highest parts of this range.
Taking smaller scalps for example from the mid of that range (~20.8) to the top of the range still works but your R/R is much different. Proceed with caution. Have very tight stop losses. Look for any signs that might show you that we're about to break out of the chop zone and protect yourself if you are in an opposite trade.
Last but not least:
-- All lines should be considered approximates. This means you have to check for previous candle bodies near these lines to find the exact "mini-range" that each line belongs to.
-- Blue/Red boxes (frames) are put/ask areas. They are areas where price previously found either mostly sellers or mostly buyers, therefore, the volume profile has a gap too (possible support/resistance areas)
It's highly likely that we will enter an "Inside Week" structure which means I wouldn't be surprised if these ranges play out for a couple of more weeks.
So, what's an "Inside Week" anyway? I will make another post about it and explain in detail. Stay tuned!!

NZDJPY: Zoom Out 🔍Everyone is focusing on the lower time frames without noticing the higher monthly supply holding right above current price.
Be careful selling before this zone! We are seeing lots of indecision suggesting price may well want to travel up into the supply before any signs of reversals.
Bear this in mind when trading this pair.
Please let me know what you think in the comments 💬
