Selling AUDCAD against a strong resistanceAUDCAD is down on a daily chart.
It has strong resistance at 0.8740 to 0.8770.
There is H1 divergence.
Found a small pattern to sell on M5.
Stop above the resistance. Target is to 0.8625
Resistance_level

NAS100NAS100 is trading in descending channel and printing consistent LLs LHs. Recently the price is broken the important support zone and now retesting the broken level, which is also the 0.38% Fib retracement level.
If the sell momentum continues the next target could be 14400 followed by 14000 region.
What you guys think of this idea

USDCHFIs USDCHF exhausting at highs?
As the price is been on high bull run but now it seems like price is lacking bullish momentum after printing double top pattern at resistance level and bearish divergence suggesting the sell pressure is about to start.
If the bears took control , the 1st target could be 0.9160 followed by 0.9094.
What you guys think of it

shell levels fibonacciShell... big resistance level.
we are at a major resistance level. Are we going to break this?

#USDCAD another selling opportunityIf you remember we already took one successful short trade from the previous red arrow and although we were expecting price to move further down and create new low for higher timeframe this didn't happen.
As a result price went up and giving us another selling opportunity.
As you can see in the picture price is at important static resistance area and just below 4H and 1H EMA which both acting as resistance.
But the thing that we should be consider before taking position from the area that price currently is sitting on is the possibility that if price wants to come and take liquidity from the local top that formed earlier and since there is a lot of stop losses could be a good target for price to reach and take out liquidity.
So if you want to take position from this area keep in mind the possibility of price moving higher to take out loquidity.

CADCHFCADCHF is been on enormous bullish trend and reached at Daily resistance area. This is the area which sellers might be looking for to relief a bit.
Will the sellers attack this confluence?

AUDCHFIs AUDCHF exhausting at highs?
As the price is been on high bull run but now it seems like price is lacking bullish momentum after printing double top pattern at resistance level and bearish divergence suggesting the sell pressure is about to start.
If the bears took control , the 1st target could be 0.5760 followed by 0.5700.
What you guys think of it

#EURAUD bearish continuation very well and clean bearish market structure in 4H time frame, price forming lower lows and lower highs and right now price seems like to forming another LH.
Price currently testing short term bullish corrective upper channel line which act as a resistance for the price. moreover, price is at static resistance area which add to our bearish confluences.
Should be noted that price is below 4H EMA and 4H bearish trendline as you can see in the picture. Also in 1H time frame price formed bearish hammer candlestick formation.

CHFJPYCHFJPY is trading in descending channel and printing consistent LLs LHs. currently the price is facing resistance from channel trendline which is also a strong resistance zone.
If the sell momentum continues the next target could be 164 region.
What you guys think of this idea.

USDJPYIs USDJPY exhausting at highs?
As the price is been on high bull run but now it seems like price is lacking bullish momentum after printing double top pattern(ON LOWER TIME FRAME) at resistance level, suggesting the sell pressure is about to start.
If the bears took control , the 1st target could be 147.
What you guys think of it ?

AUDCHFIs AUDCHF exhausting at highs?
As the price is been on high bull run but now it seems like price is lacking bullish momentum after printing double top pattern at resistance level, suggesting the sell pressure is about to start.
If the bears took control , the 1st target could be 0.5738.
What you guys think of it ?

BITCOIN brief correction to the downside❌🧨Hello 🐋
based on the chart, the price is close to the resistance area and channel resistance ✔️📚
so first
range candlesticks to the upside and downside before any other sharp movement is logical 📖
and
more correction to the downside, at least close to 24k is our main target ❌🧨
👌 Notice: pay attention to the price on shortcut chart (located above the main chart with black colour) 📖💡
Please, feel free to share your point of view, write it in the comments below, thanks 🐋

USDCHFIs USDCHF exhausting at highs?
As the price is been on high bull run but now it seems like price is lacking bullish momentum after printing double top pattern at resistance level and bearish divergence suggesting the sell pressure is about to start.
If the bears took control , the 1st target could be 0.88600.
What you guys think of it

TRBUSDTTRBUSDT is trading in symmetrical triangle pattern. The price is reacting well the support and resistance of triangle.
Currently the price is at the resistance of triangle where the sellers are showing good strength and seems like the price may break through the triangle.
If the breakout sustain to downside ,the optimum target could be 22.80 followed by 21.
What you guys think of this idea?

USOILIs USOIL exhausting at highs?
As the price is been on high bull run but now it seems like price is lacking bullish momentum after printing double top pattern at resistance level and bearish divergence suggesting the sell pressure is about to start.
If the bears took control , the 1st target could be $86 followed by $85
What you guys think of it ?

USDJPYIs USDJPY exhausting at highs?
As the price is been on high bull run but now it seems like price is lacking bullish momentum at resistance level and bearish divergence suggesting the sell pressure is about to start.
If the bears took control , the 1st target could be 146
What you guys think of it ?

DWARKESH: RESISTANCE ZONESNSE:DWARKESH is near its Resistance zones. Position can be taken only after breakout and closing of candle above resistance. Stop Loss should be followed.

XAGUSDIs XAGUSD exhausting at highs?
As the price is been on high bull run but now it seems like price is lacking bullish momentum at resistance level and bearish divergence suggesting the sell pressure is about to start.
If the bears took control , the 1st target could be 24 followed by 23.
What you guys think of it ?

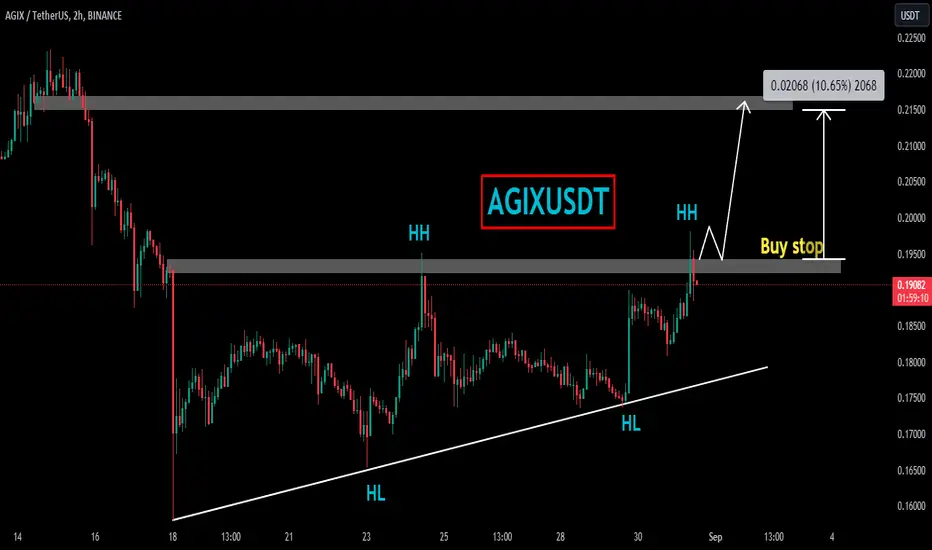
AGIXUSDTAGIXUSDT is in the making of new bullish trend.
As the market is started to print new HHs and HLs after the recent massive selloff.
currently the market is retracing a bit after last HH, if the market successfully close above 0.1945 level you can trade it with buy stop.
CRV 2H Will go uptrend?CRV offers the most beautiful and simple charts, including:
Uptrend line,
Double bottom pattern,
Clear resistance and support zones.
This opens up new possibilities for buying from support or when there's a breakout.

AUDCHFAUDCHF is trading in ascending channel but it seems like the buying stream is being limited. As the pair has started to form bearish candles from resistance zone. Currently the pair is hovering at local resistance zone but looks like sellers will take charge and continue to downside.
Don't forget to share your reviews as well.

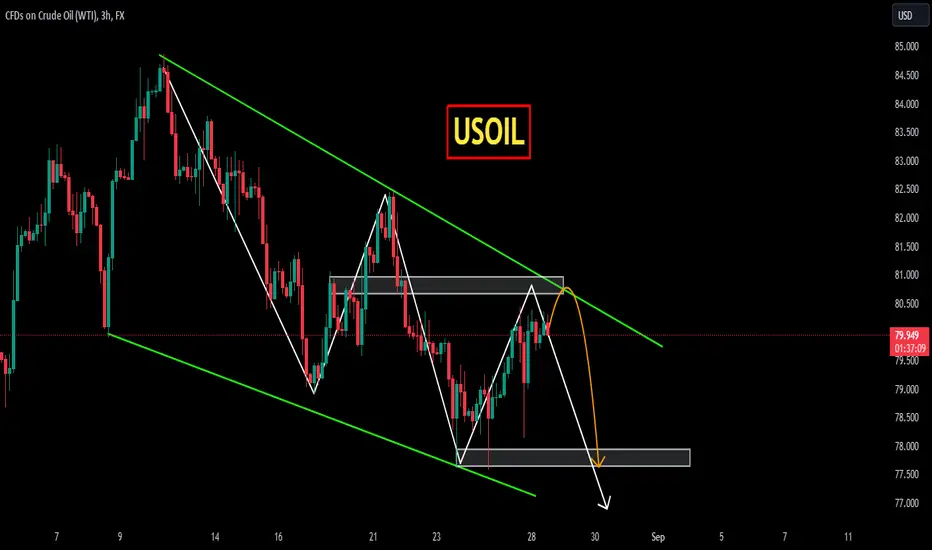
USOILUSOIL is trading in descending channel and printing consistent LLs LHs. Currently the price is trading at important resistance zone. As the red candles at resistance zone indicating the sell pressure.
If the sell momentum continues the red next target could be 77.50 region.
EURUSD still downtrendI don't see bullish acton on bottom therefore for me still down.
Good place for looking entry is top line op channel
