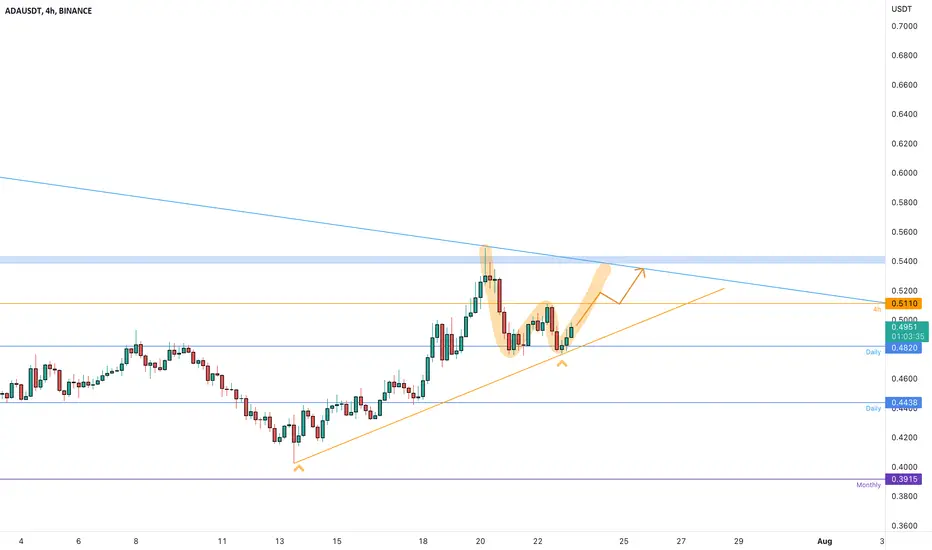
ADAUSDT is testing the resistanceThe price is testing the dynamic 4h support above the daily resistance at 0.48%.
The market is going to try to complete the W pattern below the daily resistance at 0.54$ where the price needs to grab more liquidity to create a new breakout from the historical resistance
how to approach it?
IF the price is going to have a breakout from the neckline and retest it as new support, According to Plancton's strategy , we can set a nice order
–––––
Keep in mind.
🟣 Purple structure -> Monthly structure.
🔴 Red structure -> Weekly structure.
🔵 Blue structure -> Daily structure.
🟡 Yellow structure -> 4h structure.
–––––
Follow the Shrimp 🦐
Resistance_level
GBPUSD-Weekly Market Analysis-Jul22,Wk5As a structure-based trader, I will wait for the market retest at 1.2040 with an RSI Divergence and the candlestick pattern to touch 1.2050, but a close below 1.2040 would be a perfect opportunity for me to engage the trade.
If the market breaks and closes above 1.2050, I will patiently wait for Bearish Shark set up to engage the trade.(link of that analysis is in the related ideas under tradingview)

ETH Resistance & Support (2 weeks+)As ETH starts to look like the market indicator (up over 30% against BTC since the bottom), this is a brief outlook on future resistance and support. Above the lower lines of support, the bottom of the daily EMA ribbon (1340) could be another strong area of support On the other side, horizontal resistance can be seen on the 4hr Beyond that the weekly EMA ribbon will cover a wide range of resistance between 1900 and 2400 The 20 and 50 week MA fall in that same range Also worth noting the bearish cross of the 20 & 50 week MA, and bearish flip of weekly EMA

long GU pullback strategy we saw GU break out of the trend to the downside and create new highs so we looked for price to pull back down to our key area of support and looked then for a break of structure to the upside with stops below our other support zone
risk 1%

Bidvest at an area of valueJSE:BVT is at an area of value, the last time it reached a resistance area it managed to break above it. Hoping for a breakout.

MCDOWELLMcdowel is trading in multiple times resistance zone of 830-835 if it breaks above 835 zone then its a buy.
With mentioned stoploss & targets.

BTC Go Ahead 26000 Resistancehello my friends.
i think we broke a pattern last day and now we can retest it
(and also 200 day MA).
our Money Flow Index approch to overbought area and
according to our trend (Bearish) we can go down after touch
this strong support level.
be careful friends we are in a contraction condition yet.
inflation grows and today we saw the news about TESLA
that sold about 75% of its BTCs.
this news can affect markets for short term
but in longterm no problem! :)))
take care of yourself and your money.
manage your risks.
the first step is protect our capital and the next step is profits.
hope you all have good trades.
thank you all for reading my opinion.
please share me your opinion in comments.
!!!NOTE!!!
MY POSTS ARE NOT TRADING AND INVESTING ADVISE
SO TRADE ON YOUR OWN STRATEGY AND CONSIDER MARKET RISKS.

WILL BTC BACK TO $ 30K?Hello everyone, let's take a look at the BTC to USDT chart on a 1 day timeframe. As you can see, the price is moving above the local downtrend line.
Let's start with the designation of the support line and as you can see the first support in the near future is $ 22,792, if the support breaks down, the next support is $ 21,780 and $ 20,991.
Now let's move from the resistance line as you can see the first resistance is $ 24748, if you can break it the next resistance will be $ 26343 and $ 28848.
Looking at the CHOP indicator, we can see that in the 1-day interval some energy was used and the MACD indicator confirms the upward trend.

USDJPY Trading IdeaUSDJPY looks to sell off strongly leading to new recent lower lows.
The idea is to wait for a red confirmation candle and sell that with a stop
of about 20-25 pips and risk size of 1% max loss.

AUDUSD REVERSAL TRADEPair: AUDUSD
Timeframe: 4H
Analysis: Round number level, Strong resistance, Trend break, volume profile, Currency strength index
Key Takeaway: Break of resistance and bullish momentum
—————
Level needed: Need to see price hit 0.68615
—————
Trade: Long
RISK:REWARD : 1:6

firs scenario or second scenario?🔥🔥🔥hi there guys I hope you all have a great day👋.
in this idea 💡 I'm showing you 2 scenarios one for bulls and one for bears.
and the reason for that is because we are in a important area therefore I want you all to know that the probability is favor to bears.
***I want you to feel free to leave comments for me and tell me your idea***
ps( I just opened a short position in the area)
cheers 🥂.

BNB short-term GrowHi friends.
Despite a bad news for inflation and us CPI comes 9.1
but we can see a short term grow in market i think.
in that case yesterday Binance burns about 450 milion $ worth of BNB.
and we are in a good support level.
in weekly timeframe we have 2 Resistance ahead:
one at 250$
and one at 315$.
if we surpass first level , we reach second simply.
315$ is also the median of Danchian channel.
hope you like my analisys.
please share me your opinion in comment.
i will be happy.
thank you all for reading my idea.

USD/ZAR at Resistance and Bearish AB=CD & Butterfly PatternSell Now Or Sell After Bearish Candlestick Pattern.
Always Use Risk Management And BreakEven Technique To Your Ideas.
SL = 18.23000
TP1 = 15.78000
TP2 = 14.86000
Are You Agree With My Trading Plan?
Good Luck & Trade With Care.
ForexCityPK

#USDCHF short, #forex4h time-frame:
strong fall and following correction with compression created a resistance area at 0.618 Fibonacci retracement.
15h time-frame:
A Quasimodo pattern detected.

BTC / USDT - 4HChartHello everyone, let's take a look at the BTC to USDT chart over the 4 hour timeframe. As you can see, the price is moving below the local uptrend line.
Let's start with the designation of the support line and as you can see the first support in the near future is $ 19,515, if the support breaks down, the next support is $ 18,675 and $ 17,619.
Now let's move on from the resistance line, as you can see, the first resistance that BTC is currently struggling with is $ 19,764, if you manage to break it, the next resistance will be $ 20,281 and $ 20,727.
Looking at the CHOP indicator, we can see that in the 4-hour interval the energy is slowly increasing and the MACD indicator shows that we have entered the local upward trend.

BTC on a 4 hour interval SHORT!Hello everyone, let's take a look at the BTC to USDT chart over the 4 hour timeframe. As you can see, price is moving above the local uptrend line.
Let's start with the designation of the support line and as you can see the first support in the near future is $ 19,599, if the support breaks down, the next support is $ 18,803.
Now let's move from the resistance line as you can see the first resistance is $ 20,263, if you can break it the next resistance will be $ 20,699, $ 55,2,040, $ 21,423 and $ 21,919.
Looking at the CHOP indicator, we can see that in the 4-hour interval the energy has been used and the MACD indicator shows that we are continuing the local downward trend.

WK-05 (AUD/USD)Let's trade on Support on Resistance Strategy!
Take a short entry when you see a bearish candle pattern closed below the resistance zone.

BTC SHORT 4H INTERVALHello everyone, let's take a look at the BTC to USDT chart over the 4 hour timeframe. As you can see, price is moving above the local uptrend line.
Let's start with the designation of the support line and as you can see the first support in the near future is $ 21,558, if the support breaks down, the next support is $ 21,397 and $ 21,187.
Now let's move from the resistance line as you can see the first resistance is $ 21853, if you can break it the next resistance will be $ 22,018, $ 22,018 and $ 22,244.
Looking at the CHOP indicator, we can see that in the 4-hour interval we have a lot of energy and the MACD indicator shows that we are in a local upward trend.

FCPO still in bearAfter few huge bearish candle, FCPO now at important resistance level.
If this highlighted level is respected, we may see another bearish run towards the monthly trendline.
Around 3500 level

BTC on local uptrend / 1daycahrtHello everyone, let's take a look at the BTC to USDT chart on a 1 day interval as you can see the price is moving above the local uptrend line.
Let's start with the designation of the support line and as you can see the first support in the near future is $ 20,297, if the support breaks down, the next support is $ 19,973 and $ 19,738.
Now let's move from the resistance line as you can see the first resistance is $ 20,634, if you can break it the next resistance will be $ 21,170 and $ 21,861.
Looking at the CHOP indicator, we can see that we have a lot of energy in the 1-day interval, and the MACD indicator shows that the local upward trend is maintained.

Possible senario for EURGBP If the price can overcome the minor structure shown in the chart , after retesting previous levels , we can expect to progress to the next major level

AUDCHF - BULLISH FALLING WEDGE 🚀the USDCHF price is in daily support level & BULLISH FALLING WEDGE pattern .
the NECKLINE IS BROKEN.
the resistance line is broken.
i predict a bullish move 📈
TARGET: 0.69813 🎯
...
if you agreed with this IDEA, please leave a LIKE, SUBSCRIBE or COMMENT!

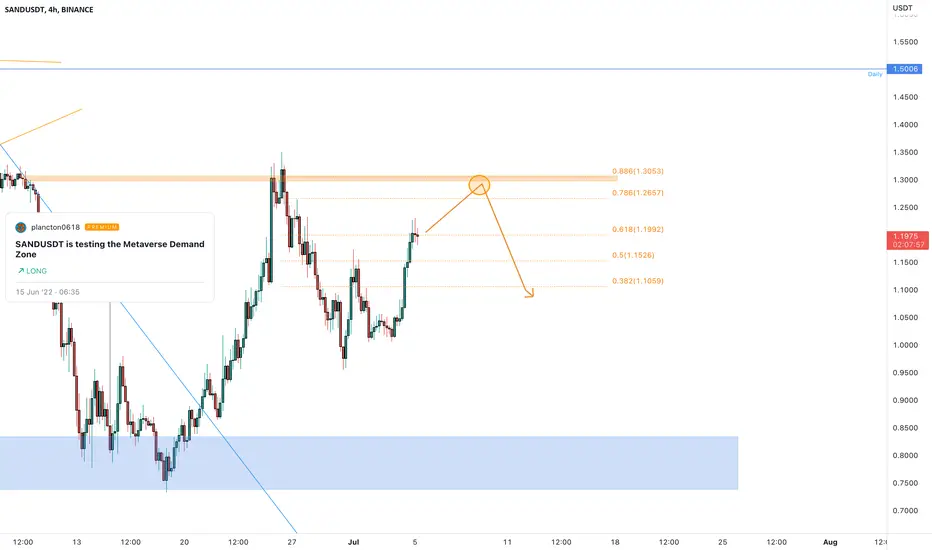
SANDUSDT is going to retest the resistanceThe price had a nice reaction from the daily support as I told you in my previous analysis on 0.8$.
The price could retest again the 0.786 - 0.886 Fibonacci level on the 4h timeframe and got a rejection.
a RETEST is NOT ENOUGH for a short position, the price needs to satisfy our rules
How to approach?
IF the price is going to have a reject from the key level, According to Plancton's strategy , we can set a nice order
–––––
Keep in mind.
🟣 Purple structure -> Monthly structure.
🔴 Red structure -> Weekly structure.
🔵 Blue structure -> Daily structure.
🟡 Yellow structure -> 4h structure.
–––––
Follow the Shrimp 🦐