RNDRUSDT at 4h resistance and getting pushed downSo the resistance is doing its job. Though wanted to take a short trade from that resistance zone but could not as was not on screen. Anyways, now next logical support if this push back continues is the 2.63-2.64 zone as marked on the chart.
Just noticed that 2.68 zone can also act as a support and have marked that also on the chart. Not sure if that is good enough but expect some bounce there.
Rndr

RNDR Render breaking out :) RNDR Render is breaking out now Impulse MACD line has just crossed the Signal line (bullish) some gains expected also trading above the MA

RNDRUSDT probably to head higher from hereThe last long trade did not work out and closed in loss when the support was lost. Taking this long trade again from here. I think the price will hold the previous low and thats why previous low is set as stop loss. Risk is limited so this long trade is favorable.

Render may Retest the Key Level Formed Before the Lift-OffRNDR is likely to retest a key level established prior to the lift-off. The upper boundary of the channel formed needs to be respected for the price to find a robust support before any potential rally.

RNDRUSDT on support, likely to move up towards 4h resistanPrice is at local hourly support. Lets try a long here towards 4h resistance and probably higher.

RNDRUSDT high time frame updateWe have talked about this monthly resistance in some of the previous trade setups. The resistance is doing its job till now and have kept the price controlled and currently trading just under it. The daily support under that resistance is holding the price and providing the bounce we see.

RNDRUSDT likely to head down o 2.54 from 4h resistanceAnyways, I decided to take this short trade. While redrawing the chart I noticed that the 4h resistance was not drawn correctly which explains a bit excessive divergence from the resistance zone earlier. Anyways, I have redrawn that 4h resistance appropriately now. So now the price is heading towards resistance to retest it from below so probability is favoring short here. But entry is a bit conservative so possible it wont get filled. First target is 2.547 but may also extend to 2.51.

RNDRUSDT trading around 4h resistance, likely to head to 2.55The price is at 4h resistance again. Well, it can break the resistance this time but still short is favorable here. I would bet for a short here with a small position size. Target is 2.55.

RNDRUSDT on hourly support and may bounce to 2.56-2.59The price retraced from the 4h resistance as marked on the chart as the final target of the last long trade. Now the price is again at the hourly support and expect the price to bounce here . The bounce is actually already taking place while I am writing this. Target marked on the chart for this long trade.

RNDRUSDT at daily support, likely to head towards 2.54 and 2.60The price has entered into the daily support zone. This provides a trade opportunity favoring a long. The price may breach the level briefly but I think it is going to bounce enough from here to provide the long trade opportunity as marked on the chart towards 2.54 and 2.60.

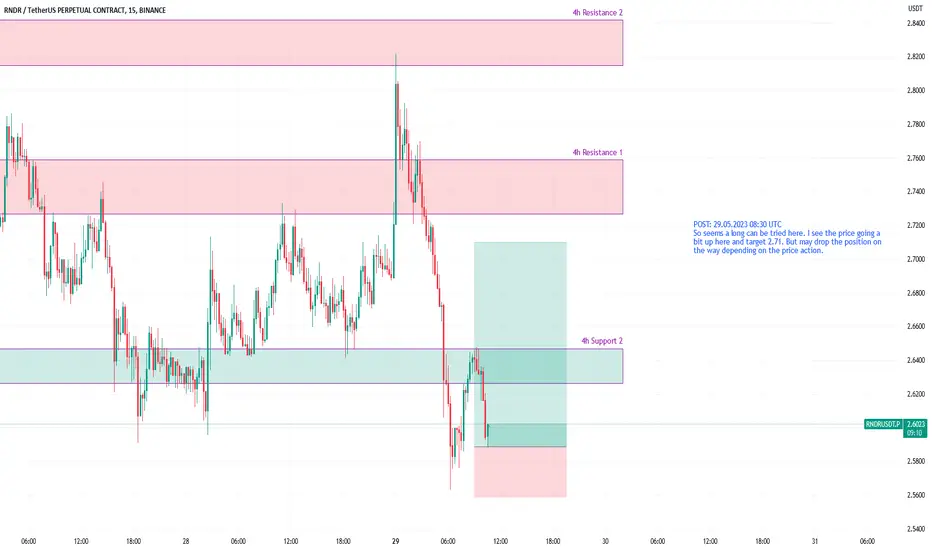
RNDRUSDT likely to head towards 2.70So seems a long can be tried here. I see the price going a bit up here and target 2.71. But may drop the position on the way depending on the price action.
Render Token (RNDR) forming bullish Gartley for upto 14% pumpHi dear friends, hope you are well and welcome to the new trade setup of Render Token (RNDR) with US Dollar pair.
Our last successful trade of RNDR was as below:
Now on a 4-hr time frame, RNDR has almost formed a bullish Gartley move for the next bullish reversal move.
Note: Above idea is for educational purpose only. It is advised to diversify and strictly follow the stop loss, and don't get stuck with trade.

Correction wave is happeningOn D TF,
BINANCE:RNDRUSDT has completed the impulse wave at 2.95.
Now, it's correcting to around 2.2
Wait and see the first leg

RNDRUSDT at 4h support and likely to head to 2.70The price is at the next 4h support. This one is a bit reasonable support than the previous one. Lets try this long towards 2.70 area.

RNDR ( mid - long term hold ) RNDR ( mid - long term hold )
Market Cap: 1B
Category: AI
Target 1: 3.9079
Target 2: 4.8257
Target 3: 5.8423
Stop Loss: 2.4819
( if you get stopped out ... re-enter on 2.6231 level )
Manage Risk - have a stop loss in place
Not Financial Advice
This is for Entertainment Only

RNDRUSDT at support and may head to 2.78 zoneNow since the price is at support, a long is favorable here. I expect the price to march up at least till 2.78 area.

RNDR - falling from the skiessignificant clean trend wall resistance increases the probability of a possible correction towards inefficient price action area.

RNDRUSDT at 4h resistance, long favorable from 4h supportThe price is currently trading inside the 4h resistance zone and I expect it to come back to the 4h support zone. The support is not that strong but I still think that a long is favorable from there. Lets try this long if the price retraces till that support level.

RNDRUSDT to bounce from daily support to 2.54 and 2.63The price has touched the daily support and already bouncing from there. I expect the price to bounce higher and therefore favoring a long trade. I expect it to move to 2.54 first and then to 2.63 next.

RNDR Support Bounce Long SetupRules met to enter:
Price has nicely previously bounced from our support levels. Price is above VWAP. We attempt to enter on the previously lowest wick in the support zone. SL is placed below VWAP and TP is calculated using a 4:1 Ratio base day on our SL.

RNDRUSDT SCALPING ANALYSISAS you can see RNDR is in a up trend.
I will wait on RNDR to break down from the up trend and when it open closes under I will open a short

RNDR close to a serious resistanceIMPORTANT: this is a short signal but on HTF which means I'm giving the area in which I'd look for a short but doesn't mean I'm telling you to short as soon as price goes there, this is a WEEKLY chart.
RNDR pumped a lot lately but I think the top of this run is almost in. I expect price to reach that DAILY resistance area with weekly RSI being low and then retrace between 30 and 45%. Volume keeps lowering as confirmation of my idea.
Considering the coin is relatively young and the amount of volume since last January, it's clear that best price opportunity to fill your bags and hold is gone. Most bearish scenario would be around 0.822
USDT
but it's likely it won't go below 1.64 unless BTC dumps hard. I still believe we should see BTC dumping because I think that world economy should reflects also on crypto a bit further but I might be wrong.
I'll set an alert for then price reaches the resistance area so that I'll be able to update the signal with a short setup if it's the case.
Good luck

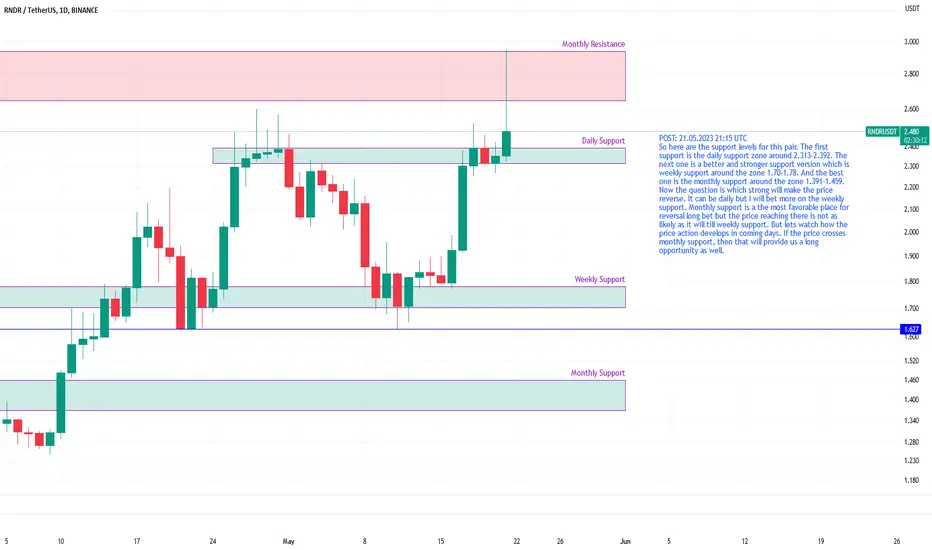
RNDRUSDT likely have reversal from weekly support 1.70-178So here are the support levels for this pair. The first support is the daily support zone around 2.313-2.392. The next one is a better and stronger support version which is weekly support around the zone 1.70-1.78. And the best one is the monthly support around the zone 1.391-1.459. Now the question is which strong will make the price reverse. It can be daily but I will bet more on the weekly support. Monthly support is a the most favorable place for reversal long bet but the price reaching there is not as likely as it will till weekly support. But lets watch how the price action develops in coming days. If the price crosses monthly support, then that will provide us a long opportunity as well.