NASDAQ Friday13th Oct-2023:Analysis Should I Buy or Sell?TargetsAllright guyz
Please watch also my other last 3 videos,that will mention the way I trade- And hopefully it is benfical for you too.
Indices are dropping like I said days ago, Banking crisis and Middle East conflict threathenning.
Trading is a decision game, and sometimes taing decisions are really hard...
But there are ways how to create your full potential and prepare for the next weeks...
Thanks to all my followers, also new followers, an those who share their thoughts here and discuss in Respect.
Have a good weekend
Russell2000

NASDAQ Today 13.Oct.2023 :Insane Strategy shows where Bears ...Watch the previouse 2 parts please. This indicator confirmed very nice bullish, bearish, reversals and also Taking profit levels. Today? Well odds and signs are in favour of the Bears: But hey.Trend can change immediately.

RUSSELL 2000 Support Zone rebound?Russell 2000 (RUT) entered on Friday the wide Support Zone (1700 - 1630) that was formed on the May 12 2022 Low. The 1D candle closed inside it so unlike the bottoms that had wicks that recovered and closed above the Zone, this is most likely similar to the June 16 2022 and September 23 2022 breaches.
A low is to be expected around 1640 but the index is already a strong long-term buy, as the cyclical behavior of the Sine Waves suggests. The tops match perfectly with the Waves. In any case, from now on the first sign of 1D RSI Higher Lows (Bullish Divergence if the candles are on Lower Lows), will be the last confirmation we need of an upcoming bullish leg, which was the characteristic of all previous 3 bottoms.
On top of that, 10 days ago a 1D Death Cross was formed and even though that's a technical bearish pattern, last time it signalled the bottom. Our target is 2000, just below the 2008 - 2027 Resistance Zone.
-------------------------------------------------------------------------------
** Please LIKE 👍, FOLLOW ✅, SHARE 🙌 and COMMENT ✍ if you enjoy this idea! Also share your ideas and charts in the comments section below! This is best way to keep it relevant, support us, keep the content here free and allow the idea to reach as many people as possible. **
-------------------------------------------------------------------------------
💸💸💸💸💸💸
👇 👇 👇 👇 👇 👇

GameStop: Remains In A Position to Break Bullishly From Its ZoneGME has been getting sold off with the macro for quite some time and it continues to push deeper and deeper into dangerous territory. At this point in time, it has pushed slightly below the 0.382/0.886 Confluence Zone and is now at the 200 SMA, but with that, we can see that the Local Bullish Shark can extend into a 1.618 Extension, so the Breakout watch is far from over on GME though we are getting towards levels where one may leave it alone. I would say that if GME breaks below $11.50, there would be a very distinct chance of it dumping down to $9.5, but if it instead holds above $11.5 and pushes back above $14.00, then we could instead see GME make a rapid move up to $18.00, which would be just high enough to test the supply line of our Channel/Falling Wedge. From there we could possibly break out of it and go for the measured move, but for now, I'd say one would probably want to have a short-term position to take profits on at $18.00 and a separate longer-term position to hold strong until GME gets the big measured move breakout to $74 - $134

IWM: Breaking Down From A Bear Flag Visible on the MonthlyThe Russell 2000 has broken down from a Bear Flag that is visible on the monthly timeframe; at the same time, the RSI is breaking below trend and the MACD has flipped Bearish. If this goes like last time, it will result in a deep bearish retrace, perhaps all the way down to the $70s or even the $50s. One thing to keep in mind is that the Russell is heavily linked to Finacial Stocks and Banks, so this Bearish Setup here is likely more indicative of what's to come for the financial sector, including Banks, REITs, and other Services, than anything else.

RUSSELL 2000 Holding the key Bull Cycle Support. Disaster below?Russell 200 (RUT) has had a big safeguard on the current Bull Cycle following the Housing Crisis bottom in 2009. The symmetrical Zone that was formed on the previous All Time High (ATH) has always held once it transitioned into Support upon periods of corrections (with the natural exception of COVID) and provided the framework for the rebound initiation of the next rally.
This time the previous ATH Zone has been continuously tested since May 2022 and so far has closed all candles above it. October has already entered this Support Zone with the 1M MA100 (green trend-line) right below it and the longer it holds, the sooner it will also enter the Zone. When the 1M MA100 broke during the COVID collapse, the flash crash extended almost as low as the 1M MA200 (orange trend-line).
Naturally the market conditions now are severely different than then, but the Support Zone must hold at all costs. If it breaks, the distress signal that will send may echo across high cap markets, especially the technology sector.
-------------------------------------------------------------------------------
** Please LIKE 👍, FOLLOW ✅, SHARE 🙌 and COMMENT ✍ if you enjoy this idea! Also share your ideas and charts in the comments section below! This is best way to keep it relevant, support us, keep the content here free and allow the idea to reach as many people as possible. **
-------------------------------------------------------------------------------
💸💸💸💸💸💸
👇 👇 👇 👇 👇 👇

Fed Pause is the New Restricted PolicyCME: Micro Russell 2000 ( CME_MINI:M2K1! )
Global financial market orbits around Federal Reserve’s interest rate decisions. By concept, hiking interest rates means monetary tightening while cutting them signals easing. In reality, market perception to the Fed actions evolves over time, sometimes blurring the difference between “good news” and “bad news”.
• On May 5, 2022, the Fed surprised the market with a larger-than-expected 50-bps rate hike. The S&P 500 fell 3.6%. This is a normal market reaction to bad news.
• On July 27, 2022, the Fed hiked 75 bps and the S&P soared 2.6%! Previous meetings saw the Fed raising the stake from 25 to 50 and then 75 bps. By not getting a bigger 100-bp hike, investors were relieved and cheered as if it were good news.
• On February 1st, the Fed raised for the 8th time, but the S&P went up 1%. With lower-than expected inflation, investors concluded that this would be “the last” rate hike.
• On September 20th, the Fed paused after raising for 11 consecutive times. The S&P were down 1% as investors were spooked by the hawkish Fed statement.
Last Friday, the Bureau of Economic Analysis (BEA) reported that personal consumption expenditures price index (PIC) excluding food and energy increased 0.1% for August, lower than expectation. On a 12-month basis, the index was up 3.9%.
As the Fed’s favorite inflation gauge shows that the fight against higher prices is making progress, “Fed Pause” might be the new baseline case for the US central bank’s interest rate decision.
The futures market agrees. CME FedWatch Tool shows that the probability of the Fed keeping rate at 5.25-5.50% is high through Mid-2024. Specifically:
(Link: www.cmegroup.com)
• Fed pause on November 1st, 2023 FOMC meeting: an 82% probability
• Fed pause on December 13th, 2023: at 65%
• Fed pause on January 31st, 2024: at 65%
• Fed pause on March 20th, 2024: at 60%
• Fed pause on May 1st, 2024: at 49%
Last year, a Fed Pause meant slowing the rate hikes. It has a very different meaning now: to keep the interest rate higher for longer. Therefore, what was once a signal of easing should now be viewed as restricted monetary policy.
Even if the Fed stops raising rates, the cumulative effect of past rate hikes would continue to ripple through the US economy. Government policy has a lagging period, but it has passed. Households and businesses now feel the full force of higher borrowing costs. Below are two-year changes of selected interest rates from the FRED:
• 30-Year-Fixed Mortgage Rate: from 3.01% to 6.29% to 7.29%
• 72-Month New Car Loan: 4.17% - 5.19% - 7.80%
• Credit Card Interest Rate: 14.61% - 15.13% - 20.68%
• Baa Corporate Bond Yields: 3.26% - 5.97% - 6.39%
Restricted monetary policy would have negative impacts on stocks. Good news: Market prices show that investors have not yet adapted to changes in the Fed trajectory.
Russell 2000: The Weakest Link
The discounted cash flow (DCF) pricing theory states that stock price is the present value (PV) of expected future cash flows discounted by the weighted average cost of capital (WACC). A higher cost of capital shall cause stock price to fall, other things equal.
Small- and medium-sized companies would be hit harder comparing to larger corporations. As rates go up, credit standard will be tightened, and credit spread will expand. Below are current bond rates charged to companies with different credit scores:
• 10-Year Treasury Bond Yield: 4.58%
• Moody’s Aaa Corporate Bond Yield: 4.95%
• Moody’s Baa Corporate Bond Yield: 6.39%
• Bank of America BBB Corporate Bond Yield: 6.31%
• Bank of America BB High Yield: 7.55%
• Bank of America CCC or Lower High Yield: 14.05%
Russell 2000 is the benchmark stock market index for the US small companies. CME Micro Russell 2000 futures ( FWB:M2K ) has a drawdown of 200 points in the past two months, from yearly high of 2013 to 1807. The index is still up 2.6% YTD.
As the Fed keeps rates high for the next 6-9 months, corporate bond yields could likely go higher. And the credit spreads, including Baa-Bbb, Baa-Bb, and Baa-Ccc, would likely get wider. This could put further downward pressure on the Russell index.
Could we quantify the impact? Let’s illustrate this with a $1 million payment, to be received in five years.
• Applying the BBB corporate bond yield 6.31% as the WACC, present value of $1 million will be $736,427.
• If the WACC goes up by 200 bps, the PV will be reduced to $670,899.
• This shows that a 2% increase in WACC could cause an 8.9% loss in market value.
The same concept would work on the Russell index. WACC could go up, either due to a rise of general interest rate level, or because of the widening of credit spread. The result would be the decrease in the market value of Russell component companies.
For someone with a bearish view of the Russell 2000, he could establish a short position in Micro Russell futures. The contract has a notional value at $5 times the index. At Friday closing price of 1807, each December contract (M2KZ3) is worth $9,035. CME Group requires an initial margin of $620 for each M2K contract, long or short.
A short trader would gain $5 for each point the M2K moving down. Hypothetically, if the Russell is 5% lower, the 90-point slide would translate into $452 gain per contract. The risk of short futures is the index going up. If investors continue to perceive Fed Pause as “good news”, Russell could rise after the November and December FOMC meetings.
Happy Trading.
Disclaimers
*Trade ideas cited above are for illustration only, as an integral part of a case study to demonstrate the fundamental concepts in risk management under the market scenarios being discussed. They shall not be construed as investment recommendations or advice. Nor are they used to promote any specific products, or services.
CME Real-time Market Data help identify trading set-ups and express my market views. If you have futures in your trading portfolio, you can check out on CME Group data plans available that suit your trading needs www.tradingview.com

Russell 2000 Micro E-Mini Futures (M2k1!) - 4:1 LongMy analysis of the Russell 2000 surprises me, since I am instinctively more bearish than the chart seems to be. Hopefully you will challenge my forecast with your tough questions, since this venue is meant to arouse the reverse-engineers and to provoke the thinkers to do what they do best, right?
As always, I strive to render these ideas of mine so obviously that their explanation will require no words.
Nevertheless, this 4:1 Long trade on the M2k1! chart is of fundamental interest, considering that the Russell 2000 Index is a leading indicator of the US economy as a whole. Note that I have not entered the trade, because I expect price to fall farther still, as indicated by the custom Trend Exhaustion Wedge.
Although my trading strategy is built on innate Pattern Recognition and a hard-won sympathy for the Market Maker’s Business Model, my tactics - including the beauty of Tradingview and how it makes me look good - are based on identifying the opportunities within VOLUME, VOLATILITY and TREND EXHAUSTION.
As I mention in most of my other ideas, trading the CD leg of harmonic patterns is especially risky, since they are NOT confirmed until after the D-point prints.
Although I prefer to rely on the charts, I cannot help but notice the many challenges being visited upon China these days, which could indicate a timely trend reversal for American industries. Of course, this is NOT a longterm forecast, nor am I instinctively bullish, per se.
In the short and medium terms, price action should remain bound by the 0.236 to 0.382 Fibonacci retracement range set by the ATH during the "Everything Peak", shown in this 4h chart by the highlighted Purple channel. There are so many unknowns beyond Q2 2024 (on account of CBDCs, among other variables), that it is too soon to assume that price action will return to the Blue accumulation zone that also marks the top of the forecasted move, even though some important pre-Covid levels have been tested.
Followers of my ideas may not be familiar with the aforementioned Wedge, which (among other things) suggests possible late entries in case price fails to hit the specified entry level from below, after confirming a C-point. The Wedge is merely one of many details in the full chart, which can't be seen in this condensed 4h version.
I am preparing a video on prospecting for opportunities during the Sector Rotation, and the RUT and the E-Mini Futures are part of it. First, though, I have a few more ideas to upload as I update other key charts for the final Quarter of 2023.
Until then, be liquid !!!](<My analysis of the Russell 2000 surprises me, since I am instinctively more bearish than the chart seems to be. Hopefully you will challenge my forecast with your tough questions, since this venue is meant to arouse the reverse-engineers and to provoke the thinkers to do what they do best, right?
As always, I strive to render these ideas of mine so obviously that their explanation will require no words.
Nevertheless, this 4:1 Long trade on the M2k1! chart is of fundamental interest, considering that the Russell 2000 Index is a leading indicator of the US economy as a whole. Note that I have not entered the trade, because I expect price to fall farther still, as indicated by the custom Trend Exhaustion Wedge.
Although my trading strategy is built on innate Pattern Recognition and a hard-won sympathy for the Market Maker’s Business Model, my tactics - including the beauty of Tradingview and how it makes me look good - are based on identifying the opportunities within VOLUME, VOLATILITY and TREND EXHAUSTION.
As I mention in most of my other ideas, trading the CD leg of harmonic patterns is especially risky, since they are NOT confirmed until after the D-point prints.
Although I prefer to rely on the charts, I cannot help but notice the many challenges being visited upon China these days, which could indicate a timely trend reversal for American industries. Of course, this is NOT a longterm forecast, nor am I instinctively bullish, per se.
In the short and medium terms, price action should remain bound by the 0.236 to 0.382 Fibonacci retracement range set by the ATH during the "Everything Peak", shown in this 4h chart by the highlighted Purple channel. There are so many unknowns beyond Q2 2024 (on account of CBDCs, among other variables), that it is too soon to assume that price action will return to the Blue accumulation zone that also marks the top of the forecasted move, even though some important pre-Covid levels have been tested.
Followers of my ideas may not be familiar with the aforementioned Wedge, which (among other things) suggests possible late entries in case price fails to hit the specified entry level from below, after confirming a C-point. The Wedge is merely one of many details in the full chart, which can't be seen in this condensed 4h version.
I am preparing a video on prospecting for opportunities during the Sector Rotation, and the RUT and the E-Mini Futures are part of it. First, though, I have a few more ideas to upload as I update other key charts for the final Quarter of 2023.
Until then, be liquid !!!

RUSSELL 2000: Can drop more before an end-of-year rebound.Russell 2000 broke again today under the 1D MA200 after failing to close over the 1D MA50 on September 1st. Despite numerous breaks under the 1D MA200, all candles managed to close over it. If today's close under it (first time since June 5th) along with the bearish 1D technicals (RSI = 35.725, MACD = -19.100, ADX = 32.380), we expect the price to drop more inside the HL Zone. Then it will become a buy opportunity again and we estimate an end of the year rally towards the R1 Zone again (TP = 2,015).
## If you like our free content follow our profile to get more daily ideas. ##
## Comments and likes are greatly appreciated. ##

US2000: Thoughts and AnalysisToday's focus: US2000
Pattern – Descending Triangle Pattern
Support – 1840
Resistance – 1870
Thanks for checking out today’s update. Today, we have run over US2000, breaking down the overall price picture, levels, and patterns and incorporating moving average and RSI into the analysis.
The Russel isn’t a market I normally watch or trade, but the descending triangle pattern did catch my eye today. Overall price sits in a range, but it has broken a trend on the inside and set up a LH. These patterns are normally seen as bearish after a trend break, but support looks rather firm at this stage.
With the FOMC coming up later this week, watch out for a false breakout lower that closes higher. This could set up a higher breakout. If sellers continue to push at support, look for a solid close-through support with a new failed rally that sets a new weekly low.
It’s going to be interesting to see which side gets the win here.
Have a great day and good trading.

Global Equities; The decline of rationality ...... and the rise of financial engineering - manifesting in a generational shift toward pure leverage.
"When they look back at this segment of history they will probably ask: What the hell were they thinking?!"
Reporter: "How is it possible that the DJIA loses 90% of it's value? ...
B.G.: "It is very simple, really. First, it loses 50% of it's value and then, 80% of the remainder." - Benjamin Graham, from a 1934 interview.

Does history rythmes?2020-21 felt a lot like 99-00
1. Inflated valuations
2. Record high IPOs
3. Retail participation
Do we see the same cycle again?

Possible H&S chart structure in RussellA decisive close below the neckline would spell trouble for small caps in U.S. market

Russel 2000 is respecting the trendlineTVC:RUT touched the trend line and got a nice push. The price may sideline here a bit. If the push continues for SKILLING:NASDAQ , the money will start rotating to small caps back again.
Disclaimer – WhaleGambit. Please be reminded – you alone are responsible for your trading – both gains and losses. There is a very high degree of risk involved in trading. The technical analysis , like all indicators, strategies, columns, articles and other features accessible on/though this site is for informational purposes only and should not be construed as investment advice by you. Your use of the technical analysis , as would also your use of all mentioned indicators, strategies, columns, articles and all other features, is entirely at your own risk and it is your sole responsibility to evaluate the accuracy, completeness and usefulness (including suitability) of the information. You should assess the risk of any trade with your financial adviser and make your own independent decision(s) regarding any tradable products which may be the subject matter of the technical analysis or any of the said indicators, strategies, columns, articles and all other features.

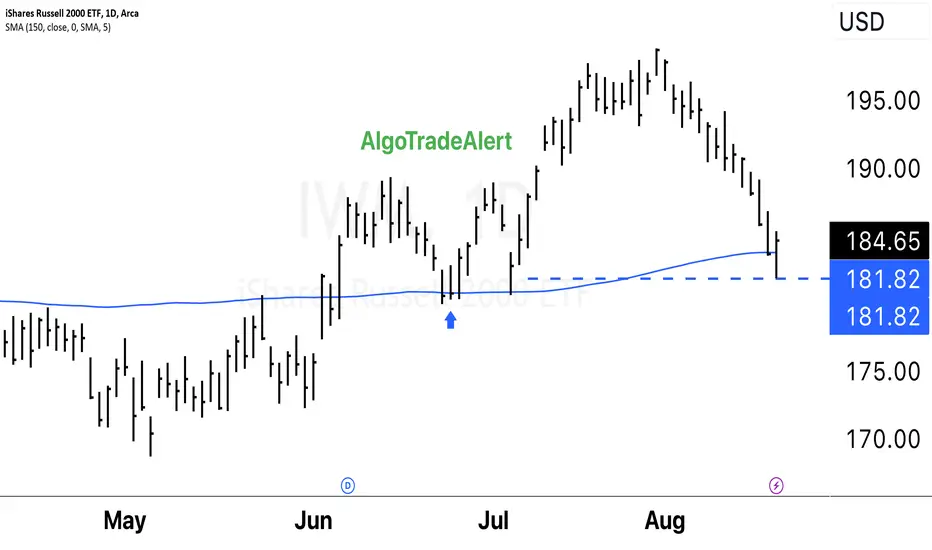
$IWM Bullish Daily Close AMEX:IWM Small Caps had a Bullish Daily Close. Tested my support level. Small caps will lead the broader market. The IWM is more sensitive to liquidity. I have been long since the blue arrow.
A "double bottom" is a bullish reversal pattern that occurs after a downtrend and is characterized by two consecutive lows at a similar price level, followed by a breakout above the pattern's neckline. This pattern suggests a potential reversal from the downtrend to an uptrend.
A "false breakdown" occurs when a price breaks below a support level but quickly reverses and closes back above it. This can be interpreted as a bullish sign, indicating that the selling pressure wasn't sustained, and buyers stepped in to push the price back up.
The idea that "the best moves come from failed moves" is a common adage in trading and investing. It suggests that when a market or a security initially breaks out or breaks down and then reverses, it can lead to strong price movements in the opposite direction. This is often attributed to the idea that traders who were positioned on the wrong side of the initial move are forced to close their positions, contributing to the momentum in the opposite direction.
It's important to note that while these concepts are commonly discussed in trading circles, they are not foolproof strategies. Technical analysis is just one approach to understanding price movements in financial markets, and it should be used in conjunction with other forms of analysis and risk management strategies. Markets can be unpredictable, and there is no guarantee that any pattern or signal will always lead to a profitable outcome.
LONG opportunity in Russel (RTY)Context:
Weekly - uptrend (UT)
Daily - downtrend (DT)
Last day:
Value moved down but left very poor and weak high
Special notes:
Daily RSI is in oversold. Price at DMA200 support
Conclusion:
A lot of selling in the last 10 days. Market is getting too short and needs to cover those shorts before moving further down. Last day indicates lack of strong sellers, which creates opportunity for short-term bull bounce. DMA200 provides logical support
Disclaimer
I don't give trading or investing advices, just sharing my thoughts

Bearish fib compression on the Russell 2000A nice bearish fibonacci compression is forming on the Russell 2000. We're currently at the optimal entry point.
The indicator can be found in my scripts.
Happy trading!

Russel2K Long Consumers Expect Further Declines In InflationConsumers Expect Further Declines In Inflation
Finally! Russel is the dirigent in an Stock rally or Crash Orchestra, as it moves faster and is sensitive. Not this time. Whil S+P500,Nasdaq100 and Dow choosed the bullish trend, for longer time than expected,now Russel starts to ralley.
Technically has Russel found a triple strong bullish support, and RSI trend continuation confirmation:SEE THE CHART ABOVE!
The DXY is bearish and that is good for Russel.
Strategy: trend bullish.
Resistance supports (See the chart above)

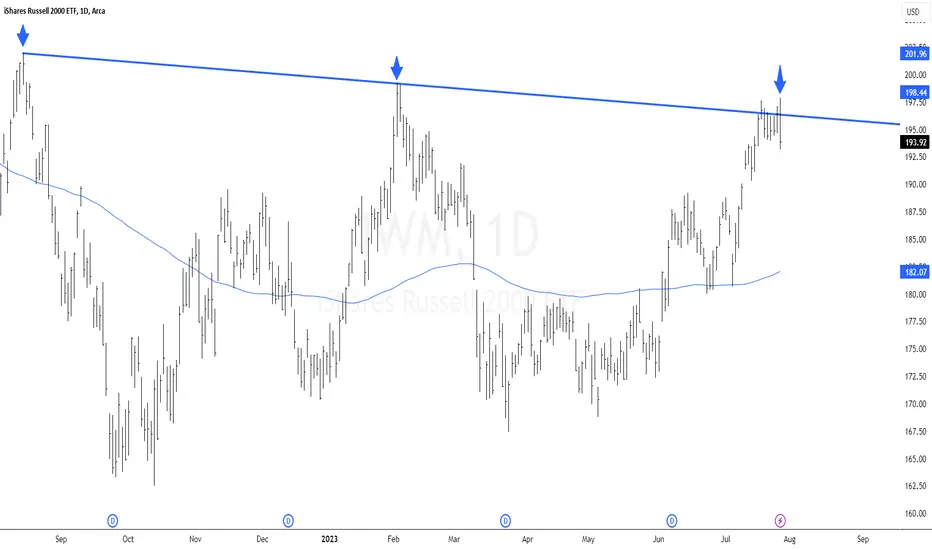
$IWM Trend Line TestAMEX:IWM Trend Line Tested
The Russell 2000 index tested its trend line today. This is a significant level, as it is the second time that the index has bounced off of this trend line in that started last year in August 16, 2022.
IWM Bearish Engulfing +5 CandleThe IWM ETF which tracks the Russel 2000 index put in an outside reversal, or bearish engulfing, candle today which eclipsed the 6 prior daily candles. When the body of a price candle completely engulfs the prior candle it is called a bearish engulfing candle. Since todays candle also engulfed the 5 candles prior to yesterdays it is called a bearish engulfing plus 5 candle(BE+5), for a total of 6 candles that were eclipsed by todays candle. The more candles that are engulfed by an outside reversal candle the more bearish the move and outlook.
Raising your stop-losses and/or taking some short bets against the market isn't a bad move here on an outside reversal day like today was, especially if markets close down going into the weekend. If markets close red on a Friday, they tend to close red the following Monday as well.

TARGET REACHED Russell 2000W Formation formed and broke out in June.
Since then, it's been smooth sailing with demand and buying up to the target of 1,973.
Moving averages are all up 7>21>200 and RSI> 50
Now it's a momentum trading range where trend traders can continue to hold and ride it up.
We will update the trade idea when a new Breakout pattern occurs.

Market Rotation Theory (S&P, Nasdaq, Dow & Russell)Something interesting i've been noticing in the market since the lowest lows back in October 2022 is that the "new bull market" appears to be activating in stages, kinda like it's going in rotation from one investment class to the next:
-Dow Top Performer Q4'22
-S&P Top Performer Q1'23
-Nasdaq Top Performer Q2'23
And if this were to continue then it's entirely possible that Russell 2000 could be the Top Performer in Q3'23 for a couple of reasons:
1. Held up decently well during the Mini Banking Crisis of March 2023
2. Appears to be in a massive accumulation phase & potentially making in Higher Lows
3. Small Caps were the first to crash back in Q4'21, front loading what was to come in 2022, which means that it'll be the last to run with potentially decent risk to reward ratios.

IWM: Something is Rotten in the State of MarketsPrimary Chart: IWM on a weekly timeframe with downtrend line and major support and resistance zones
Note1: IWM is an iShares ETF that represents the Russell 2000 small-cap index in the United States. Though not as widely tracked as SPX, NDX, or DJIA, the Russell 2000 ( TVC:RUT ) is one of the major US indices. It is likely the fourth most watched US index.
Note2: The phrase "something is rotten in the state of Denmark" is a well-known line from Shakespeare's play Hamlet used to describe a situation where something is wrong or even corrupt within a government, institution, or system. No corruption is intended to be implied discussed. The title's allusion to this phrase is meant to suggest only that something is off / wrong in the markets, i.e., that everything is not well despite the strength of the Nasdaq 100 lately and the support seen in SPX.
The Russell 2000 (IWM) is often a leading indicator in US markets. It led to the downside in early November 2021 after a false breakout out of its 2021 topping-pattern's resistance around $234. SPX topped nearly two months later on January 4, 2022. While small-caps are not necessarily always the first to make a move, it is something frequently cited by commentators and analysts.
The primary chart shows how IWM has struggled below the upper blue rectangular zone, a resistance / supply zone going back to highs in March and April 2022. This zone also rejected price at the end of the impressive August 2022 rally that had everyone debating whether the bull-market had returned in earnest. Lastly, on February 2, 2023, IWM was unable to even tag the lower edge of this zone, eking out a high at $199.26. The lower edge of this blue resistance zone as drawn here is at HKEX:200 - HKEX:201 approximately.
The Primary Chart above also shows an important Fibonacci support level at $170. This the 50% retracement of the entire bull market from the 2020 Covid lows to the highs in November 2021. This has also marked important support since late October 2022 (a week or two after the October 2022 lows). Notice the weekly candle wicks protruding below this line but recovering back above it.
The final point about the Primary Chart is the down TL from the all-time high in magenta. This was broken to the upside, which was one of the reasons many market participants and commentators got excited about the bear being complete. That trendline was retested in late March 2023. But despite this positive development, IWM has not acted well. In fact, it has broken decisively below a multi-month upward trendline from October 2022 lows as shown on the Primary Chart as well. This trendline was also important and signifies weakness on the decisive break below it.
On the larger scale, price is trapped between the blue rectangular zones of support and resistance. Until these break, not much progress is likely in either direction. Sideways action is likely for the coming weeks. The one thing that would negate the sideways action view is a clean break back below the down trendline from the all-time high. So keep an eye out for that development.
Next, Supplementary Chart A.1 and A.2 below shows a hypothetical illustration of how price could move sideways for the coming weeks / months before a flush below major support (if one is bearish about equities generally) or a rally above the key resistance zone (if one is bullish about equities generally). SquishTrade gives an edge to the bears in the intermediate to longer-term time frames—as long as price stays below both (1) the uptrend line from October 2022 lows, and (2) the key Fibonacci levels of the most recent decline (shown on the Primary Chart at $183.36 and $187.11).
Supplementary Chart A.1 (measured corrective move upward where the legs of the corrective move might be equal or share a 1.272 Fibonacci relationship)
Supplementary Chart A.2 (choppy sideways action that retests the upward TL from the October 2022 lows that had broken down in March 2023 before heading lower again)
Supplementary Chart B is a zoomed-out version of the major resistance and support level shown on the Primary Chart. This is intended to show the ranging action for months that has taken place despite periods of seemingly impressive strength and sharp weakness.
Supplementary Chart B
The next chart, Supplementary Chart C, illustrates what a trendline might look like if someone were considering this chart afresh, i.e., for the first time without having tracked the prior trendlines during the 2021-2022 bear market. The TL has been re-drawn to account for the recent major highs at the end of the January to February 2023 rally.
Supplementary Chart C
IWM's anchored VWAPs are not encouraging. Here, the only VWAPs considered are the one anchored to the all-time high in November 2021 (blue-purple line) and the 2022 low (orange line). Price made a false breakout above the VWAP from the all-time high and failed back below. That in itself is a negative especially given that this occurred on a larger time frame going back to 2021. Price has also failed below the October 2022 VWAP as well.
Supplementary Chart D
Finally, and most importantly, consider the ratio spread of IWM/SPY in Supplementary Chart E below . This tracks the performance of the Russell 200 relative to the S&P 500. This is why something might be rotten in the state of Denmark (markets). A healthy market should not have an index looking this bad. Let me know what you think in the comments.
Supplementary Chart E
The ratio spread shows that IWM's underperformance just broke below a key support level for that ratio. But bigger support lies below. However, the overall picture looks bleak for IWM with a downtrend line that has lasted for a while, and lower highs for the ratio's value on higher time frames.
________________________________________
Author's Comment: Thank you for reviewing this post and considering its charts and analysis. The author welcomes comments, discussion and debate (respectfully presented) in the comment section. Shared charts are especially helpful to support any opposing or alternative view. This article is intended to present an unbiased, technical view of the security or tradable risk asset discussed.
Please note further that this technical-analysis viewpoint is short-term in nature. This is not a trade recommendation but a technical-analysis overview and commentary with levels to watch for the near term. This technical-analysis viewpoint could change at a moment's notice should price move beyond a level of invalidation. Further, proper risk-management techniques are vital to trading success. And countertrend or mean-reversion trading, e.g., trading a rally in a bear market, is lower probability and is tricky and challenging even for the most experienced traders.
DISCLAIMER: This post contains commentary published solely for educational and informational purposes. This post's content (and any content available through links in this post) and its views do not constitute financial advice or an investment or trading recommendation, and they do not account for readers' personal financial circumstances, or their investing or trading objectives, time frame, and risk tolerance. Readers should perform their own due diligence, and consult a qualified financial adviser or other investment / financial professional before entering any trade, investment or other transaction.
