SBI Clear Head & Shoulder PatternRight now SBI is having a clear resistant line where it is making the head and shoulder pattern which is going in the right direction. So do your analysis and enter the trade.
Sbinanalysis

SBIN | Good Short Opportunity.When it comes to the technical analysis of SBIN, you might get an impulse to the downside. Based on my technical analysis, you might see a fall to the downside. If you are going in, better find a pullback. I have marked a good entry area on the chart; you may use it as an entry area. And also don't forget to place the stop just above the entry area.
What do you think is more likely to happen? Please share your thoughts in comment section. And also give a thumbs up if you find this idea helpful. Any feedback & suggestions would help in further improving the analysis.
If you find this technical analysis useful, please like & share our ideas with the community.
Good Luck!
Disclaimer!
This post does not provide financial advice. It is for educational purposes only! You can use the information from the post to make your own trading plan for the market. But you must do your own research and use it as the priority. Trading is risky, and it is not suitable for everyone. Only you can be responsible for your trading.

Simple Trade Setup | SBIN | 18-04-2022 [INTRADAY]NSE:SBIN
Trade Setup for 18-04-2022
1) Don't Jump in to trade at the beginning of the market. Let it get settle for 15-20min first and judge the price action.
2) Everything is mentioned on the chart. I hope it is easy to understand.
3) All the levels will work as support, resistance, entry and exit w.r.t price action near that level.
4) Avoid gap up or gap down chase. Wait and trade between levels.
Please refer below chart for levels.
Hope I made it easy to understand it.
Do comment your doubt or suggestion.
Note: Trade with Strict SL. It may or may not hit all the levels. So one can book profit / loss at respective level considering how price action works near that level.

SBI ABC setup is suggesting a sharp up moveThe stock is following wave ABC pattern.
As long as recent low holds we can see a sharp up move.
Let it pull back and do retracement
then it will be a confirm reversal for 550.

SBINHello and welcome to this analysis on STATE BANK OF INDIA
On FEB 15, it showed a very strong reversal after 5 days of steady decline from 550 to sub 500.
Currently on the hourly time frame it is completing a bullish flag and pole pattern suggesting upside levels of 535-540 as long as it does not break below 510.
Good Risk Reward set up here

SBIN | Good Sell Opportunity. Go Short!If you find this technical analysis useful, please like & share our ideas with the community.
What do you think is more likely to happen? Please share your thoughts in comment section. And also give a thumbs up if you find this idea helpful. Any feedback & suggestions would help in further improving the analysis.
Good Luck!
Disclaimer!
This post does not provide financial advice. It is for educational purposes only! You can use the information from the post to make your own trading plan for the market. But you must do your own research and use it as the priority. Trading is risky, and it is not suitable for everyone. Only you can be responsible for your trading.

SBI trading setupOn 19/01/2022 we have seen strong bounce back from day's low.
On daily chart there is bullish engulfing pattern.
Buy above 520
Sl 500
Target 540, 560.

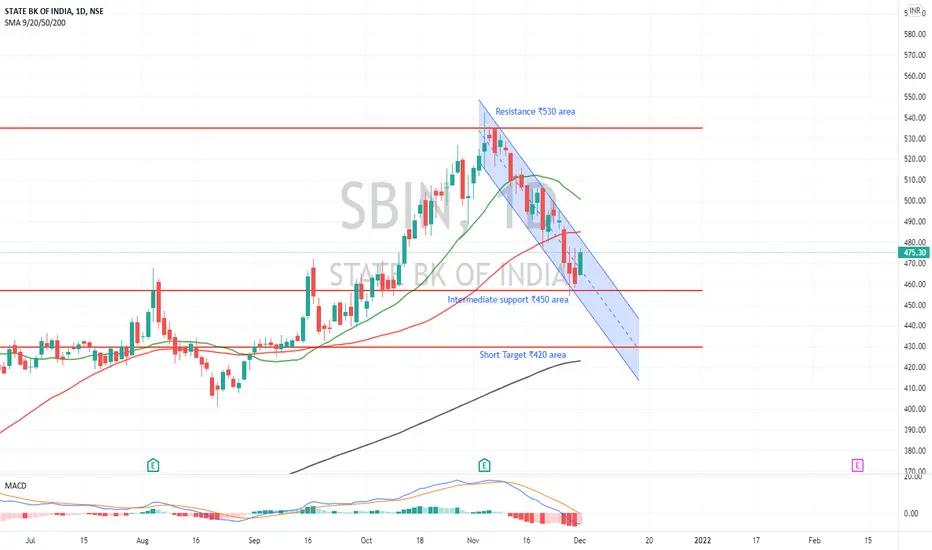
Short $SBIN CMP ₹475.30Short $SBIN CMP ₹475.30. Falling channel pattern. Stock price recently broke 50 SMA with volume. It may retest 50 SMA but MACD is showing no signs of positive volume so it may not be successful. Lowers lows on day chart. Intermediate support ₹450 area. Short term target is 200 SMA which is ₹420 area.
SBIN ANALYSIS - 11-JAN-2022 | Shall we go long in SBIN ???Hi Guys
Im bullish on SBIN, My target is 524.00
Reason for Buy
1. Trend line Breakout
2. Closed above Resistance level
Thank you

SBIN | Go long | Use the Pull Back.When it comes to SBIN , the stock is still in good uptrend. Last day market closed near 460 & likely to reach 464 soon. Though it is not a good idea to take the position right now since price is too far from previous support area and it is also expensive now. I think you might get a good pull back to get in. You could use the support area to get in when price falls. When market opens next day, if the price gaps down & break S1, make sure to go long from S2; which is a demand area. Once you are in, make sure to place the stop below the nearly support area .
If you find this technical analysis useful, please like & share our ideas with the community.
What do you think is more likely to happen? Please share your thoughts in comment section. And also give a thumbs up if you find this idea helpful. Any feedback & suggestions would help in further improving the analysis.
Good Luck!
Disclaimer!
This post does not provide financial advice. It is for educational purposes only! You can use the information from the post to make your own trading plan for the market. But you must do your own research and use it as the priority. Trading is risky, and it is not suitable for everyone. Only you can be responsible for your trading.

SBI Forming inverted H&S kind of pattern of 15 MTF. If It breaks downside my TGT will be 443/- but only if breaks downside and sustain

SBI Share Elliott wave analysis hello trader ,
as we can see SBIN is in correction phase and it is forming flat correction . so we can predict that SBIN will give good down move in coming days . btw this is the first and second move of SBIN .
1st move 470
2nd move 415 -420

SBIN| Good for go long | Get ready for a buyIf you find this technical analysis useful, please like & share our ideas with the community. Coming to the technical analysis of SBIN, I think we are going to see a gap down when market opens next day. That doesn’t mean price going to keep falling. Since we have a demand area as well as a support area near 464; where price gapped up, the price likely to get support there and bounce back to move upwards. So get ready to go long.
What do you think is more likely to happen? Please share your thoughts in comment section. And also give a thumbs up if you find this idea helpful. Any feedback & suggestions would help in further improving the analysis.
Good Luck!
Disclaimer!
This post does not provide financial advice. It is for educational purposes only! You can use the information from the post to make your own trading plan for the market. But you must do your own research and use it as the priority. Trading is risky, and it is not suitable for everyone. Only you can be responsible for your trading.

SBIN at demand zoneSBIN at demand zone
taken support form trendline
also taken RSI 40 support
about to breakout falling wedge triangle

SBIN looks good in the near short -termSBIN, if holds 500 in Monday's session, chances are high that it may test 510 levels.
Gap down opening below 500 would negate the above probability.

NSE:BCLIND formed Triangle patternNSE:BCLIND
#BCLIND trading @ 230 levels by forming triangle pattern.
Bouncing may result good momentum upside.
Good Above 237 with SL 226

BUY SBIN AROUND 432-433 TGT 465/520 SL BELOW 398It is making a morning star pattern and taking the support of 50 week moving average. Looks good for a short term buy, especially when the government is planning to speed up bad bank process, also the previous quarterly results were good and the stock didn't make any wild move yet.

state bank of indiaget ready for something big in sbin i think there will be a psu bank rally lets wait for breakout

SBIN - LONG setupThis has been my fav stock in the PSU banks space.
Chart looks great on both Weekly and Daily charts. At a very critical stage right now and at resistance zone. Nice strong candle for closing and firmly up at the resistance zone, but RSI on both Weekly and Daily charts bullish and no where near overbought zones.
200 daily MA below should be strong support and positive trending stock.
Keep an eye on the whole PSU space for action.

SBIN at bottom line of triangle good time to enter Taking support from 30min 44sma
at bottom of triangle /trendline
Bank nifty seesms breaking out
SBIN is in uptrend
15min RSI taken multiple support at 40

SBIN DAILY TIMEFRAMESNIPER STRATEGY
This magical strategy works like a clock on almost any charts
Although I have to say it can’t predict pullbacks, so I do not suggest this strategy for leverage trading.
It will not give you the whole wave like any other strategy out there but it will give you huge part of the wave.
The best timeframe for this strategy is Daily, Weekly and Monthly however it can work any timeframe above three minutes.
Start believing in this strategy because it will reward believers with huge profit.
There is a lot more about this strategy.
It can predict and also it can give you almost exact buy or sell time on the spot.
I am developing it even more so stay tuned and start to follow me for more signals and forecasts.

Buy SBIN - Positional- Cup and Handle PatternRefer chart for details
Positional Traders : Target 485
Short term to long term investors : Target 525

