AUDUSD - Bearish SharkWe have a potential Bearish Shark Pattern that is complete at 0.6466; for all trading patterns, a final chart confirmation is required.
What matters more to me in this setup is the 5-0Pattern completion. One of the side reasons is that the completion of the Bullish 5-0 Pattern happens within the Buy Zone.
Shark

AUDCAD - 5-0PatternThis trading setup is what matters. The 5-0Pattern setup that gives traders who are looking for a buying opportunity to engage the trade.

AUDCAD - Bearish SharkThis kind of trading setup often worries me. Consolidation before completion, could the shark pattern have missed it by a bit?
Let's see!

BTC, day timeframe, pessimisticBTC super pessimistic...
With downtrend that ends in April-May 23 below 7000.

BTC1....W= Bitcoin analysis on the weekly chart
The analysis is based on the harmonic analysis
= Shark model shape
= To complete the model, he must go down to level 11645..After that, the target of the model becomes level 25350
= The pattern remains successful unless the candles break the blue trend line to the top

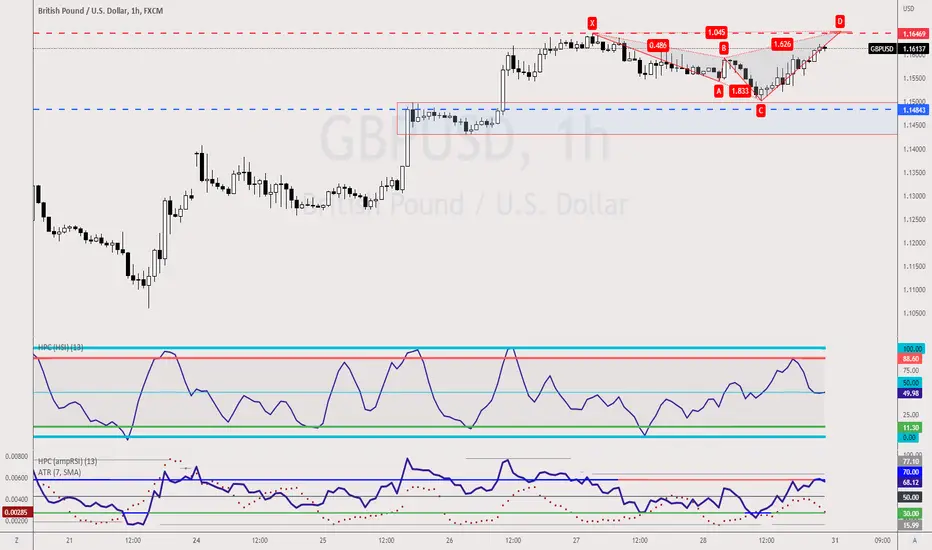
GBPUSD-Weekly Market Analysis-Nov22,Wk1A Bearish Shark Pattern completes at 1.1650 which coincide with my 4-hourly chart, sideway bounce setup, a classic trading setup that I've been trading on most of my trading life.
With that said, a candlestick pattern confirmation is still required.
SHARK - AS ABOVE, SO BELOWHello Traders, I am sharing this idea with you all not to give out directions to either sell or buy. You be judges of it. This is mainly for record purposes.
Personally, I think that shorting days are coming for this pair. So, the idea shows a Shark Patten - This came up because this aligns with previous analysis I did from Macro to Micro including Elliot Wave Count and Fibonacci Retracements.
Happy Trading.

AKSA
AKSA create postive SHARK Harmonic patern
by passing 68.85
T1 : 71.40 (1.HEDEF)
T2 : 73.90 (2.HEDEF)
STOP LOSS : 67.20
-----------------------------
This is not a recommendation. This is just an opinion, MAY BE right or wrong
GOOD LUCK for everbody

USOIL WTI M15 Bearish Shark Pattern Formation Sell under 86.84 USOIL WTI M15 TF Bearish Shark Pattern Formation Sell under 86.84, after target hit and breakout than wait for 2nd target. let's see the market condition...

XAUUSD H1 GOLD Bearish Shark Pattern FormationXAUUSD H1 GOLD Bearish Shark Pattern Formation, The gold will be down till 1st target if 1st target breakout than next target is 2nd target.

SUSHI 4H bullishSUSHI 4H is expected up to 1.59-1.62
- a big crab to be 1.62
- a small 113 shark to be 1.59
- a parallel channel is another resistance

ARG 4H BullishAGR 4H is ready for up:
- reversal header and shoulder; it is going to break the neck line
- 886 shark or bat is expected to be 5.3

Perfect automated detection of Shark & Nenstar PRZ - ShortA bearish-type Shark pattern occurred.
If the price rises to 0.99423, a bearish-type Nenstar pattern could occur.
Short after seeing the rebound.
*Harmonic patterns are automatically detected using the indicators below.
- Harmonic auto-detect PRO

BTC short-term scenario
Hi all,
I have been trying to find a scenario that would answer to the question spinning in my head. Let me explain it.
BTC lost the "Weekly trendline 1" and I suppose that the prices need to touch the next lower one, the "Weekly Trendline 0", at some time. This has not happened yet. My question is "how and when"?
I'm still thinking that we are in accumulation phase (with a certain probability) as with my Wyckoff analyses. Following these analyes, the next event to realize is that BTC needs to retest the upper resistance, around $23000.
By linking these thoughts, I use "Shark" harmonic pattern to simulate a possible scenario, as you can see in chart.
I admit that in short-term this is a bullish scenario. As always, we should prepare for a bearish one (like what happened in the end of 2018) for which I'll do a further analysis.
Have a nice sunday!

GBPUSD-Weekly Market Analysis-Oct22,Wk4GBPUSD has a completed Bearish Shark Pattern, which does not necessarily mean you have missed the trade. You could wait for a retest of the Shark Pattern at 1.1388

Hourly Bearish Shark on Ethereum ETH recently hit profit taking targets of a Bearish Deep Gartley and it has now come back up a decent amount and formed a Potential Bearish Shark. This time i'd expect ETH to Fully Square Up the Range and really give us a nice down move if this Shark starts to play out.

EURUSD - 5-0 PatternAs you know, the Shark Pattern can move. That makes it the most dangerous harmonic patterns of all, but also the most rewarding ones.

EURUSD - 5-0PatternWell, if you guys are aware, I do not usually post an analysis based on M15 timeframe, but this setup is worth watching. The distance between the red and blue line is 43pips, substantial profit between the 2 levels.
On the red dotted line, come the completion of the Bearish Shark Pattern and the blue dotted line, Bullish 5-0 Pattern.
Candlestick Pattern confirmation is required before one consider it as an trading ideas.
p/s do your own analysis and never follow blindly

EURCHF: Bearish Skart at ResistanceIf you ignore the wick we got on the 22nd, we have a near perfect looking Bearish Shark on the 4 Hour with the PCZ lining up with the top of the Daily Range and some 4 Hour RSI Bearish Divergence.
I think it could later setup to be a Bullish 5-0 where it would Bullishly Continue up after making a 50%-61.8% Retrace from Low to High.

Neblio (NEBL) coin formed bullish Shark for upto 46.50% pumpHi friends, hope you are well, and welcome to the new update on Neblio (NEBL) coin with US Dollar pair.
Previously we caught a nice pump of NEBL as below:
Now on a daily time frame, NEBL has formed a bullish Shark pattern.
Note: Above idea is for educational purpose only. It is advised to diversify and strictly follow the stop loss, and don't get stuck with trade

SOLUSD: Bullish Shark Looking For A Minimum 50% RetraceThere are alot of reasons to think it could go up even higher based off the much bigger Shark and Butterfly zoomed out to the left but for the day trader my focus is on this smaller local Shark with a target at around $40

GBPAUD - Bearish Shark RetestOn the 4-hourly chart, we have a retest at the resistance level with an RSI Divergence.
The strategy that I plan to involve myself with in the trade is through the Bearish Shark Pattern setup that completes at 1.8065.
I've taken this trade with an aggressive approach. Trade engaged at 1.8040.

Ethereum Analyze (Short term,10/15/2022))!!!Ethereum is running in a support zone where we can find the end of wave C in there.
I expect Ethereum can go up at least to trend line.
Ethereum Analyze ( ETHUSDT ) Timeframe 15min⏰(Log Scale).
Do not forget to put Stop loss for your positions (For every position you want to open).
Please follow your strategy, this is just my idea, and I will be glad to see your ideas in this post.
Please do not forget the ✅' like '✅ button 🙏😊 & Share it with your friends; thanks, and Trade safe.
