BTCUSD M30 BULLISH SHARK PATTERNHello traders. I see SHARK pattern on BTCUSD M30 chart. Good luck everybody.
Shark

BTCUSD H1 POTENTIAL SHARK OR CYPHER PATTERN AND RSI DIVERGENCEHello traders. I see a potential shark or cypher pattern and RSI divergence on the BTC USD H1 chart. It could be a failed c wave. This scenario can happen if wave c fibo inversion fails to exceed 1.13 and 1.272 and the falling trendline is broken.

USDCAD H4 BULLISH SHARK PATTERNHello traders. I see SHARK pattern on USDCAD H4 chart. Good luck everybody.


SPY Bullish PatternSPY formed a bullish Shark pattern on 15 min, PT's are very close and might be achieved in pre market

SPLKLONG-TERM: Bullish shark, bounced off historical support, classic bullish divergence on 4hr and daily RSI, 4hr inverse head & shoulders. (not financial advice)

AUDNZD SHORTSCould be looking for a potential entry at 1.0625 with a 25 pip stoploss.
Manually exiting my position if price closes on the 4H timeframe above 1.0633
Look to move your stoploss to breakeven once price reaches 1.0520
Trade Safe 🥂

XAUUSD H1 BEARISH SHARK PATTERN AND RSI DIVERGENCEHello traders. I see SHARK pattern and RSI divergence on XAUUSD H1 chart. Good luck everybody.

BTCUSD BULLISH SHARK PATTERNHello traders. I see SHARK pattern on BTCUSD H1 chart. Good luck everybody.

XAUUSD H4 POTENTIAL SHARK PATTERN AND RSI DIVERGENCEHello traders. I see potential shark pattern on XAUUSD H4 chart. I'm guessing that wave c failed and could not breakout. In this case, I predict that it will descend into the demand zones below with a counter impulsive wave. I see RSI divergence in wave c.

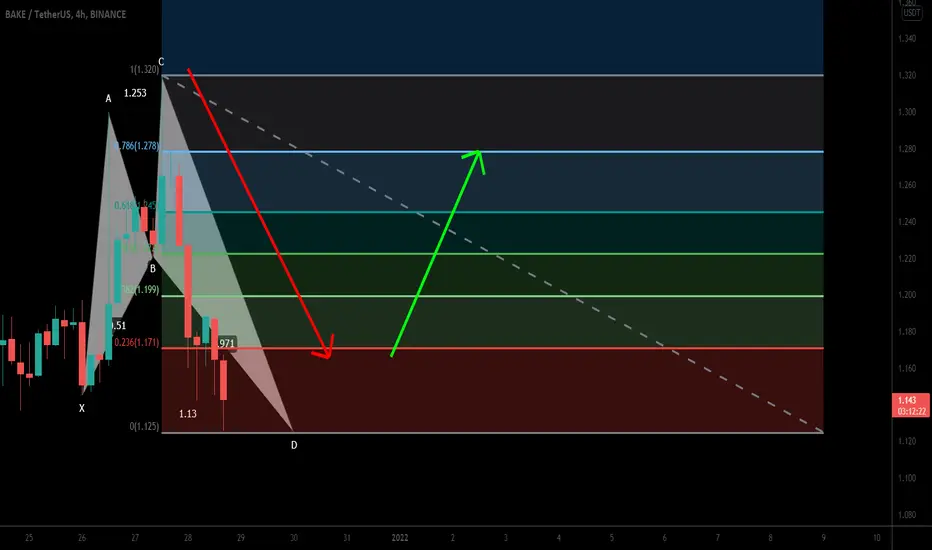
BakeryToken (BAKE) formed harmonic Shark for upto 13% moveHi dear friends, hope you are well and welcome to the new trade setup of BakeryToken (BAKE)
On a 4-hr time frame chart, BAKE has formed a bullish Shark pattern.
Bitcoin (BTC) formed bullish Shark | A good long opportunityHi friends, hope you are well and welcome to the new trade setup of Bitcoin (BTC)
Now on a 4-hr time frame chart, BTC has formed a bullish Shark pattern.
Buying and sell targets:
Buy between: $48363 to $47414
Sell between: $49212 to $51114
Stop loss:
Below: $47414
Possible profit and loss ratio:
As per the above targets, this trade has a profit possibility of up to 7.5%, and the loss possibility is 2%.
Note: Above idea is for educational purpose only. It is advised to diversify and strictly follow the stop loss, and don't get stuck with trade

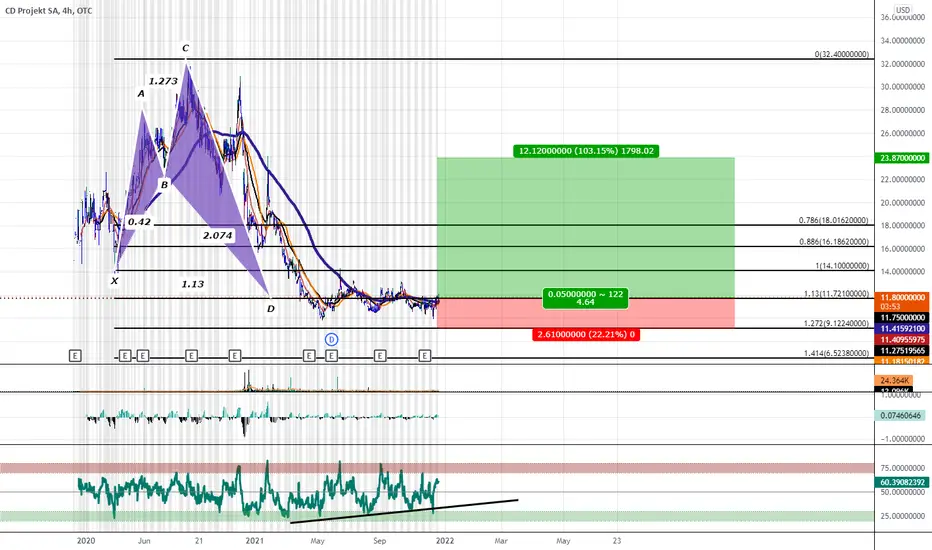
CD Projekt; Bullish Shark: Many Instances of Bullish DivergenceWe have been at this PCZ for awhile and showing many instances of bullish divergence now we can see that many of the moving averages have converged and it seems that we will be getting a golden cross pretty soon now may be the time for this game dev to rise once more.