Shiba is Bullish- LONGShiba has been long since BTC first hit the 45k range. Unbelievable price movement. But better to bet that long than short. Shiba is known for long greens and upsets... these moves are no difference. It's a spot trade, but I am still holding a confident long. Once shib leaves 0.000027 again we will have enough support to get past the 0.000032 range. Sky is the limit. Watch for updates. Happy trading. It is Easter weekend so watch for random dips. Buy Buy Buy...
Shibusdtanalysis

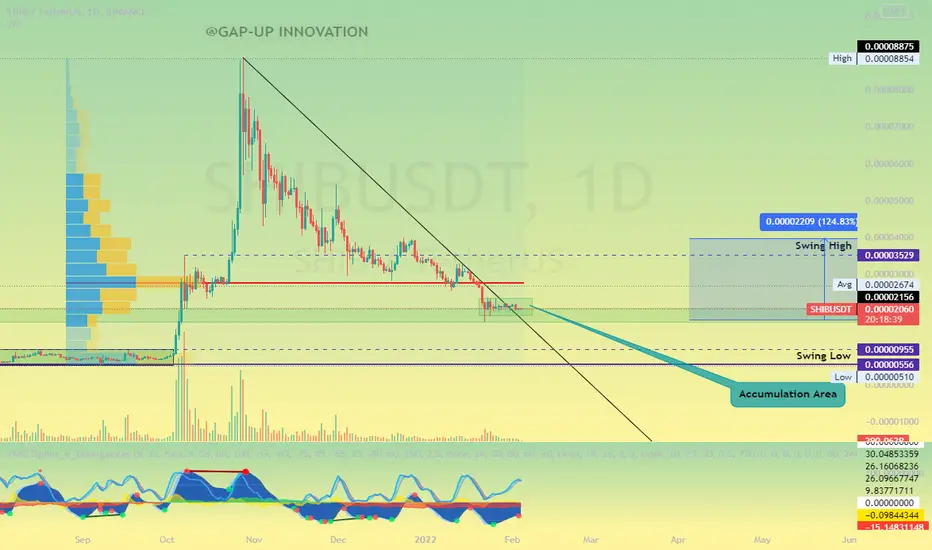
SHIBUSDT Analysis (LOCAL VISION)Hello friends.
Please support my work by clicking the LIKE button👍(If you liked). Also i will appreciate for ur activity. Thank you!
Everything on the chart.
Entry: market and lower
Target: 0.00003 - 0.00004 - 0.000052
after first target reached move ur stop to breakeven
Stop: 0.000019 (depending of ur risk). ALWAYS follow ur RM .
Risk/Reward: 1 to 6
risk is justified
Good luck everyone!
Follow me on TRADINGView, if you don't want to miss my next analysis or signals.
It's not financial advice.
Dont Forget, always make your own research before to trade my ideas!
Open to any questions and suggestions.


SHIB/USD LongInto support on higher timeframe.
Target is a moving average so will be adjusted over time.
1:1 RR

SHIB/USDT BRACKOUT! READY TO PUMP 100%!Hi guys, This is CryptoMojo, One of the most active trading view authors and fastest-growing communities.
Do consider following me for the latest updates and Long /Short calls on almost every exchange.
I post short mid and long-term trade setups too.
Let’s get to the chart!
I have tried my best to bring the best possible outcome in this chart, Do not consider it as financial advice.
#LONG
SHIB/ BTC breakout this BULLISH TRIANGLE pattern.
ENTRY: CMP ( CURRENT MARKET PRICE )
and add up to $0.0000263
SELL- 100%
STOP LOSS: $0.00002
This chart is likely to help you in making better trade decisions if it did consider upvoting this chart.
Would also love to know your charts and views in the comment section.
Thank you

SHIBUSDT LONG POSITION i see there is good volume to bush the price to up, targeting the mention levels in the chart

SHIB BULLSSHIB reversed at a demand level with a confirmation of BOS; a tap back into OB that BOS will provide us a good entry to long.
Find entry, sl n tp in TA.
Trade safe.
NB: Patience + Risk management = Winning trades
#shib #e2kclicks

SHIB MORE GAINS COMINGif you like my ideas please follow me and give a like & Comment to the idea. here is what I think about SLP /USDT that it goes to the mentioned targets in Green straight lines.

Shiba Long- Spot Trade I like Shiba in this range. Volume says yes and we are in a time of new beginnings after the full moon.
Thinking this will rekt a lot of shorts.
It's a spot trade so what your shit. 0.00002250 is my long. Curious.... this is a contrarian bet.

SHIB IS READY FOR BREAKOUT Hi guys, This is CryptoMojo, One of the most active tradingview authors and fastest-growing communities.
Do consider following me for the latest updates and Long /Short calls on almost every exchange.
I post short mid and long term trade setups too.
Let’s get to the chart!
I have tried my best to bring the best possible outcome in this chart, Do not consider it as financial advice.
SHIB is making this big fly pattern.
Entry- $0.000022 - $0.0000223
TARGET- 45%
LEVERAGE- 5X
SL- $0.0000215
This chart is likely to help you in making better trade decisions, if it did do consider upvoting this chart.
Would also love to know your charts and views in the comment section.
Thank you

SHIB, what will happen after the breakdown of the trend line?Hi guys, This is CryptoMojo, One of the most active trading view authors and fastest-growing communities.
Do consider following me for the latest updates and Long /Short calls on almost every exchange.
I post short mid and long-term trade setups too.
Let’s get to the chart!
I have tried my best to bring the best possible outcome in this chart, Do not consider it as an
According to this 2days chart, SHIB is making this huge bull flag.
Entry range:- $0.000020-$0.000021
Target:- 1000%
SL:- If any 2days candle close below $0.000019
This chart is likely to help you in making better trade decisions, if it did do consider upvoting this chart.
Would also love to know your charts and views in the comment section.
Thank you


Is SHIB about to break out?I love to trade SHIB. Though my ideas don't always pan out, practicing good risk management can make this a lot of fun even when you're wrong. Leave a comment if you feel so inclined!
fair warning: I'm an ape and you shouldn't listen to anything i say. ever.

SHIB INU SHIBUSDT Next Move Bullish Flag Formation?!It appears to be a bullish flag formation with resistance at 0.000035 level after breaking this level next target of shibusdt should be 0.000049. On smaller time frame local support is at 0.000027

SHIBUSD | Potential Uptrend. Get in!If you find this technical analysis useful, please like & share our ideas with the community.
What do you think is more likely to happen? Please share your thoughts in comment section. And also give a thumbs up if you find this idea helpful. Any feedback & suggestions would help in further improving the analysis.
Good Luck!
Disclaimer!
This post does not provide financial advice. It is for educational purposes only! You can use the information from the post to make your own trading plan for the market. But you must do your own research and use it as the priority. Trading is risky, and it is not suitable for everyone. Only you can be responsible for your trading.

SHIBMaybe it's time to buy altcoins and i think SHIB is a good coin to buy. It has a deep correction and it can grows from here.

SHIB USD - SHIB DEFYING the crowd FED Watch 2 - 22I love this coin just because of the idea that it represents the base value of belief. If it breaks away from the pack i think it will act as a catalyst. Watching closely

SHIBUSDTUpward trend isstarted. Go to the moon.
TP1: 0.000039 USDT
TP2: 0.000054 USDT
TP3: 0.000087 USDT

SHIBA CUP & HANDLE- TO RISE BY 300% TO $0.0001Please support this idea with a LIKE👍 if you find it useful🥳
Not a financial advice🙅🏼♂️
As highlighted on this chart, we have a cup and handle pattern formation on this chart followed by a falling wedge pattern that reflection the correction that happened.
Another confirmation right here is that price broke out of the falling wedge and it’s in a new trend to the upside.
What do you think?
Share your opinion in the comment section✍️
Follow me to receive more updates on SHIBA INU (SHIBUSDT ) 🤗
Happy Trading💰🥳🤗

SHIBUSDT AnalysisHello friends.
Please support my work by clicking the LIKE button👍(If you liked). Also i will appreciate for ur activity. Thank you!
Everything on the chart.
Almost nothing has changed from my last analysis. We falled a little bit lower than i expect earlier.
I've thought the we will see some retracement and continue to growth.
Entry: market and lower
Target: 0.000035 and 0.00005 (and maybe even 0.00006 but w/o me)
after first target reached move ur stop to breakeven
Stop: ~0.000017 (depending of ur risk). ALWAYS follow ur RM .
Risk/Reward: 1 to 6
risk is justified
Good luck everyone!
Follow me on TRADINGView, if you don't want to miss my next analysis or signals.
It's not financial advice.
Dont Forget, always make your own research before to trade my ideas!
Open to any questions and suggestions.

SHIBUSD 2022 Buy OR SELL Signal FORECAST NEXT DALLY TREND CHARTSHIBUSD 2022 Buy OR SELL Signal FORECAST NEXT DALLY TREND CHART
Today I will publish signals from our trading team for SHIB .
Shiba have accumulation in range zone 2000-2200 sat.
I think soon we will see shiba pump at least for 50% upward to levels 3000-3300 sat.
If you like this analysis, smash the "like button" and leave a comment below to share your thoughts
or let me know what crypto you want to see!
Trading is a reflection of yourself. Learn more daily and be ready for every opportunity.
Have a nice trading!
SHIB is moving in a bearish triangle pattern, What's next goal?As you can see on the chart, Shiba is moving in a big bearish triangle pattern for about 10 Days!
What we expect from Shiba and what is the next move, Is dependent on the market & Bitcoin situation, I'm still bearish on BTC, You can see my last analysis on that coin.
Now for Shiba, I expect to see a little sideway movement and then a breakout from the downside of the triangle.
In this case, The next target is major support which I have drawn oh the chart. Although there is a possibility of breaking this triangle from above, but I prefer to consider a small probability for it.
