USDJPY: Expecting Bullish Continuation! Here is Why:
Our strategy, polished by years of trial and error has helped us identify what seems to be a great trading opportunity and we are here to share it with you as the time is ripe for us to buy USDJPY.
Disclosure: I am part of Trade Nation's Influencer program and receive a monthly fee for using their TradingView charts in my analysis.
❤️ Please, support our work with like & comment! ❤️
Short

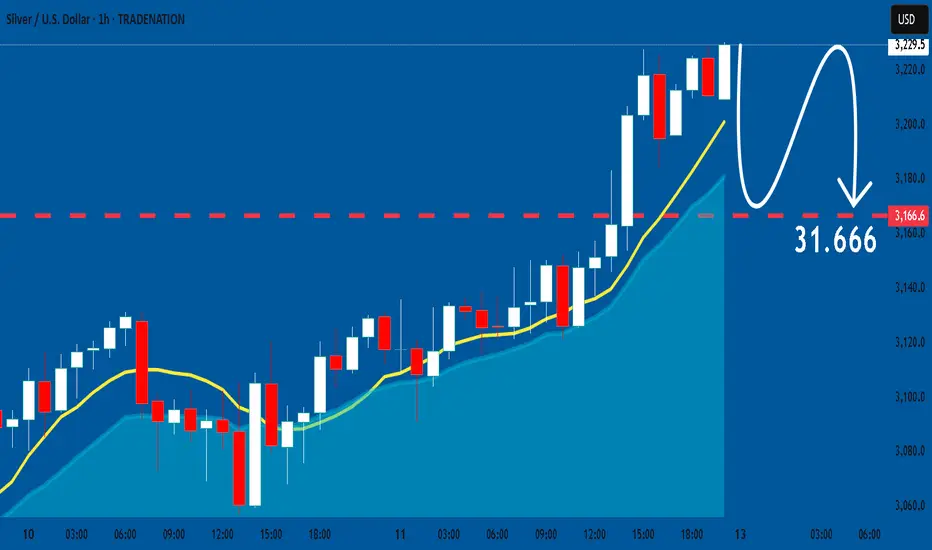
SILVER: Bearish Forecast & Bearish Scenario
It is essential that we apply multitimeframe technical analysis and there is no better example of why that is the case than the current SILVER chart which, if analyzed properly, clearly points in the downward direction.
Disclosure: I am part of Trade Nation's Influencer program and receive a monthly fee for using their TradingView charts in my analysis.
❤️ Please, support our work with like & comment! ❤️
GBPUSD What Next? SELL!
My dear followers,
I analysed this chart on GBPUSD and concluded the following:
The market is trading on 1.3089 pivot level.
Bias - Bearish
Technical Indicators: Both Super Trend & Pivot HL indicate a highly probable Bearish continuation.
Target - 1.2979
About Used Indicators:
A super-trend indicator is plotted on either above or below the closing price to signal a buy or sell. The indicator changes color, based on whether or not you should be buying. If the super-trend indicator moves below the closing price, the indicator turns green, and it signals an entry point or points to buy.
Disclosure: I am part of Trade Nation's Influencer program and receive a monthly fee for using their TradingView charts in my analysis.
———————————
WISH YOU ALL LUCK

1INCH Rectangle Downside BreakoutLast week, BINANCE:1INCHUSDT fully confirmed a downside breakout from a multi-year rectangle.
If $0.20 isn't reclaimed soon, there is a good chance that the token will head to the $0.06 rectangle target.
Worth watching it, as a failed retest of $0.20 could offer a very good short opportunity, while a sustained daily close above it would invalidate the setup and possibly lead to a retest of $0.45 or even $0.70.

DXY Will Fall! Short!
Here is our detailed technical review for DXY.
Time Frame: 1D
Current Trend: Bearish
Sentiment: Overbought (based on 7-period RSI)
Forecast: Bearish
The market is trading around a solid horizontal structure 99.769.
The above observations make me that the market will inevitably achieve 96.117 level.
P.S
Please, note that an oversold/overbought condition can last for a long time, and therefore being oversold/overbought doesn't mean a price rally will come soon, or at all.
Disclosure: I am part of Trade Nation's Influencer program and receive a monthly fee for using their TradingView charts in my analysis.
Like and subscribe and comment my ideas if you enjoy them!

GBP/USD BEST PLACE TO SELL FROM|SHORT
Hello, Friends!
The BB upper band is nearby so GBP/USD is in the overbought territory. Thus, despite the uptrend on the 1W timeframe I think that we will see a bearish reaction from the resistance line above and a move down towards the target at around 1.287.
Disclosure: I am part of Trade Nation's Influencer program and receive a monthly fee for using their TradingView charts in my analysis.
✅LIKE AND COMMENT MY IDEAS✅

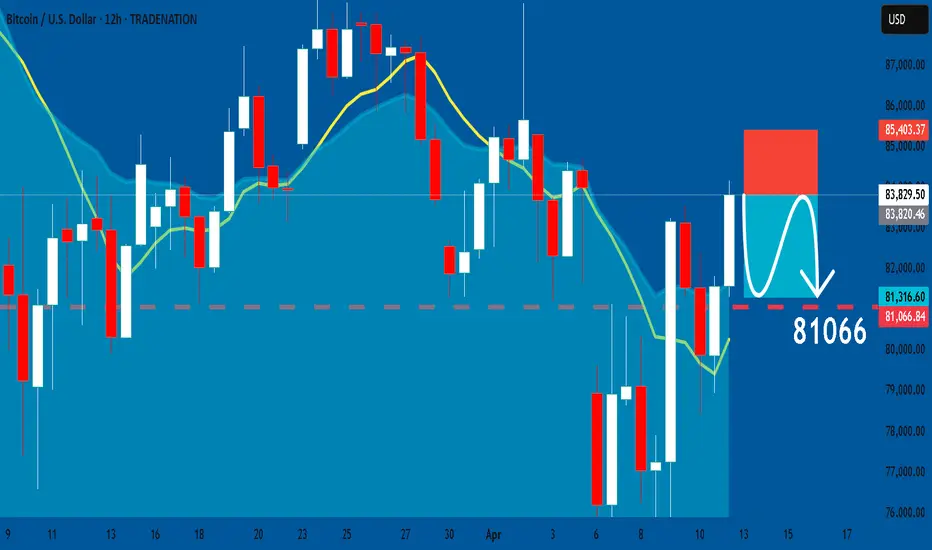
BTCUSD: Bearish Continuation & Short Signal
BTCUSD
- Classic bearish pattern
- Our team expects retracement
SUGGESTED TRADE:
Swing Trade
Sell BTCUSD
Entry - 83829
Stop - 85403
Take - 81066
Our Risk - 1%
Start protection of your profits from lower levels
Disclosure: I am part of Trade Nation's Influencer program and receive a monthly fee for using their TradingView charts in my analysis.
❤️ Please, support our work with like & comment! ❤️
EURCAD: Short Trading Opportunity
EURCAD
- Classic bearish setup
- Our team expects bearish continuation
SUGGESTED TRADE:
Swing Trade
Short EURCAD
Entry Point - 1.5748
Stop Loss - 1.5828
Take Profit - 1.5595
Our Risk - 1%
Start protection of your profits from lower levels
Disclosure: I am part of Trade Nation's Influencer program and receive a monthly fee for using their TradingView charts in my analysis.
❤️ Please, support our work with like & comment! ❤️

AUDUSD: Expecting Bearish Movement! Here is Why:
The analysis of the AUDUSD chart clearly shows us that the pair is finally about to tank due to the rising pressure from the sellers.
Disclosure: I am part of Trade Nation's Influencer program and receive a monthly fee for using their TradingView charts in my analysis.
❤️ Please, support our work with like & comment! ❤️

EURUSD: Weak Market & Bearish Continuation
Looking at the chart of EURUSD right now we are seeing some interesting price action on the lower timeframes. Thus a local move down seems to be quite likely.
Disclosure: I am part of Trade Nation's Influencer program and receive a monthly fee for using their TradingView charts in my analysis.
❤️ Please, support our work with like & comment! ❤️

USOIL Set To Fall! SELL!
My dear friends,
Please, find my technical outlook for USOIL below:
The price is coiling around a solid key level - 61.43
Bias - Bearish
Technical Indicators: Pivot Points Low anticipates a potential price reversal.
Super trend shows a clear sell, giving a perfect indicators' convergence.
Goal - 60.40
About Used Indicators:
The pivot point itself is simply the average of the high, low and closing prices from the previous trading day.
Disclosure: I am part of Trade Nation's Influencer program and receive a monthly fee for using their TradingView charts in my analysis.
———————————
WISH YOU ALL LUCK

HelenP. I After strong impulse up, BTC can start to declineHi folks today I'm prepared for you Bitcoin analytics. BTC has recently shown a strong recovery after reaching the support zone between 77000 and 76200 points. This area had already acted as a base twice in the past, and the price once again reacted from it with a sharp bullish impulse. The rise brought Bitcoin back into the resistance zone between 83500 and 84300 points - a level that has proven significant in the past. At the same time, BTC approached the descending trend line that forms the upper boundary of the wedge pattern visible on the chart. The reaction from this confluence zone was immediate. The price got rejected right at the intersection of the trend line and resistance zone, forming a clear rejection candle and showing weakness from buyers. This area is now holding Bitcoin down once again and proving itself as a strong supply zone. At the moment, BTC is trading below the trend line and under pressure from resistance. Given the recent price action, multiple rejections from the same zone, and position relative to the wedge, I expect Bitcoin to decline again toward 78000 points - my current goal. If you like my analytics you may support me with your like/comment ❤️

EURAUD Will Go Down! Sell!
Here is our detailed technical review for EURAUD.
Time Frame: 1D
Current Trend: Bearish
Sentiment: Overbought (based on 7-period RSI)
Forecast: Bearish
The market is approaching a significant resistance area 1.804.
Due to the fact that we see a positive bearish reaction from the underlined area, I strongly believe that sellers will manage to push the price all the way down to 1.720 level.
P.S
Overbought describes a period of time where there has been a significant and consistent upward move in price over a period of time without much pullback.
Disclosure: I am part of Trade Nation's Influencer program and receive a monthly fee for using their TradingView charts in my analysis.
Like and subscribe and comment my ideas if you enjoy them!

BITCOIN BEARS ARE STRONG HERE|SHORT
BITCOIN SIGNAL
Trade Direction: short
Entry Level: 83,826.61
Target Level: 79,330.33
Stop Loss: 86,817.52
RISK PROFILE
Risk level: medium
Suggested risk: 1%
Timeframe: 3h
Disclosure: I am part of Trade Nation's Influencer program and receive a monthly fee for using their TradingView charts in my analysis.
✅LIKE AND COMMENT MY IDEAS✅

EUR/USD SHORT FROM RESISTANCE
Hello, Friends!
Previous week’s green candle means that for us the EUR/USD pair is in the uptrend. And the current movement leg was also up but the resistance line will be hit soon and upper BB band proximity will signal an overbought condition so we will go for a counter-trend short trade with the target being at 1.118.
Disclosure: I am part of Trade Nation's Influencer program and receive a monthly fee for using their TradingView charts in my analysis.
✅LIKE AND COMMENT MY IDEAS✅

EURCAD A Fall Expected! SELL!
My dear subscribers,
This is my opinion on the EURCAD next move:
The instrument tests an important psychological level 1.5572
Bias - Bearish
Technical Indicators: Supper Trend gives a precise Bearish signal, while Pivot Point HL predicts price changes and potential reversals in the market.
Target - 1.5508
About Used Indicators:
On the subsequent day, trading above the pivot point is thought to indicate ongoing bullish sentiment, while trading below the pivot point indicates bearish sentiment.
Disclosure: I am part of Trade Nation's Influencer program and receive a monthly fee for using their TradingView charts in my analysis.
———————————
WISH YOU ALL LUCK

AUDUSD Technical Analysis! SELL!
My dear friends,
My technical analysis for AUDUSD is below:
The market is trading on 0.6377 pivot level.
Bias - Bearish
Technical Indicators: Both Super Trend & Pivot HL indicate a highly probable Bearish continuation.
Target - 0.6324
Recommended Stop Loss - 0.6403
About Used Indicators:
A pivot point is a technical analysis indicator, or calculations, used to determine the overall trend of the market over different time frames.
Disclosure: I am part of Trade Nation's Influencer program and receive a monthly fee for using their TradingView charts in my analysis.
———————————
WISH YOU ALL LUCK

GBPUSD: Short Trade Explained
GBPUSD
- Classic bearish formation
- Our team expects fall
SUGGESTED TRADE:
Swing Trade
Sell GBPUSD
Entry Level - 1.3065
Sl - 1.3132
Tp - 1.2929
Our Risk - 1%
Start protection of your profits from lower levels
Disclosure: I am part of Trade Nation's Influencer program and receive a monthly fee for using their TradingView charts in my analysis.
❤️ Please, support our work with like & comment! ❤️

NZDUSD Will Collapse! SELL!
My dear subscribers,
My technical analysis for NZDUSD is below:
The price is coiling around a solid key level - 0.5786
Bias - Bearish
Technical Indicators: Pivot Points Low anticipates a potential price reversal.
Super trend shows a clear sell, giving a perfect indicators' convergence.
Goal - 0.5710
My Stop Loss - 0.5830
About Used Indicators:
By the very nature of the supertrend indicator, it offers firm support and resistance levels for traders to enter and exit trades. Additionally, it also provides signals for setting stop losses
Disclosure: I am part of Trade Nation's Influencer program and receive a monthly fee for using their TradingView charts in my analysis.
———————————
WISH YOU ALL LUCK

EURJPY: Bears Will Push
Remember that we can not, and should not impose our will on the market but rather listen to its whims and make profit by following it. And thus shall be done today on the EURJPY pair which is likely to be pushed down by the bears so we will sell!
Disclosure: I am part of Trade Nation's Influencer program and receive a monthly fee for using their TradingView charts in my analysis.
❤️ Please, support our work with like & comment! ❤️

GOLD: Bearish Continuation & Short Trade
GOLD
- Classic bearish formation
- Our team expects pullback
SUGGESTED TRADE:
Swing Trade
Short GOLD
Entry - 3232.2
Sl - 3244.7
Tp - 3208.5
Our Risk - 1%
Start protection of your profits from lower levels
Disclosure: I am part of Trade Nation's Influencer program and receive a monthly fee for using their TradingView charts in my analysis.
❤️ Please, support our work with like & comment! ❤️

EURUSD Buyers In Panic! SELL!
My dear friends,
My technical analysis for EURUSD is below:
The market is trading on 1.1355 pivot level.
Bias - Bearish
Technical Indicators: Both Super Trend & Pivot HL indicate a highly probable Bearish continuation.
Target - 1.1173
About Used Indicators:
A pivot point is a technical analysis indicator, or calculations, used to determine the overall trend of the market over different time frames.
Disclosure: I am part of Trade Nation's Influencer program and receive a monthly fee for using their TradingView charts in my analysis.
———————————
WISH YOU ALL LUCK

HelenP. I Euro will decline to support zone, breaking trend lineHi folks today I'm prepared for you Euro analytics. After breaking out from a long consolidation phase, the Euro entered a strong upward trend supported by a clearly defined trend line. This breakout was backed by strong momentum, allowing the price to push above Support 1 and climb rapidly. However, after reaching the 1.1450 area, bullish strength started fading. The market printed a sharp rejection from the highs, and soon after, the price broke back below the trend line. This breakdown signals a shift in sentiment. The price is now approaching the previous support zone between 1.1160 and 1.1120 points, which acted as a key accumulation area during the bullish move. The reaction from this zone will be crucial, but considering the breakdown from the trend line and the aggressive rejection from the top, sellers now appear to be in control. Currently, EUR is trading below the broken trend line, and bearish pressure continues to build. Given the rejection from higher levels, structure break, and weak recovery attempts, I expect EURUSD to decline toward my current goal at 1.1160 points. If you like my analytics you may support me with your like/comment ❤️
