HelenP. I Bitcoin may rebound from resistance zone and fall moreHi folks today I'm prepared for you Bitcoin analytics. After a strong rejection from the second resistance zone between 86700 and 87900 points, Bitcoin lost its bullish momentum. The price attempted to hold within the range but failed to break above the trend line, which has consistently acted as dynamic resistance. This trend line marked the turning point once again, pushing BTC down with increased selling pressure. The price then sharply declined, breaking below the first resistance zone between 78200 and 79500, which is now acting as resistance. This level was previously tested multiple times, making it a key barrier. After breaching this zone, the price dropped even lower and reached the 77000 area, where it found temporary support and began a minor bounce. Currently, Bitcoin is trading just below the resistance zone and remains under the trend line. Sellers are still in control, and the recent bounce looks weak compared to the prior impulse down. Given the rejection from resistance, the position relative to the trend line, and continued bearish pressure, I expect BTC to resume its decline toward 70000 points, which is also my goal. If you like my analytics you may support me with your like/comment ❤️
Short

GBPNZD: Bearish Continuation
The charts are full of distraction, disturbance and are a graveyard of fear and greed which shall not cloud our judgement on the current state of affairs in the GBPNZD pair price action which suggests a high likelihood of a coming move down.
Disclosure: I am part of Trade Nation's Influencer program and receive a monthly fee for using their TradingView charts in my analysis.
❤️ Please, support our work with like & comment! ❤️

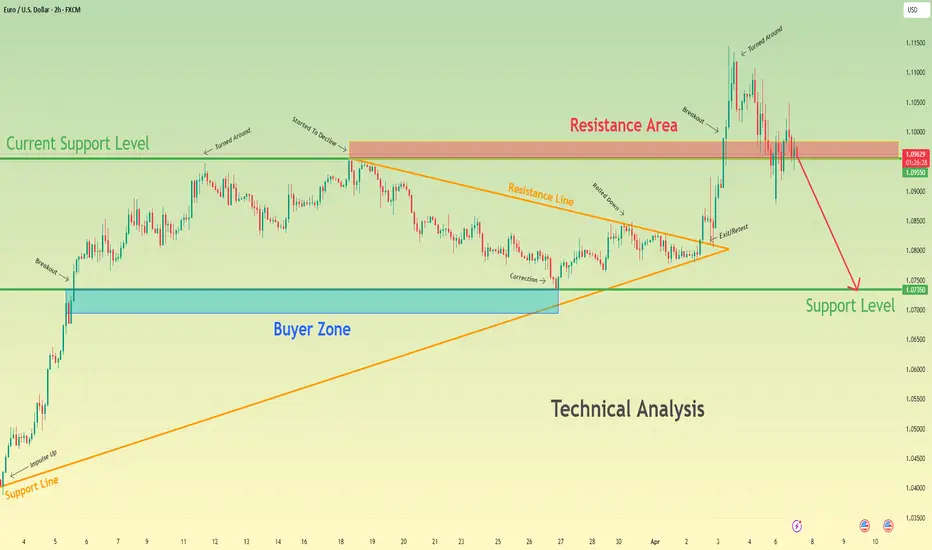
Euro will break current support level and drop to 1.0735 levelHello traders, I want share with you my opinion about Euro. Recently, the price completed a pennant pattern, which resulted in a breakout to the upside. This breakout, however, didn’t gain much ground - the movement quickly lost momentum inside the resistance area between 1.0955 - 1.0985 points, where Euro sharply turned around. The reversal from this zone wasn’t unexpected, considering this level had already acted as resistance earlier. What followed was a clean break below the current support level at 1.0955 points, which shifted the market structure back to bearish. Now the price is trading lower, and the bearish impulse looks set to continue. My expectation is a further decline toward the support level at 1.0735, which also aligns with the buyer zone between 1.0695 - 1.0735 points. This level may act as the next potential area of interest where buyers could attempt a defence. The invalidation of local support, weakness after the breakout, and strong supply reaction from resistance all point to a high probability of continuation down toward TP 1 - 1.0735 level. Please share this idea with your friends and click Boost 🚀
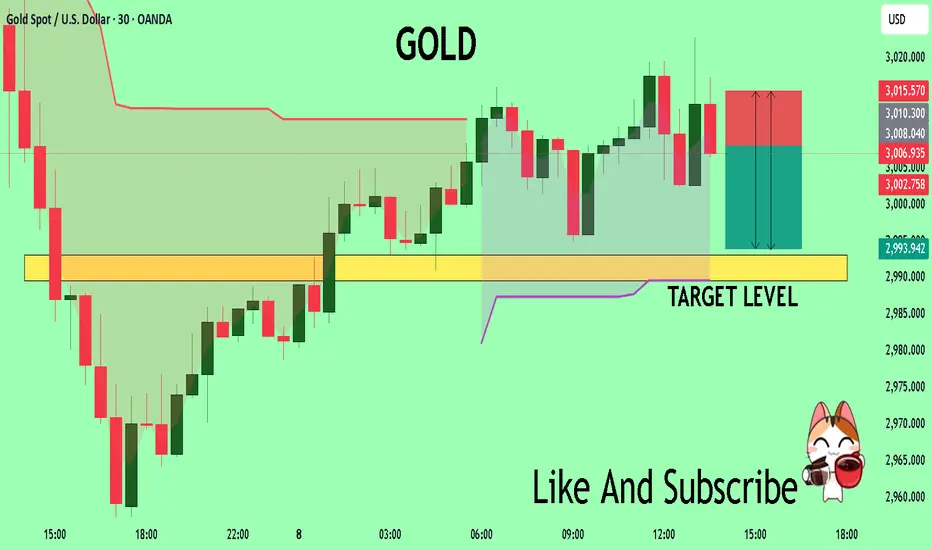
GOLD: Short Signal with Entry/SL/TP
GOLD
- Classic bearish pattern
- Our team expects retracement
SUGGESTED TRADE:
Swing Trade
Sell GOLD
Entry - 3044.0
Stop - 3051.7
Take - 3027.6
Our Risk - 1%
Start protection of your profits from lower levels
Disclosure: I am part of Trade Nation's Influencer program and receive a monthly fee for using their TradingView charts in my analysis.
❤️ Please, support our work with like & comment! ❤️

USD/CHF BEARS WILL DOMINATE THE MARKET|SHORT
Hello, Friends!
USD/CHF pair is in the downtrend because previous week’s candle is red, while the price is obviously rising on the 2H timeframe. And after the retest of the resistance line above I believe we will see a move down towards the target below at 0.846 because the pair is overbought due to its proximity to the upper BB band and a bearish correction is likely.
Disclosure: I am part of Trade Nation's Influencer program and receive a monthly fee for using their TradingView charts in my analysis.
✅LIKE AND COMMENT MY IDEAS✅

GOLD My Opinion! SELL!
My dear friends,
Please, find my technical outlook for GOLD below:
The instrument tests an important psychological level 3007.7
Bias - Bearish
Technical Indicators: Supper Trend gives a precise Bearish signal, while Pivot Point HL predicts price changes and potential reversals in the market.
Target - 2993.1
Recommended Stop Loss - 3015.5
About Used Indicators:
Super-trend indicator is more useful in trending markets where there are clear uptrends and downtrends in price.
Disclosure: I am part of Trade Nation's Influencer program and receive a monthly fee for using their TradingView charts in my analysis.
———————————
WISH YOU ALL LUCK
NZDCAD What Next? SELL!
My dear subscribers,
This is my opinion on the NZDCAD next move:
The instrument tests an important psychological level 0.7949
Bias - Bearish
Technical Indicators: Supper Trend gives a precise Bearish signal, while Pivot Point HL predicts price changes and potential reversals in the market.
Target - 0.7903
About Used Indicators:
On the subsequent day, trading above the pivot point is thought to indicate ongoing bullish sentiment, while trading below the pivot point indicates bearish sentiment.
Disclosure: I am part of Trade Nation's Influencer program and receive a monthly fee for using their TradingView charts in my analysis.
———————————
WISH YOU ALL LUCK

CAD/NOK SHORT Investment Opportunity 4H
Hello everyone, I am Trader Andrea Russo, and today I want to present you a SHORT investment opportunity on CAD/NOK. With the help of the SwipeUP Reversal Radar Multi-Timeframe Alerts indicator, we have identified a setup that stands out for its bearish potential.
Investment Setup:
Entry Price: 7.67
Target Price (TP): 7,418, corresponding to an estimated profit of 3.28%
Stop Loss (SL): 7,803, corresponding to a risk of 1.74%
Technical Analysis and Motivation:
This setup is based on bearish pressure signals, with technical confirmations that suggest a potential downside reversal. The break of the Dynamic Support on the 4-hour (4H) chart reinforces the idea of a possible bearish movement, offering an interesting trading opportunity.
Final Recommendations:
Always check the chart to verify that the conditions remain favorable.
Apply adequate risk management to optimize the outcome of the trade.
Create a strategic plan before acting to best capitalize on this setup.
Happy trading everyone! 📉

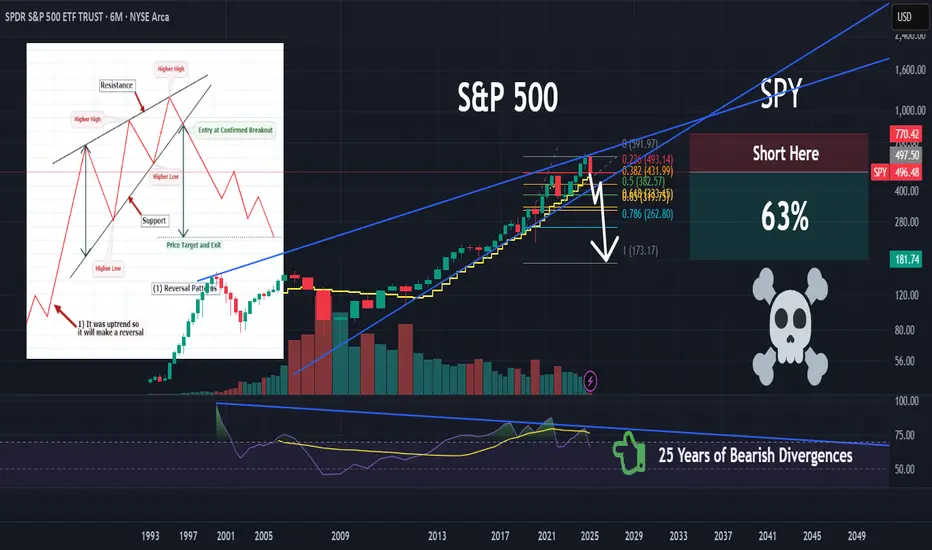
SPY | Things Could Get Ugly | ShortSPDR S&P 500 ETF Trust seeks to provide investment results that, before expenses, correspond generally to the price and yield performance of the S&P 500 Index. The Trust seeks to achieve its investment objective by holding a portfolio of the common stocks that are included in the index (the "Portfolio"), with the weight of each stock in the Portfolio substantially corresponding to the weight of such stock in the index.
More bad days for TESLATesla is about to meet its temporary trandline and probably will continue to close the gap.

BTC: FVG Filled – Room for Further Downside?#BTC didn’t reach the major demand zones below but gave us a minor bounce and filled the Fair Value Gap (FVG).
Now that the FVG is filled, the chart looks ready to continue the move down into stronger support areas.
Stay locked in—follow me so you don’t miss the next key levels. 📉✅

EURUSD: Short Signal Explained
EURUSD
- Classic bearish setup
- Our team expects bearish continuation
SUGGESTED TRADE:
Swing Trade
Short EURUSD
Entry Point - 1.0896
Stop Loss - 1.0939
Take Profit - 1.0808
Our Risk - 1%
Start protection of your profits from lower levels
Disclosure: I am part of Trade Nation's Influencer program and receive a monthly fee for using their TradingView charts in my analysis.
❤️ Please, support our work with like & comment! ❤️

CHFJPY: Short Trade with Entry/SL/TP
CHFJPY
- Classic bearish formation
- Our team expects fall
SUGGESTED TRADE:
Swing Trade
Sell CHFJPY
Entry Level - 172.08
Sl - 172.94
Tp - 170.44
Our Risk - 1%
Start protection of your profits from lower levels
Disclosure: I am part of Trade Nation's Influencer program and receive a monthly fee for using their TradingView charts in my analysis.
❤️ Please, support our work with like & comment! ❤️

EURUSD Buyers In Panic! SELL!
My dear subscribers,
EURUSD looks like it will make a good move, and here are the details:
The market is trading on 1.0959 pivot level.
Bias - Bearish
My Stop Loss - 1.1012
Technical Indicators: Both Super Trend & Pivot HL indicate a highly probable Bearish continuation.
Target - 1.0874
About Used Indicators:
The average true range (ATR) plays an important role in 'Supertrend' as the indicator uses ATR to calculate its value. The ATR indicator signals the degree of price volatility.
Disclosure: I am part of Trade Nation's Influencer program and receive a monthly fee for using their TradingView charts in my analysis.
———————————
WISH YOU ALL LUCK

EURNZD: Bearish Continuation is Expected! Here is Why:
The price of EURNZD will most likely collapse soon enough, due to the supply beginning to exceed demand which we can see by looking at the chart of the pair.
Disclosure: I am part of Trade Nation's Influencer program and receive a monthly fee for using their TradingView charts in my analysis.
❤️ Please, support our work with like & comment! ❤️

GOLD - Price can continue to decline to $2920 pointsHi guys, this is my overview for XAUUSD, feel free to check it and write your feedback in comments👊
Some time ago price moved inside a rising channel, making higher highs and holding above support levels.
Later, Gold broke resistance and continued to rise, reaching the upper boundary of the price channel.
After touching $3076 zone, price turned around and exited the channel with a strong bearish impulse.
Recently, it made a breakout below $3055 level and bounced from the area without a strong upward reaction.
Now Gold trades below resistance zone and holds under broken channel, forming local bearish structure.
In my opinion, Gold can continue to decline and reach $2920 points during the next wave down.
If this post is useful to you, you can support me with like/boost and advice in comments❤️

EURO - Price can bounce from resistance area to $1.0850 pointsHi guys, this is my overview for EURUSD, feel free to check it and write your feedback in comments👊
A not long time ago price moved inside a falling channel and showed weak activity with limited growth attempts.
Later Euro made a breakout, exited the channel, and started to form a new bullish structure near resistance.
After that, price made a sharp upward impulse, touching $1.1010 resistance and forming a pennant pattern.
Recently, it broke the lower border of pennant and tested $1.0990 level from below, then bounced down.
Now price trades under local resistance area and holds below broken trendline with weak upward attempts.
In my opinion, Euro can continue to decline and reach $1.0850 support level in the upcoming sessions.
If this post is useful to you, you can support me with like/boost and advice in comments❤️

EURUSD Under Pressure! SELL!
My dear subscribers,
This is my opinion on the EUR/USD next move:
The instrument tests an important psychological level 1.1092
Bias - Bearish
Technical Indicators: Supper Trend gives a precise Bearish signal, while Pivot Point HL predicts price changes and potential reversals in the market.
Target - 1.0900
My Stop Loss - 1.1202
About Used Indicators:
On the subsequent day, trading above the pivot point is thought to indicate ongoing bullish sentiment, while trading below the pivot point indicates bearish sentiment.
Disclosure: I am part of Trade Nation's Influencer program and receive a monthly fee for using their TradingView charts in my analysis.
———————————
WISH YOU ALL LUCK

CHFJPY The Target Is DOWN! SELL!
My dear subscribers,
CHFJPY looks like it will make a good move, and here are the details:
The market is trading on 170.81 pivot level.
Bias - Bearish
Technical Indicators: Both Super Trend & Pivot HL indicate a highly probable Bearish continuation.
Target - 169.89
About Used Indicators:
The average true range (ATR) plays an important role in 'Supertrend' as the indicator uses ATR to calculate its value. The ATR indicator signals the degree of price volatility.
Disclosure: I am part of Trade Nation's Influencer program and receive a monthly fee for using their TradingView charts in my analysis.
———————————
WISH YOU ALL LUCK

BITCOIN Will Move Lower! Sell!
Take a look at our analysis for BITCOIN.
Time Frame: 30m
Current Trend: Bearish
Sentiment: Overbought (based on 7-period RSI)
Forecast: Bearish
The market is testing a major horizontal structure 79,880.44.
Taking into consideration the structure & trend analysis, I believe that the market will reach 78,453.18 level soon.
P.S
The term oversold refers to a condition where an asset has traded lower in price and has the potential for a price bounce.
Overbought refers to market scenarios where the instrument is traded considerably higher than its fair value. Overvaluation is caused by market sentiments when there is positive news.
Disclosure: I am part of Trade Nation's Influencer program and receive a monthly fee for using their TradingView charts in my analysis.
Like and subscribe and comment my ideas if you enjoy them!

GBPUSD Is Very Bearish! Short!
Here is our detailed technical review for GBPUSD.
Time Frame: 9h
Current Trend: Bearish
Sentiment: Overbought (based on 7-period RSI)
Forecast: Bearish
The market is approaching a significant resistance area 1.277.
Due to the fact that we see a positive bearish reaction from the underlined area, I strongly believe that sellers will manage to push the price all the way down to 1.256 level.
P.S
Overbought describes a period of time where there has been a significant and consistent upward move in price over a period of time without much pullback.
Disclosure: I am part of Trade Nation's Influencer program and receive a monthly fee for using their TradingView charts in my analysis.
Like and subscribe and comment my ideas if you enjoy them!

EURGBP Is Going Down! Sell!
Take a look at our analysis for EURGBP.
Time Frame: 1D
Current Trend: Bearish
Sentiment: Overbought (based on 7-period RSI)
Forecast: Bearish
The market is on a crucial zone of supply 0.855.
The above-mentioned technicals clearly indicate the dominance of sellers on the market. I recommend shorting the instrument, aiming at 0.846 level.
P.S
Please, note that an oversold/overbought condition can last for a long time, and therefore being oversold/overbought doesn't mean a price rally will come soon, or at all.
Disclosure: I am part of Trade Nation's Influencer program and receive a monthly fee for using their TradingView charts in my analysis.
Like and subscribe and comment my ideas if you enjoy them!

EUR/GBP SHORT FROM RESISTANCE
Hello, Friends!
EUR-GBP uptrend evident from the last 1W green candle makes short trades more risky, but the current set-up targeting 0.852 area still presents a good opportunity for us to sell the pair because the resistance line is nearby and the BB upper band is close which indicates the overbought state of the EUR/GBP pair.
Disclosure: I am part of Trade Nation's Influencer program and receive a monthly fee for using their TradingView charts in my analysis.
✅LIKE AND COMMENT MY IDEAS✅
