EURCHF A Fall Expected! SELL!
My dear followers,
I analysed this chart on EURCHF and concluded the following:
The market is trading on 0.9396 pivot level.
Bias - Bearish
Technical Indicators: Both Super Trend & Pivot HL indicate a highly probable Bearish continuation.
Target - 0.9312
Safe Stop Loss - 0.9444
About Used Indicators:
A super-trend indicator is plotted on either above or below the closing price to signal a buy or sell. The indicator changes color, based on whether or not you should be buying. If the super-trend indicator moves below the closing price, the indicator turns green, and it signals an entry point or points to buy.
Disclosure: I am part of Trade Nation's Influencer program and receive a monthly fee for using their TradingView charts in my analysis.
———————————
WISH YOU ALL LUCK
Short

NZDJPY: Short Signal Explained
NZDJPY
- Classic bearish formation
- Our team expects fall
SUGGESTED TRADE:
Swing Trade
Sell NZDJPY
Entry Level - 85.165
Sl - 85.986
Tp - 83.647
Our Risk - 1%
Start protection of your profits from lower levels
Disclosure: I am part of Trade Nation's Influencer program and receive a monthly fee for using their TradingView charts in my analysis.
❤️ Please, support our work with like & comment! ❤️

NZDUSD: Bears Will Push Lower
Remember that we can not, and should not impose our will on the market but rather listen to its whims and make profit by following it. And thus shall be done today on the NZDUSD pair which is likely to be pushed down by the bears so we will sell!
Disclosure: I am part of Trade Nation's Influencer program and receive a monthly fee for using their TradingView charts in my analysis.
❤️ Please, support our work with like & comment! ❤️

AUDCHF What Next? SELL!
My dear subscribers,
AUDCHF looks like it will make a good move, and here are the details:
The market is trading on 0.5271 pivot level.
Bias - Bearish
Technical Indicators: Both Super Trend & Pivot HL indicate a highly probable Bearish continuation.
Target - 0.5227
About Used Indicators:
The average true range (ATR) plays an important role in 'Supertrend' as the indicator uses ATR to calculate its value. The ATR indicator signals the degree of price volatility.
Disclosure: I am part of Trade Nation's Influencer program and receive a monthly fee for using their TradingView charts in my analysis.
———————————
WISH YOU ALL LUCK

AUDUSD Will Go Down! Short!
Here is our detailed technical review for AUDUSD.
Time Frame: 1D
Current Trend: Bearish
Sentiment: Overbought (based on 7-period RSI)
Forecast: Bearish
The market is approaching a significant resistance area 0.638.
Due to the fact that we see a positive bearish reaction from the underlined area, I strongly believe that sellers will manage to push the price all the way down to 0.622 level.
P.S
The term oversold refers to a condition where an asset has traded lower in price and has the potential for a price bounce.
Overbought refers to market scenarios where the instrument is traded considerably higher than its fair value. Overvaluation is caused by market sentiments when there is positive news.
Disclosure: I am part of Trade Nation's Influencer program and receive a monthly fee for using their TradingView charts in my analysis.
Like and subscribe and comment my ideas if you enjoy them!

EURJPY Will Move Lower! Sell!
Take a look at our analysis for EURJPY.
Time Frame: 1D
Current Trend: Bearish
Sentiment: Overbought (based on 7-period RSI)
Forecast: Bearish
The market is on a crucial zone of supply 162.022.
The above-mentioned technicals clearly indicate the dominance of sellers on the market. I recommend shorting the instrument, aiming at 159.493 level.
P.S
We determine oversold/overbought condition with RSI indicator.
When it drops below 30 - the market is considered to be oversold.
When it bounces above 70 - the market is considered to be overbought.
Disclosure: I am part of Trade Nation's Influencer program and receive a monthly fee for using their TradingView charts in my analysis.
Like and subscribe and comment my ideas if you enjoy them!

BITCOIN BEST PLACE TO SELL FROM|SHORT
BITCOIN SIGNAL
Trade Direction: short
Entry Level: 92,665.30
Target Level: 86,001.16
Stop Loss: 97,096.62
RISK PROFILE
Risk level: medium
Suggested risk: 1%
Timeframe: 9h
Disclosure: I am part of Trade Nation's Influencer program and receive a monthly fee for using their TradingView charts in my analysis.
✅LIKE AND COMMENT MY IDEAS✅

NZD/JPY SHORT FROM RESISTANCE
Hello, Friends!
The BB upper band is nearby so NZD-JPY is in the overbought territory. Thus, despite the uptrend on the 1W timeframe I think that we will see a bearish reaction from the resistance line above and a move down towards the target at around 83.709.
Disclosure: I am part of Trade Nation's Influencer program and receive a monthly fee for using their TradingView charts in my analysis.
✅LIKE AND COMMENT MY IDEAS✅

CAD/JPY BEARS WILL DOMINATE THE MARKET|SHORT
Hello, Friends!
Previous week’s green candle means that for us the CAD/JPY pair is in the uptrend. And the current movement leg was also up but the resistance line will be hit soon and upper BB band proximity will signal an overbought condition so we will go for a counter-trend short trade with the target being at 101.200.
Disclosure: I am part of Trade Nation's Influencer program and receive a monthly fee for using their TradingView charts in my analysis.
✅LIKE AND COMMENT MY IDEAS✅

Daily BTC OverviewThe daily chart in its simplest form can be broken down into this range. Since President Trumps inauguration, BTC has declined from a range high of $108,000 back to the lows of $74,500 closing the FVG caused by the US election rally. After a double bottom Bitcoin mean reverted back to the range midpoint which to me is the most important area on the entire chart because it decides if the bull run can continue or if it dies.
I like to keep a close eye on the 200 EMA on multiple timeframes but the 1D is important to gauge the momentum of the move. As the US election results came in a massive push away from this moving average causes the level to steepen in its climb showing strength. Since BTC spent quite some time in the top half of the range the 1D 200 EMA flattens out signaling a loss of momentum, once this level does become flat it no longer provides support. For a bullish cycle to be just that ideally the corrective moves do not spend too much time below this level before expanding above and beyond it once again starting the next leg of the move. A persistent move down below causes a rollover and the cycle looks to be over with a bear market beginning.
Bullish scenario - The correction is over and BTC consistently posts HH's & HLs bringing the 1D 200 EMA up with price and continues the previous bullish trend. I would want to see the retest of the midpoint be successful and then move to reclaim the next local high before targeting range high. The bull market correction looks to be over and bullish continuation resumes.
Bearish scenario - This move is nothing more than a LH, BTC wicks the supply above midpoint, swing fails back under and continues to make LH's & LL's back down to range low where the 1D 200EMA will have now rolled over providing more of a resistance level. The bear market looks to have begun.
I am not here to make a call on where BTC is going next as I do not have that answer, but I do have to plan for each eventuality and that is what I have done here from a TA pint of view. Now it is entirely possible that Geo-political news or an exchange hack etc throws TA out of the window and I have to rethink the plan but in a strictly chart structure perspective this is how I see it.
The indicator "TRADING ENVIRONMENT+V1.0" used in the Idea post is now publicly available for use, give it a try and leave your thoughts and suggestions on the post, thank you.

BTC - Is there anything that can stop this bullrun?The current 4H structure presents a high-probability scenario centered around a classic liquidity sweep into premium levels, followed by potential downside rebalancing into inefficiencies. This is a clear case of price reaching for external liquidity before internal structure takes over.
---
1. Liquidity Run Above BSLs
Price has aggressively pushed upward, sweeping multiple Buy Side Liquidity (BSL) levels. These levels mark resting stop orders and breakout entries positioned by retail above recent swing highs.
- The impulsive move to the upside isn't a sign of strength—it's a strategic run for liquidity.
- These liquidity pools provide exit opportunities for large players offloading long positions initiated earlier in the structure.
- The sweep aligns with typical behavior just before price reacts to higher timeframe supply or premium Fibonacci zones.
---
2. Golden Pocket Confluence Zone (Downtrend Bias)
The orange highlighted zone represents the Golden Pocket —the 61.8%-to-65% retracement zone often associated with downtrend continuation or reversal setups.
- This level acts as a magnet in trending conditions, often leading to strong rejections.
- As price enters this pocket, the probability of a reaction increases, especially following a liquidity grab.
- The structure suggests this move is designed not for continuation, but for setting up a reversal.
The projected swing failure pattern at this level implies a shift from bullish euphoria to short-term distribution.
---
3. Internal Structure: Fair Value Gaps as Rebalance Zones
Two Fair Value Gaps (FVGs) are marked as zones of inefficiency, where price moved too aggressively to maintain balance between buyers and sellers.
- FVGs represent internal liquidity voids and serve as high-probability magnets for retracement.
- The first FVG lies just below the current price, suggesting a short-term retracement target.
- The second, deeper FVG offers a more substantial downside target and is aligned with typical rebalancing behavior after aggressive markups.
As price begins to break structure to the downside, these gaps become the logical destinations.
---
4. Probable Flow: Liquidity Sweep → Rejection → Internal FVG Fill
The anticipated flow is strategic and sequential:
- Step 1: Sweep of BSL and deviation into the Golden Pocket
- Step 2: Quick rejection, potentially forming a lower high
- Step 3: Downside expansion targeting both FVGs for liquidity rebalancing
This is not about chasing price—it’s about understanding the intent behind the move : create imbalance, sweep liquidity, then deliver price into inefficiency.
---
Conclusion:
This 4H chart outlines a mechanically driven move:
- External liquidity (BSL) tapped
- Premium level tested (Golden Pocket)
- Internal inefficiencies below acting as draw
The structure points to a transitional phase from premium to discount, with the FVGs below acting as clear objectives. Until those inefficiencies are fully addressed, the upside narrative remains reactive, not impulsive.

Ethereum Hits Critical Resistance — Is a Drop to $1400 Next?Introduction
Ethereum has been in a sustained downtrend over the past weeks, struggling to gain any real bullish traction. After a sharp decline last Sunday, the market remains under pressure, and although we’ve seen short-term attempts to recover, the broader trend still points downward. Technical indicators and price structure suggest this may not be over, with both Fibonacci levels and momentum oscillators hinting at further downside potential.
Resistance from the FVG and Fibonacci
Last Sunday, Ethereum dropped over 10% in a single move, forming a large 4-hour Fair Value Gap (FVG) in the process. This gap signaled a strong imbalance between buyers and sellers, with sellers clearly in control. Earlier this week, ETH managed to retrace up to the 50% level of that FVG but faced immediate rejection, highlighting the strength of the resistance. Currently, price is once again moving into the FVG zone and has reached the golden pocket Fibonacci level between $1650 and $1664. This area often acts as a key pivot for price direction. If bulls manage to break through, the next logical target would be the 0.786 Fibonacci retracement at $1724, potentially completing the fill of the FVG.
Stochastic RSI weakening on the daily timeframe
While the short-term price action shows some bullish effort, the daily Stochastic RSI tells a different story. It has now almost entered the overbought zone, suggesting that Ethereum’s current upward move may be running out of steam. This indicator often precedes a shift in momentum, and if history repeats itself, we could soon see bears stepping back in. With ETH still unable to break recent highs, the setup favors a continuation of the downtrend. If selling pressure resumes, we could be looking at a move down to the $1400 level, or potentially even lower.
Thanks for your support.
- Make sure to follow me so you don't miss out on the next analysis!
- Drop a like and leave a comment!

GBPCAD The Target Is DOWN! SELL!
My dear followers,
This is my opinion on the GBPCAD next move:
The asset is approaching an important pivot point 1.8481
Bias - Bearish
Safe Stop Loss - 1.8552
Technical Indicators: Supper Trend generates a clear short signal while Pivot Point HL is currently determining the overall Bearish trend of the market.
Goal - 1.8357
About Used Indicators:
For more efficient signals, super-trend is used in combination with other indicators like Pivot Points.
———————————
WISH YOU ALL LUCK

NZDUSD Will Collapse! SELL!
My dear friends,
My technical analysis for NZDUSD is below:
The market is trading on 0.5997 pivot level.
Bias - Bearish
Technical Indicators: Both Super Trend & Pivot HL indicate a highly probable Bearish continuation.
Target -0.5855
Recommended Stop Loss - 0.6073
About Used Indicators:
A pivot point is a technical analysis indicator, or calculations, used to determine the overall trend of the market over different time frames.
Disclosure: I am part of Trade Nation's Influencer program and receive a monthly fee for using their TradingView charts in my analysis.
———————————
WISH YOU ALL LUCK

We might be seeing a short-term correctionWe might be seeing a short-term correction, as the USDT supply is rising again and both ETH and BTC failed to break through their resistance levels — while Solana did. A brief pullback is possible, especially considering that the main reason behind the breakout was recent news about Trump. That could mean the breakout was a fake move or part of a temporary trend.
The three major currencies that usually drive the market are currently showing less bullish momentum for the coming days — except for Solana , which successfully broke its resistance . However, Solana isn’t continuing to climb either, likely because we still need a breakout from both ETH and BTC to confirm the move.

GBPJPY Potential DownsidesHey Traders, in today's trading session we are monitoring GBPJPY for a selling opportunity around 189.100 zone, GBPJPY is trading in a downtrend and currently is in a correction phase in which it is approaching the trend at 189.100 support and resistance area.
Trade safe, Joe.

HelenP. I Bitcoin may drop from resistance zone to $84K pointsHi folks today I'm prepared for you Bitcoin analytics. After spending several days consolidating below the resistance area, Bitcoin finally pushed higher and retested the 87500 level. This resistance was already confirmed multiple times in the past, and now it aligns perfectly with the upper boundary of the resistance zone at 88200 - 87500. The price made a sharp rally toward that level after bouncing from the support zone at 81200 - 80500, where bulls managed to defend the trend line. Currently, BTC is trading just under the resistance zone, showing early signs of rejection and slowing momentum. The price structure still respects the trend line from below, but the positioning beneath resistance, combined with the triangle formation, suggests potential exhaustion at the top. Given the repeated tests of resistance and the overall pattern, I expect BTC to decline from this level and move down, breaking the trend line and exiting the triangle pattern. For this case, I set my goal at the 84000 points. If you like my analytics you may support me with your like/comment ❤️

HelenP. I Gold may continue fall to support zoneHi folks today I'm prepared for you Gold analytics. After a strong bullish impulse, the price of Gold reached a local peak and started to reverse. Before that, the uptrend was developing within a clearly defined ascending channel, where the trend line acted as dynamic support multiple times. Each time the price touched this line, it rebounded and continued climbing higher. However, the most recent upward movement ended with a sharp pullback, which marked the beginning of a potential correction. At the moment, the price is trading below the recent high and has already started forming a corrective downward move. XAUUSD is now heading toward the important support zone between 3190 and 3160 points. This area is not only a key horizontal level but also intersects with the trend line, making it a strong confluence zone that may act as a magnet for the price during this phase. I expect that the Gold will make a minor upward move before continuing to decline, targeting the support zone at 3190 points, which is my current goal. Given the recent price rejection from the resistance and the bearish momentum building, a move toward 3190 looks like the most probable path. If you like my analytics you may support me with your like/comment ❤️

Euro can drop from top part of range and fall to support levelHello traders, I want share with you my opinion about Euro. Recently, price continued to grow inside a well-defined upward channel, maintaining a steady structure of higher highs and higher lows. The move started after a clear breakout from the buyer zone, which marked a strong bullish impulse and confirmed support near the 1.0735 level. After this breakout, the price gradually climbed, eventually entering a horizontal range, where it started to consolidate between local support and resistance. The current support level has held firm and now aligns with the lower boundary of the range as well as the support area. At the moment, the Euro is approaching the upper boundary of the range. Given the repeated reactions from this resistance zone, I expect the price to make one more push upward, retesting the top of the range, and then reverse downward toward the lower boundary, with TP1 set at 1.1270, where demand and structure are likely to react again. This short-term setup aligns with the current channel structure, the strength of the support area, and the repeated rejection from the range highs. Please share this idea with your friends and click Boost 🚀

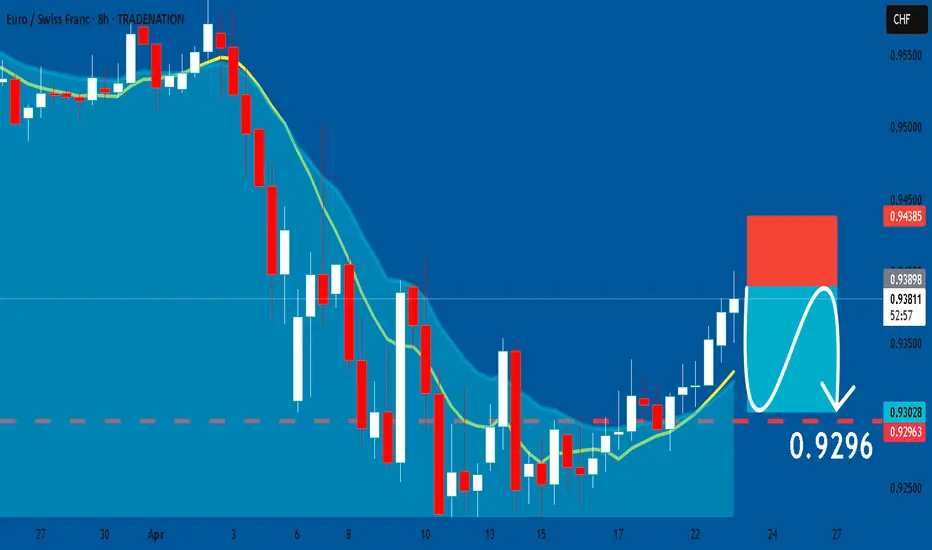
EURCHF: Short Trade with Entry/SL/TP
EURCHF
- Classic bearish formation
- Our team expects pullback
SUGGESTED TRADE:
Swing Trade
Short EURCHF
Entry - 0.9389
Sl - 0.9438
Tp - 0.9296
Our Risk - 1%
Start protection of your profits from lower levels
Disclosure: I am part of Trade Nation's Influencer program and receive a monthly fee for using their TradingView charts in my analysis.
❤️ Please, support our work with like & comment! ❤️
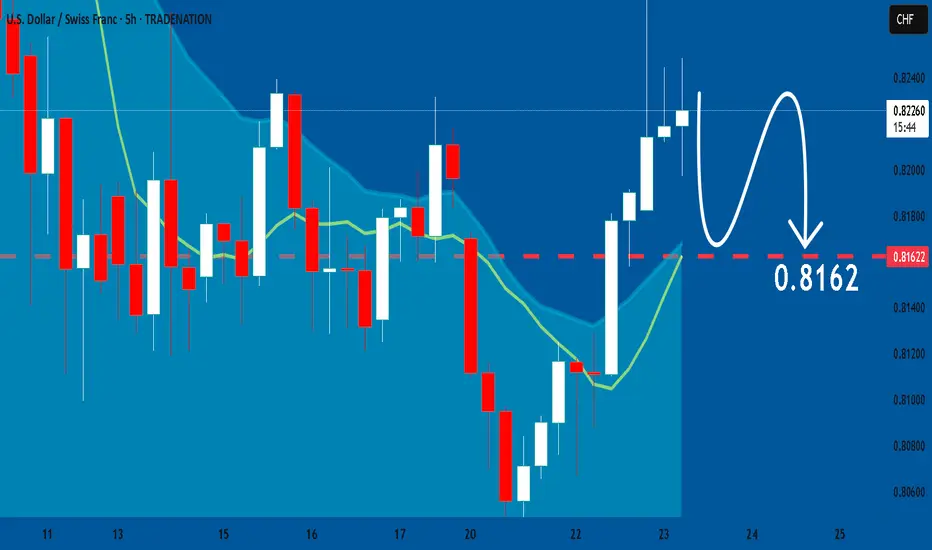
USDCHF: Bearish Forecast & Bearish Scenario
Balance of buyers and sellers on the USDCHF pair, that is best felt when all the timeframes are analyzed properly is shifting in favor of the sellers, therefore is it only natural that we go short on the pair.
Disclosure: I am part of Trade Nation's Influencer program and receive a monthly fee for using their TradingView charts in my analysis.
❤️ Please, support our work with like & comment! ❤️
GBPCHF Set To Fall! SELL!
My dear friends,
Please, find my technical outlook for GBPCHF below:
The price is coiling around a solid key level - 1.0950
Bias - Bearish
Technical Indicators: Pivot Points Low anticipates a potential price reversal.
Super trend shows a clear sell, giving a perfect indicators' convergence.
Goal - 1.0844
Safe Stop Loss - 1.1013
About Used Indicators:
The pivot point itself is simply the average of the high, low and closing prices from the previous trading day.
Disclosure: I am part of Trade Nation's Influencer program and receive a monthly fee for using their TradingView charts in my analysis.
———————————
WISH YOU ALL LUCK

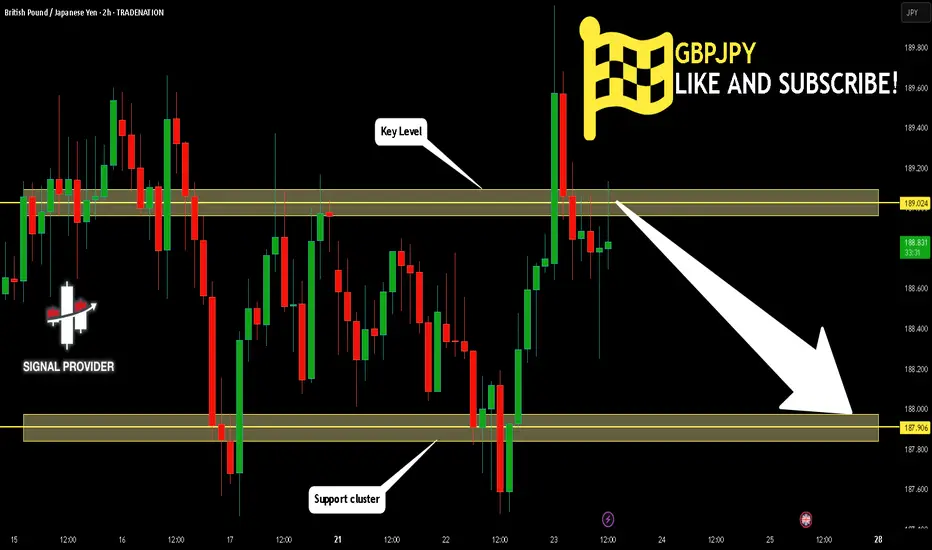
GBPJPY Will Fall! Short!
Please, check our technical outlook for GBPJPY.
Time Frame: 2h
Current Trend: Bearish
Sentiment: Overbought (based on 7-period RSI)
Forecast: Bearish
The market is approaching a key horizontal level 189.024.
Considering the today's price action, probabilities will be high to see a movement to 187.906.
P.S
We determine oversold/overbought condition with RSI indicator.
When it drops below 30 - the market is considered to be oversold.
When it bounces above 70 - the market is considered to be overbought.
Disclosure: I am part of Trade Nation's Influencer program and receive a monthly fee for using their TradingView charts in my analysis.
Like and subscribe and comment my ideas if you enjoy them!