SHORT NZD/CNH 8H Investment Opportunity
Hello, I am trader Andrea Russo and today I want to talk to you about a SHORT investment opportunity on the NZD/CNH exchange rate.
Trade Details
The trade starts at the 4.40 area with a Stop Loss (SL) at 4.44 and a Take Profit (TP) at 4.21.
Market Analysis
Currently, the NZD/CNH exchange rate is around 4.381. The recent performance of the NZD has shown some volatility, influenced by economic factors such as inflation in New Zealand and trade policies. These elements have contributed to creating a context of uncertainty that could favor a decline in the exchange rate.
Trading Strategy
The proposed strategy involves entering a SHORT position at 4.40, anticipating a decline towards the level of 4.21. The Stop Loss at 4.44 is used to limit losses in case the market moves against our prediction. This setup offers a good risk/reward ratio, making the trade interesting for traders looking for short-term profit opportunities.
Final Thoughts
This trading opportunity requires careful risk management and constant monitoring of market conditions. The volatility of the NZD/CNH exchange rate can offer good profit opportunities, but it is essential to be prepared to react quickly to changes. It is advisable to stay updated on economic news and events that could affect the market.
Happy trading!
Short

Bitcoin Bearish Dead Cat BounceI am not a financial advisor. This is not meant to be and does not constitute financial, investment, trading, or any other types of advice or recommendation.

NZDCAD: Bearish Continuation is Highly Probable! Here is Why:
The price of NZDCAD will most likely collapse soon enough, due to the supply beginning to exceed demand which we can see by looking at the chart of the pair.
❤️ Please, support our work with like & comment! ❤️

AUDUSD: Bears Will Push
Our strategy, polished by years of trial and error has helped us identify what seems to be a great trading opportunity and we are here to share it with you as the time is ripe for us to sell AUDUSD.
❤️ Please, support our work with like & comment! ❤️

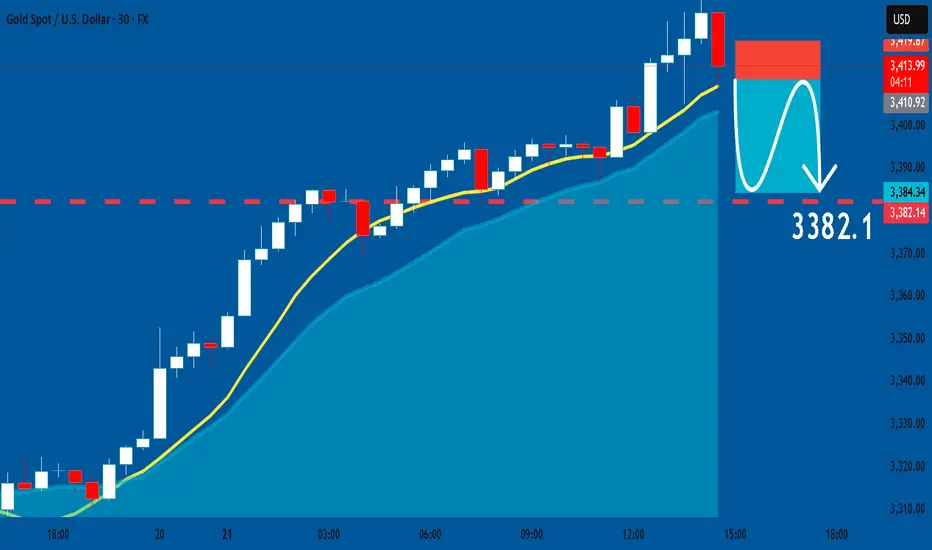
GOLD: Short Trade Explained
GOLD
- Classic bearish formation
- Our team expects fall
SUGGESTED TRADE:
Swing Trade
Sell GOLD
Entry Level - 3411.3
Sl - 3419.8
Tp - 3382.1
Our Risk - 1%
Start protection of your profits from lower levels
❤️ Please, support our work with like & comment! ❤️
Is gold currently in a bullish or bearish trend?We’ve seen gold surge significantly during times of uncertainty. The problem is, when we look back at the 2008 financial crisis, we notice a similarly exponential rise, which was followed by a 45% correction after reaching its peak. Based on a current price of $3,400, a correction down to $1,800 is possible. This means it’s very realistic that gold could spike again sharply—especially if Powell ends up being fired—and then, once things start to calm down again, we could see a major correction of at least 45%.

SILVER SENDS CLEAR BEARISH SIGNALS|SHORT
SILVER SIGNAL
Trade Direction: short
Entry Level: 32.821
Target Level: 31.594
Stop Loss: 33.634
RISK PROFILE
Risk level: medium
Suggested risk: 1%
Timeframe: 5h
Disclosure: I am part of Trade Nation's Influencer program and receive a monthly fee for using their TradingView charts in my analysis.
✅LIKE AND COMMENT MY IDEAS✅

EUR/GBP BEARS ARE GAINING STRENGTH|SHORT
EUR/GBP SIGNAL
Trade Direction: short
Entry Level: 0.860
Target Level: 0.843
Stop Loss: 0.872
RISK PROFILE
Risk level: medium
Suggested risk: 1%
Timeframe: 1D
Disclosure: I am part of Trade Nation's Influencer program and receive a monthly fee for using their TradingView charts in my analysis.
✅LIKE AND COMMENT MY IDEAS✅

GBP/CHF SHORT FROM RESISTANCE
GBP/CHF SIGNAL
Trade Direction: short
Entry Level: 1.140
Target Level: 1.128
Stop Loss: 1.148
RISK PROFILE
Risk level: medium
Suggested risk: 1%
Timeframe: 1D
Disclosure: I am part of Trade Nation's Influencer program and receive a monthly fee for using their TradingView charts in my analysis.
✅LIKE AND COMMENT MY IDEAS✅

BTC - The power of fibonacci This is a textbook example of how institutional price delivery often unfolds when targeting liquidity and rebalancing inefficiencies. The current BTC 1H chart displays a high-probability short scenario developing after a liquidity sweep, combined with entry into a fair value gap (FVG) chain and Fibonacci-based premium pricing. Let’s break down the mechanics of this setup layer by layer.
---
1. Liquidity Grab Above Buy-Side Liquidity (BSL)
The first major clue that institutional activity is at play is the clean sweep of Buy-Side Liquidity (BSL) .
- A previous swing high acted as a magnet for liquidity, with stop-loss orders from short sellers and breakout entries from late longs accumulating above this level.
- Price pierced above it, only to immediately reverse—this is what we refer to as a liquidity grab , signaling engineered movement designed to fuel larger orders.
- This behavior often represents the conclusion of a bullish leg and the transition into a distribution phase or a bearish delivery sequence.
This sweep is not random; it's a deliberate market manipulation mechanism—classic of a “trap and reverse” pattern.
---
2. Fair Value Gap (FVG) Chain: Imbalance as a Magnet
After rejecting above the BSL, price began retracing downward, but left behind multiple Fair Value Gaps (FVGs) . These are inefficiencies between price candles where institutional orders did not fully fill.
- These FVGs now form what we call a “chain” or cluster, providing a roadmap for price to return and rebalance.
- The current move upward is revisiting this chain of inefficiencies, offering a potential re-entry zone for institutions to offload positions accumulated earlier.
- FVGs in premium zones (above equilibrium) are particularly potent—they align with institutional interest to sell at value.
This aligns with the concept that price often returns to inefficiencies before continuing its true direction—especially when paired with a prior liquidity grab.
---
3. Golden Pocket and the Premium Zone Confluence
The retracement found a reaction at the Golden Pocket level (0.618–0.65 Fibonacci zone) , which is significant not just for its mathematical roots but for how frequently smart money uses it for mitigation and continuation entries.
- The zone lines up directly with the FVG chain, creating a powerful confluence zone where institutional footprints are likely to reappear.
- This area is within a clear premium pricing territory , above the 0.5 Fibonacci mark—ideal for distribution in bearish re-accumulation setups.
This convergence of technical signals bolsters the case that the current move upward is a mere retracement, not a genuine trend reversal.
---
4. Market Structure Context
From a structural point of view:
- Price has transitioned from a range into a lower high formation after the BSL sweep.
- The series of lower highs and lower lows began forming after the grab, which implies a potential shift in short-term order flow.
Combine this with the FVG chain and the premium pricing—it paints a narrative of bearish continuation rather than trend expansion to the upside.
---
5. Institutional Narrative: Engineering, Repricing, and Continuation
This setup is less about indicators and more about understanding narrative:
- Institutions engineered a liquidity sweep to fill large sell orders at premium pricing.
- The imbalance left behind (FVGs) serves as a “pullback magnet” before full bearish delivery.
- Price is currently delivering into that inefficiency, likely forming a redistribution schematic.
The most probable scenario, given this context, is a rejection within this zone and a continuation to the downside as price seeks to break internal structure and move toward sell-side liquidity (SSL) resting below.
---
Conclusion:
This chart captures the essence of smart money price delivery:
- Sweep → Retrace → Mitigation → Continuation
The rejection from the FVG chain and golden pocket zone will be key to confirming this scenario. If price respects this confluence, expect bearish order flow to dominate the next sessions.
This is a high-quality setup based on narrative, structure, and liquidity—not random confluence, but a storyline of engineered movement and institutional footprints.

OIL – Bearish Setup at FVG + Golden Pocket ConfluenceThis 4H chart of Crude Oil Futures highlights a clean bearish setup forming as price approaches a confluence zone of imbalance and premium pricing. After a sharp downward move, the current rally appears to be a retracement into areas of interest for potential distribution.
---
1. Context & Market Structure:
- The market experienced a significant bearish move, breaking multiple support levels with conviction.
- Price is currently retracing upward, creating the possibility of a lower high in line with bearish market structure.
- The ongoing move looks corrective, setting up a potential return to the dominant trend.
---
2. Fair Value Gaps (FVGs) & Key Supply Zones:
- Two FVGs are identified on the chart — both marked as areas where price moved too quickly, leaving inefficiencies behind.
- The lower FVG overlaps with the 0.618–0.65 Fibonacci golden pocket zone, providing a strong confluence for potential rejection.
- The upper FVG aligns with the 0.786 level, representing deeper premium pricing and added confluence for distribution.
---
3. Fibonacci Confluence Zones:
- 0.618–0.65 zone: Coincides with the lower FVG — this is the first area to watch for rejection.
- 0.786 level: Aligns with the upper FVG, making it an extended zone for bearish entries if price pushes higher.
- These Fibonacci levels serve as key retracement zones within the context of bearish continuation.
---
4. Anticipated Move:
- The red arrow illustrates the projected path: price reaching into the FVG and golden pocket confluence, then rejecting to the downside.
- The inefficiencies above act as supply zones where institutional selling may occur.
- The lower purple level (0.28) is a potential magnet for price if the retracement completes and bearish momentum resumes.
---
5. Trade Idea Narrative:
- This is a classic bearish setup where price retraces into premium and inefficiency zones during a downtrend.
- The ideal reaction would involve a shift in lower timeframe structure once the price hits the golden pocket + FVG zone.
- Patience and confirmation are key — watching for rejection patterns or breakdowns within the FVG before commitment.
---
Summary:
Crude Oil is retracing after a sharp drop and is approaching a high-probability reversal zone, where a Fair Value Gap overlaps with the golden pocket. This setup provides a strong narrative for potential bearish continuation, supported by structure, imbalance, and Fibonacci confluence.

BCT CMEWe are have 2 target
1) 86850
2) 83200
Friday close in 4h sibi, I think this Sunday NWOG open price down and looking stops lvl 83.200
We are see below 4h bisi after week vi, I think price need move first this area for create sales candle and after hunt 86.850 above NWOG 7 March
I search buy in this two pd area
Lets see what happen after open exchanges

Tron Potential DownsidesBINANCE:TRXUSDT
Hey Traders, in today's trading session we are monitoring Tron for a selling opportunity around 0.25 zone, Tron is trading in a downtrend and currently is in a correction phase in which it is approaching the trend at 0.25 support and resistance area.
Trade safe, Joe.

USDCAD Will Go Lower From Resistance! Sell!
Here is our detailed technical review for USDCAD.
Time Frame: 1h
Current Trend: Bearish
Sentiment: Overbought (based on 7-period RSI)
Forecast: Bearish
The market is trading around a solid horizontal structure 1.384.
The above observations make me that the market will inevitably achieve 1.378 level.
P.S
Please, note that an oversold/overbought condition can last for a long time, and therefore being oversold/overbought doesn't mean a price rally will come soon, or at all.
Disclosure: I am part of Trade Nation's Influencer program and receive a monthly fee for using their TradingView charts in my analysis.
Like and subscribe and comment my ideas if you enjoy them!

We're seeing a nice box breakout NVDA | Bullish?We're seeing a nice box breakout here, which could indicate a good opportunity for a deeper correction. Therefore, we're setting the target at $91.5 and would continue moving lower until we see another box breakout in the opposite direction. Additionally, there is a major resistance level around the $91.5 zone, which will give us insight into how far NVDA's downtrend might go—or whether this could mark the turning point.

EURUSD: Great Trading Opportunity
EURUSD
- Classic bearish formation
- Our team expects pullback
SUGGESTED TRADE:
Swing Trade
Short EURUSD
Entry - 1.1389
Sl - 1.1498
Tp - 1.1178
Our Risk - 1%
Start protection of your profits from lower levels
❤️ Please, support our work with like & comment! ❤️

USOIL: Bearish Continuation & Short Trade
USOIL
- Classic bearish pattern
- Our team expects retracement
SUGGESTED TRADE:
Swing Trade
Sell USOIL
Entry - 64.408
Stop - 66.133
Take - 60.964
Our Risk - 1%
Start protection of your profits from lower levels
❤️ Please, support our work with like & comment! ❤️

GBPUSD: Bearish Continuation
The recent price action on the GBPUSD pair was keeping me on the fence, however, my bias is slowly but surely changing into the bearish one and I think we will see the price go down.
❤️ Please, support our work with like & comment! ❤️

SILVER Massive Short! SELL!
My dear followers,
I analysed this chart on SILVER and concluded the following:
The market is trading on 32.515 pivot level.
Bias - Bearish
Technical Indicators: Both Super Trend & Pivot HL indicate a highly probable Bearish continuation.
Target - 31.382
Safe Stop Loss - 33.187
About Used Indicators:
A super-trend indicator is plotted on either above or below the closing price to signal a buy or sell. The indicator changes color, based on whether or not you should be buying. If the super-trend indicator moves below the closing price, the indicator turns green, and it signals an entry point or points to buy.
———————————
WISH YOU ALL LUCK

EURO - Price can fall to $1.1200 points, exiting from triangleHi guys, this is my overview for EURUSD, feel free to check it and write your feedback in comments👊
Price first broke out of a falling wedge pattern, kicking off a sharp rally that gained serious momentum.
The move ran into resistance at $1.1440, where price began stalling and transitioned into a triangle setup.
Since then, price has been wedged inside the triangle, testing highs but struggling to break convincingly.
The support trendline still holds, but each push upward is met with rejection near the resistance ceiling.
Momentum is fading, and with volume drying up, a downside move is becoming more likely from this zone.
I expect that the Euro can break lower from the triangle and fall to $1.1200 points in the upcoming sessions.
If this post is useful to you, you can support me with like/boost and advice in comments❤️

atom sell midterm "🌟 Welcome to Golden Candle! 🌟
We're a team of 📈 passionate traders 📉 who love sharing our 🔍 technical analysis insights 🔎 with the TradingView community. 🌎
Our goal is to provide 💡 valuable perspectives 💡 on market trends and patterns, but 🚫 please note that our analyses are not intended as buy or sell recommendations. 🚫
Instead, they reflect our own 💭 personal attitudes and thoughts. 💭
Follow along and 📚 learn 📚 from our analyses! 📊💡"

Bitcoin may exit from pennant and fall to support levelHello traders, I want share with you my opinion about Bitcoin. Over the past weeks, the price traded inside a broad horizontal range, repeatedly testing the boundaries of the seller zone and the buyer zone. After several failed breakouts, the price sharply dropped from the upper range and entered a phase of lower highs, forming a downward pennant structure. Inside this pennant, the market continued consolidating under pressure from the resistance area. Each attempt to break above the resistance line was met with rejection, confirming strong selling interest near the current resistance level at 88500. At the moment, BTC is testing the upper boundary of the pennant again. This area aligns closely with the resistance level and the long-term descending trendline. Given this confluence and historical rejection zones, I expect BTC to face resistance and reverse, initiating a decline back toward the 79000 support level, thereby exiting from the pennant, which is my current TP1. The compressed price structure, repeated rejections, and clean pattern formation support this bearish outlook in the short term. Please share this idea with your friends and click Boost 🚀

Litecoin Breakout and Potential RetraceBINANCE:LTCUSDT : Hey Traders,
In today's session, we're keeping a close eye on LTC/USDT as it approaches the $77 area, a key support-turned-resistance zone.
Litecoin recently broke below its previous uptrend, indicating a potential shift in momentum. It is now in a corrective phase, with price retracing back toward the broken trendline and horizontal resistance around $77.
This level could act as a strong rejection zone, offering a potential selling opportunity if bearish confirmation shows up.
