Lack of bullish momentum, gold price waits, slight decrease✍️ NOVA hello everyone, Let's comment on gold price next week from 05/05/2025 - 05/09/2025
🔥 World situation:
Gold (XAU/USD) slipped by more than 0.35% on Friday and is on track to close the week with a decline exceeding 2.5%, as easing trade tensions and upbeat US labor market data boosted investor risk appetite. This shift in sentiment encouraged profit-taking ahead of the weekend, weighing on the safe-haven asset. At last check, XAU/USD was trading around $3,226, pulling back from an intraday peak of $3,269.
Adding to the improved market mood, China’s Commerce Ministry confirmed that the US has shown a willingness to resume discussions on tariffs, while reiterating that Beijing remains open to dialogue.
🔥 Identify:
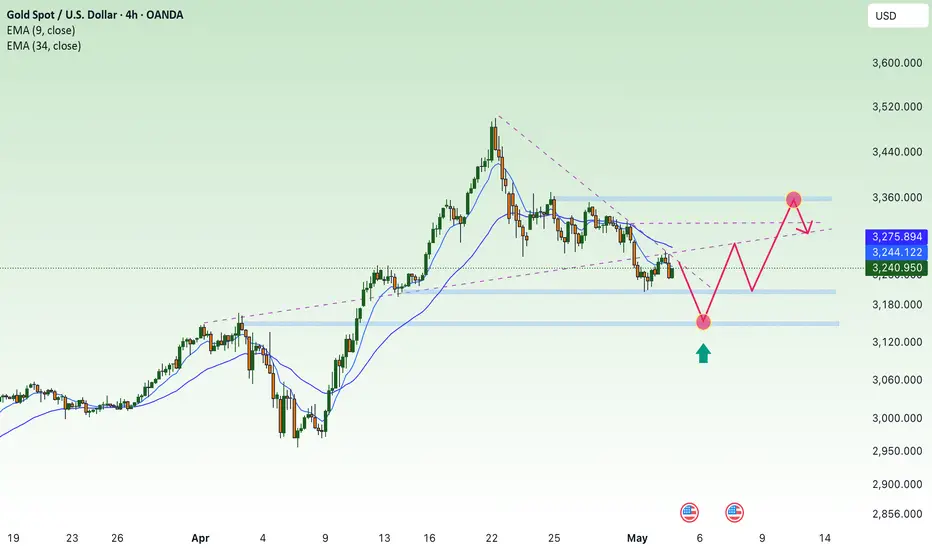
Gold price continues to adjust down, lacking momentum to increase price. around price range 3200 - 3350
🔥 Technically:
Based on the resistance and support areas of the gold price according to the H4 frame, NOVA identifies the important key areas as follows:
Resistance: $3285, $3316, $3355
Support : $3202, $3155
🔥 NOTE:
Note: Nova wishes traders to manage their capital well
- take the number of lots that match your capital
- Takeprofit equal to 4-6% of capital account
- Stoplose equal to 2-3% of capital account
- The winner is the one who sticks with the market the longest
Shortposition
Gold price heading below 3300⭐️GOLDEN INFORMATION:
Federal Reserve (Fed) officials have signaled openness to potential interest rate cuts, a stance that could limit further upside in the US Dollar (USD) and lend support to the non-yielding Gold price. Additionally, growing concerns over the economic repercussions of President Donald Trump’s aggressive tariff measures, combined with ongoing geopolitical instability, continue to bolster the appeal of safe-haven assets. In this environment, the broader bias for gold remains tilted to the upside, urging caution for traders considering bold bearish positions.
⭐️Personal comments NOVA:
continue sideways, price range fluctuates around 3300
⭐️SET UP GOLD PRICE:
🔥SELL GOLD zone : 3382- 3384 SL 3389
TP1: $3370
TP2: $3360
TP3: $3350
🔥BUY GOLD zone: $3294 - $3292 SL $3287
TP1: $3300
TP2: $3310
TP3: $3320
⭐️Technical analysis:
Based on technical indicators EMA 34, EMA89 and support resistance areas to set up a reasonable SELL order.
⭐️NOTE:
Note: Nova wishes traders to manage their capital well
- take the number of lots that match your capital
- Takeprofit equal to 4-6% of capital account
- Stoplose equal to 2-3% of capital account

Gold's short-term decline continues⭐️GOLDEN INFORMATION:
Gold price (XAU/USD) regained strong upward momentum during the Asian session on Thursday, rebounding sharply from the previous day’s steep decline and ending a two-day losing streak near the $3,260 weekly low. The renewed buying interest comes amid lingering concerns over the protracted trade impasse between the US and China, following US Treasury Secretary Scott Bessent’s comments indicating that the standoff could drag on.
Compounding market anxiety is the persistent uncertainty surrounding President Donald Trump’s tariff policies and their broader implications for global growth. These factors have fueled a fresh wave of safe-haven demand, driving investors back toward gold.
⭐️Personal comments NOVA:
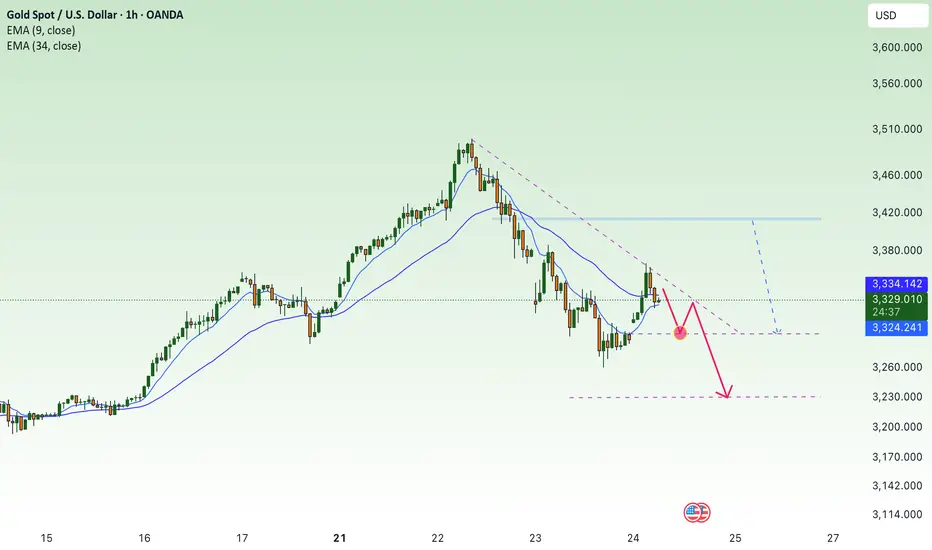
Still under selling pressure, gold price is consolidating below the downtrend line. Trading around 3300 and lower.
⭐️SET UP GOLD PRICE:
🔥SELL GOLD zone : 3412- 3414 SL 3419
TP1: $3390
TP2: $3380
TP3: $3370
🔥BUY GOLD zone: $3228 - $3230 SL $3223
TP1: $3240
TP2: $3250
TP3: $3260
⭐️Technical analysis:
Based on technical indicators EMA 34, EMA89 and support resistance areas to set up a reasonable SELL order.
⭐️NOTE:
Note: Nova wishes traders to manage their capital well
- take the number of lots that match your capital
- Takeprofit equal to 4-6% of capital account
- Stoplose equal to 2-3% of capital account
GBPUSD SHORT FORECAST Q2 W17 D23 Y25GBPUSD SHORT FORECAST Q2 W17 D23 Y25
Professional Risk Managers👋
Welcome back to another FRGNT chart update📈
Diving into some Forex setups using predominantly higher time frame order blocks alongside confirmation breaks of structure.
Let’s see what price action is telling us today!
🔑 Remember, to participate in trading comes always with a degree of risk, therefore as professional risk managers it remains vital that we stick to our risk management plan as well as our trading strategies.
📈The rest, we leave to the balance of probabilities.
💡Fail to plan. Plan to fail.
🏆It has always been that simple.
❤️Good luck with your trading journey, shall see you at the very top.
🎯Trade consistent, FRGNT X

Time for again DIPThe level 85000-86000 seems so important level... Until market is not breaking it market is not going Bullish... Level of 70000-69000, which I've already quoted in my last idea, am still waiting for that to swip.... I'll be Bullish from that level, until market breaks 85-86 level.

Gold begins to stabilize, trading around 2990⭐️GOLDEN INFORMATION:
Gold price (XAU/USD) finds renewed upward momentum during Tuesday’s Asian session, appearing to end a three-day losing streak after dipping to a nearly four-week low around the $2,957–2,956 region on Monday. Investor sentiment remains fragile amid lingering concerns over a potential global trade war, triggered by US President Donald Trump’s sweeping reciprocal tariffs announced last week. Fears of a recession and heightened uncertainty continue to fuel safe-haven demand, helping bullion stabilize after its sharp pullback from last Thursday’s all-time high.
⭐️Personal comments NOVA:
Gold price is in a correction downtrend, will continue sideways around 2950 - 3040
⭐️SET UP GOLD PRICE:
🔥SELL GOLD zone : 3036 - 3038 SL 3043
TP1: $3020
TP2: $3005
TP3: $2990
🔥BUY GOLD zone: $2962 - $2964 SL $2957
TP1: $2975
TP2: $2990
TP3: $3010
⭐️Technical analysis:
Based on technical indicators EMA 34, EMA89 and support resistance areas to set up a reasonable SELL order.
⭐️NOTE:
Note: Nova wishes traders to manage their capital well
- take the number of lots that match your capital
- Takeprofit equal to 4-6% of capital account
- Stoplose equal to 2-3% of capital account

EUR/USD short on weekly chart
Stop Loss = 1.14925
Entry Order = 1.10425
TP1 = 1.05925
Two positions with the same stop loss and x1 target for the first position
The stop loss of the second position to breakeven when the first position hits the target1.
The second position has no target, only exit
Risk= 2% of account capital (1% each position)

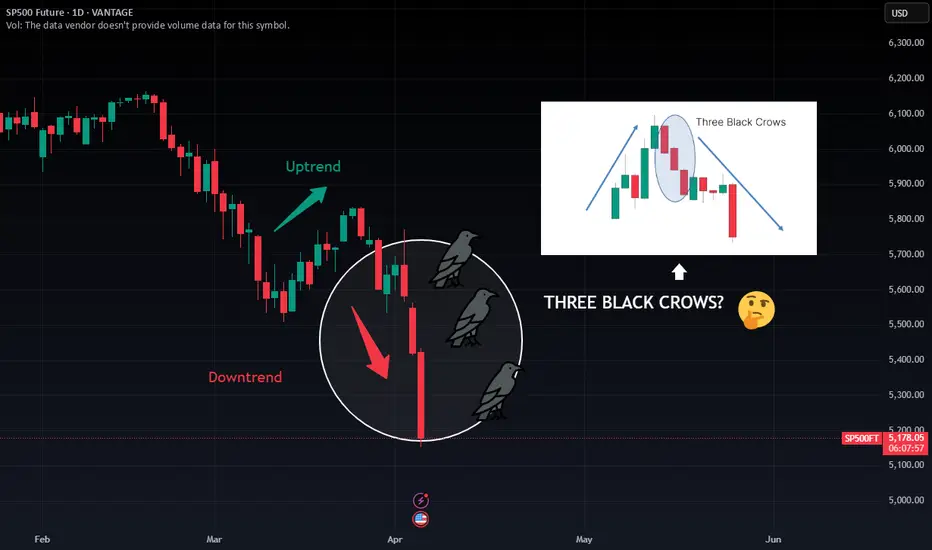
Are These the Three Black Crows Signaling More Pain Ahead? The S&P 500 has just printed three consecutive long-bodied red candles following a brief uptrend. This classic "Three Black Crows" formation could be a powerful bearish reversal signal—one that historically hints at a deeper correction on the horizon.
📊 What does this pattern mean?
Appears after an uptrend or rally.
Consists of 3 bearish candles closing near their lows.
Suggests strong seller control and trend reversal potential.
🔍 Current context:
The S&P is already under heavy pressure from macroeconomic and geopolitical concerns.
This pattern adds further bearish sentiment, especially if we see continued follow-through on volume.
🚨 If confirmed, we could be looking at the continuation of a larger downtrend. But remember: confirmation is key. Watch closely how price reacts in the next 1–2 sessions.
🧠 Do you see this as a real warning—or just a pause before the next leg up?
#SP500 #ThreeBlackCrows #CandlestickPatterns #BearishSignal #TechnicalAnalysis
BTCUSD TOUCHED 85000 REVERSAL ?What’s up, traders? I’m here to drop free game, sharp analysis, and top-tier trade setups! 🎯 Let’s get straight to it:
🔍 Market Insight
🔸 BTC/USD has been consolidating since Friday night now it broke the consolidation and touched 85000 which was awaiting from long way we posted an idea with a buy entry but price missed our entry area and flyed
🔸 A liquidity sweep at 84789 on the 30M timeframe confirms smart money movements.
🔸 Strategy: After a liquidity grab, we shift to the 1-minute timeframe to confirm a Change of Character (ChoCh) for a sniper entry! 🎯
🔥 Trade Execution
✔️ Order Block marked at 84,900.
✔️ Sell limit at 84,900 – catching this right at the sweet spot!
✔️ Stop-loss 85,200 (-30 pips) to manage risk.
✔️ Take-profit 84,100 (+80 pips) – smooth 1:2.5 risk-reward!
📊 Technical Breakdown
🟢 Bias: Bullish – buyers in control!
⚠️ Lock in profits after 30 pips – don’t get greedy!
📌 Final Setup
💰 Sell Limit: 84,900
⛔ Stop-Loss: 85,200
🎯 Take-Profit: 84,100
💸 Let’s ride this move and secure the bag! 🚀💰 #CryptoSignals #BTCUSD #SmartMoney #ForexTrading

Bitcoin’s Final Surge? One Month Before the Post-Halving Drop!Bitcoin Halving Cycles: What History Tells Us About 2025
The Bitcoin halving is a highly anticipated event that occurs approximately every four years, reducing the block reward by 50% ⛏️. This supply shock has historically been a major catalyst for price movements. By analyzing previous cycles, we can attempt to forecast what might happen in the upcoming halving cycle of 2025.
Historical Performance of Bitcoin Halving Cycles
First Halving (2012)
365 Days Before Halving: 📈 +385%
365 Days After Halving: 🚀 +8069%
Peak-to-Trough Decline After Peak: 🔻 -76.98%
Second Halving (2016)
365 Days Before Halving: 📈 +142%
365 Days After Halving: 🚀 +284%
Peak-to-Trough Decline After Peak: 🔻 -82.88%
Third Halving (2020)
365 Days Before Halving: 📈 +17%
365 Days After Halving: 🚀 +559%
Peak-to-Trough Decline After Peak: 🔻 -75.64%
Current Cycle and 2025 Halving Expectations
- Last Halving Date: 📅 April 15, 2024
- 365 Days Before Halving: Bitcoin gained 📈 +130% from $28,827 (April 2023) to around $65,000.
- Projected 365 Days After Halving (April 2025): If history rhymes, we could see a price increase of around 📊 +72%, with a potential closure at the current Peak of $110,000.
- Post-Peak Decline Estimate: Previous post-halving peaks saw declines of 📉 75%–82%. With Bitcoin's all-time high around $110,000, a 🔻 75% drawdown would target a bottom of ~$30,000 before the next recovery cycle.
Key Takeaways
Bitcoin's price tends to rally leading up to the halving, but the largest gains historically occur in the year following the halving. 📊
Post-bull run drawdowns are severe with past declines ranging from 🔻 -75% to -82%.
While the Pre and Post-Halving theory suggests that the decline starts around 365 days after the halving, the full bear market typically unfolds between ⏳ 486 to 510 days post-halving. This aligns with the ⛓️ 70,000-block mark post-halving, as Bitcoin halvings occur approximately every 210,000 blocks. This means that while the peak may occur within a year after the halving, the deep bearish phase historically becomes evident around 1.3 to 1.4 years after the halving, reinforcing the long-term cyclical nature of Bitcoin’s market trends 🔄.
Final Thoughts
Bitcoin halving events are pivotal moments in the crypto market cycle 🔥. The data suggests that 2025 could see significant gains, but we should also be prepared for the inevitable correction that follows 📉.
What are your thoughts on the upcoming cycle? Share your insights in the comments!
Disclaimer
This article is for informational and educational purposes only and does not constitute financial, investment, or trading advice. The historical performance of Bitcoin halving cycles does not guarantee future results, and past trends may not necessarily repeat. Cryptocurrency markets are highly volatile, and investing in Bitcoin or any other asset carries risks, including the potential loss of capital.
Readers should conduct their own research, assess their risk tolerance, and consult with a licensed financial advisor before making any investment decisions. The information provided is based on publicly available data and historical observations, which may be subject to change.
Sources:
Nakamoto, S. (2008). Bitcoin: A Peer-to-Peer Electronic Cash System.
Bitcoin block time and halving data: Blockchain.com
Historical Bitcoin price data: CoinMarketCap
Bitcoin halving cycles and trends: Messari
Market performance metrics: Glassnode
By reading this article, you acknowledge that you are solely responsible for your own financial decisions and that the author assumes no liability for any losses incurred from trading or investing. 🚀

Do you see a triple top or what? Hm.. Not sure how to interpret it. There is a tripple top and lower high... Oh dear.. express elevator to.. ?

Double Top Pattern – A bearish reversal signalThe Double Top is one of the most well-known bearish reversal patterns in technical analysis. It signals a potential trend change from bullish to bearish and can provide traders with strong shorting opportunities when confirmed.
How It Works:
1- Formation: The price reaches a resistance level twice, failing to break higher, creating two peaks at a similar level.
2- Neckline Break: After the second peak, the price falls to the previous support level (neckline). If this level is broken, it confirms the pattern.
3- Bearish Confirmation: A breakdown below the neckline often leads to a strong downward move, as buyers lose control and selling pressure increases.
Key Trading Strategy:
✅ Entry: Enter a short position once the neckline support is broken.
✅ Stop Loss: Set above the second peak to minimize risk.
✅ Profit Target: The expected price drop is usually the same distance as the height of the pattern (from peak to neckline).
In the chart above, we can see a clear Double Top formation in the NASDAQ 100. After failing twice at resistance, the price broke support, confirming a bearish trend reversal.

Short AUDUSD The Perfect Storm: Stagflation, GeopoliticsIn a world increasingly defined by geopolitical volatility and economic uncertainty, a perfect storm is brewing, casting a long shadow over the Australian dollar. The confluence of persistent stagflationary pressures, escalating trade tensions, and a resurgent U.S. dollar is creating a formidable headwind for the AUDUSD pair. This article delves into the intricate web of factors driving this bearish sentiment, offering a comprehensive analysis for macro traders and financial viewers seeking clarity amidst market turbulence.
The Stagflationary Grip: A Global Economic Quagmire
The global economic landscape is ensnared in a precarious dance between "sticky" inflation and a palpable slowdown. Core Personal Consumption Expenditures (PCE) remains stubbornly elevated, while Producer Price Index (PPI) figures signal continued upward pressure on consumer prices. This persistent inflation, coupled with a weakening housing market, declining consumer confidence, and a sharp contraction in global trade activity (as evidenced by the plummeting Shanghai and China Containerized Freight Indices), paints a stark picture of a "Stagflationary Weakness."
www.census.gov
The Federal Reserve finds itself trapped between a rock and a hard place, grappling with the unenviable task of taming inflation while averting a looming recession. Policy missteps are increasingly probable, further amplifying market anxieties.
Geopolitical Fault Lines and Trade Wars: Fueling the Fire
Adding to the economic woes are escalating geopolitical tensions and trade disputes. The contentious US-Ukraine situation, heightened US-China strategic competition (including technology decoupling and potential military tensions in the South China Sea), and the ever-present threat of cyberattacks are creating an environment of heightened risk aversion.
President Trump's aggressive tariff policies, targeting Canada, Mexico, and China, have ignited fears of retaliatory measures and further disruptions to global trade flows. The market's reaction has been swift and decisive, with the S&P 500 experiencing consecutive weekly declines, reflecting growing investor unease.
The AUDUSD Under Siege: A Technical and Fundamental Breakdown
Against this backdrop, the AUDUSD pair is experiencing a decisive bearish breakdown. The U.S. dollar (DXY), fueled by its safe-haven appeal and the prevailing risk-off sentiment, is exhibiting robust strength, targeting 109.900. This dollar resurgence is exerting significant downward pressure on the risk-sensitive Australian dollar.
Gaining Traction Amidst Global Uncertainty
The AUDUSD has decisively breached the critical 0.64000 level, signaling a clear shift in market sentiment. While rising commodity prices, particularly in energy, have historically provided support for the AUD, the current environment is unique. Geopolitical risks and global economic uncertainties are overshadowing the positive impact of rising commodity prices.
Technical indicators, such as the Relative Strength Index (RSI) and the Moving Average Convergence Divergence (MACD), confirm the bearish momentum. The 20-day, 50-day, and 200-day moving averages are all trending downwards, reinforcing the bearish outlook.
Key Support Zone and Outlook:
We have identified a key support zone between 0.61435 and 0.60838. This zone represents a potential area of consolidation or a temporary pause in the downtrend. However, given the strong bearish momentum and the prevailing fundamental factors, we anticipate a continued downward trajectory.
Impact of Strong Dollar and Risk Aversion"
Traders should closely monitor the DXY and global risk sentiment for further confirmation of the bearish trend. Any sustained break of the 0.64000 level would confirm the current outlook.
The AUDUSD pair is currently navigating a perfect storm of stagflationary pressures, geopolitical risks, and a resurgent U.S. dollar. This confluence of factors has created a compelling bearish outlook, with technical indicators and fundamental analysis aligning to support continued downward momentum.
In this environment, vigilance and a deep understanding of the global macroeconomic landscape are paramount. Traders must remain attuned to the evolving geopolitical and economic narratives, adapting their strategies to navigate the turbulent waters of the current market. FX:AUDUSD CAPITALCOM:DXY

EUR/USD Rejection at Key Resistance – Bearish Drop Incoming?EUR/USD 4H Chart Analysis 📉🔥
Key Observations:
Resistance Zone (Supply Area) 🚨
Price has tested a strong resistance level (marked by the shaded box) near 1.0500.
Multiple rejections in this area suggest selling pressure is strong.
Potential Reversal Setup 🔄
The price has wicked into resistance and started showing weakness.
A lower high structure could be forming, indicating a possible trend shift.
Bearish Outlook 🐻📉
A break below recent support would confirm a sell-off targeting the lower price range.
The chart suggests a potential move towards 1.0350 - 1.0300 levels.
The 200 EMA (1.0425) is acting as dynamic support, but a break below it will accelerate the drop.
Liquidity Grab & Stop Hunt 🎯
Price action could have trapped buyers before reversing.
A potential stop-loss hunt above the previous highs before a drop.
Trading Plan 💡
✅ Sell Bias: Look for confirmations like bearish engulfing candles or break below 1.0450.
❌ Invalidation: A clean breakout above 1.0510 cancels the bearish setup.
🎯 Target Levels: 1.0350, 1.0300.
🔥 Final Verdict: Bearish setup forming. Watch for breakdown confirmation! 🚀


Correction period of BTCAs of now i can see here in 1D chart market has broke its FIB level (0.236) 87,500$ , so there is a high probability that it may touch its next level which is (0.382) 73,750$ after its retest (91,000$ - 87,000$) region. After that market may show a NEW HIGH, but for that it should respect its next level (0.382) 73,750$. Which is also it's weekly Support level.
This is my opinion which may differ from yours.
Thank you.

The Bearish Pennant – A powerful continuation pattern!The Bearish Pennant is a classic continuation pattern that signals the market is likely to resume its downtrend after a short consolidation. It consists of two key components:
🔻 The Flagpole – A strong, impulsive move downward, indicating high selling pressure.
🔻 The Pennant – A brief consolidation with lower highs and higher lows, forming a small symmetrical triangle. This represents a temporary pause before the next leg down.
How to trade it?
1- Identify a sharp downward move (the flagpole).
2- Wait for price consolidation within the pennant.
3- A breakout below the pennant’s lower trendline confirms continuation.
4- Target = The length of the flagpole projected downward from the breakout point.
Why does this happen?
After a strong downward move, some traders take profits, causing consolidation. However, when sellers regain control, the trend resumes with force, leading to another leg down.
⚠️ Pro Tip: Look for increasing volume on the breakdown to confirm the move!

#1000RATSUSDT maintains bearish momentum📉 SHORT BYBIT:1000RATSUSDT.P from $0.01823
🛡 Stop Loss: $0.01855
⏱ 15M Timeframe
✅ Overview:
➡️ BYBIT:1000RATSUSDT.P is in a downtrend after rejecting the descending trendline, confirming buyer weakness.
➡️ Volume Profile suggests that the main liquidity (POC) is positioned at $0.01938, reinforcing selling pressure.
➡️ The Head and Shoulders pattern strengthens the bearish case, and a break below $0.01823 will trigger further decline.
➡️ The main downside targets are in the $0.01800 – $0.01764 range, where profit-taking may occur.
⚡ Plan:
➡️ Short entry upon breaking $0.01823, confirming the bearish scenario.
➡️ Stop-Loss at $0.01855—placed above the nearest resistance to minimize risk.
➡️ Main targets: $0.01800, $0.01780, and $0.01764, where downside movement may slow down.
🎯 TP Targets:
💎 TP 1: $0.01800
🔥 TP 2: $0.01780
⚡ TP 3: $0.01764
🚀 BYBIT:1000RATSUSDT.P maintains bearish momentum — expecting further downside!
📢 BYBIT:1000RATSUSDT.P remains weak, and a breakdown below $0.01823 could accelerate the decline.
📢 Watch for price reactions near $0.01764, where a slowdown or bounce may occur.

#BTCUSDT maintains bearish momentum — expecting further decline!📉 SHORT BYBIT:BTCUSDT.P from $94,547.0
🛡 Stop Loss: $95,027.0
⏱️ 1H Timeframe
✅ Overview:
➡️ BYBIT:BTCUSDT.P is forming a downtrend after testing the resistance zone.
➡️ Volume Profile suggests that the main liquidity (POC) is positioned above the current price ($96,258.3), indicating volume distribution in favor of sellers.
➡️ A break below $94,830.7 will confirm buyer weakness and open the potential for further decline.
➡️ The $94,286.0 and $94,090.0 levels may act as profit-taking zones, while $93,900.0 is a key support level.
⚡️ Plan:
➡️ Short entry upon breaking $94,547.0, confirming further downside.
➡️ Stop-Loss at $95,027.0—placed above the nearest liquidity level to minimize risk.
➡️ Main targets are in the $94,286.0 – $93,900.0 zone, where a bounce is possible.
🎯 TP Targets:
💎 TP 1: $94,286.0
🔥 TP 2: $94,090.0
⚡️ TP 3: $93,900.0
🚀 BYBIT:BTCUSDT.P maintains bearish momentum—expecting further decline!
📢 BYBIT:BTCUSDT.P continues its downward movement. If the price consolidates below $94,547.0, this will strengthen selling pressure and accelerate movement toward $93,900.0.
📢 However, buying activity may emerge at this level, so partial profit-taking is recommended.

egld setup"🌟 Welcome to Golden Candle! 🌟
We're a team of 📈 passionate traders 📉 who love sharing our 🔍 technical analysis insights 🔎 with the TradingView community. 🌎
Our goal is to provide 💡 valuable perspectives 💡 on market trends and patterns, but 🚫 please note that our analyses are not intended as buy or sell recommendations. 🚫
Instead, they reflect our own 💭 personal attitudes and thoughts. 💭
Follow along and 📚 learn 📚 from our analyses! 📊💡"

CVNA Short: Catalysts Favor a Move to the DownsideCVNA is a used car marketplace, which has enjoyed nearly a 7000% rally from lows. The company has turned around and has been a remarkable story, however given the recent earnings announcement selloff, a Gann based analysis favors a bearish trend change at least for now. Although the earnings report beat expectations, this could mark a local top for Carvana , as investors may be speculating that this is the best that Carvana can do revenue wise for now and that increasing growth rates may be hard to sustain.
As we can see here, the price has taken out the key $268.00 price support level aka, it's original 52 week high from Nov 25th. The price as of now is currently $256. The current Gann support levels are as follows: $250 psychological support level and the $256 Trendline Support level. Although we could see a bounce from the trend line and support level, I prefer an extended retracement to the $230 levels for 3 reasons:
1. Today is current day 47 of the rally from the 52 week lows of Jan 3rd . According to typical rally/reaction periods, the trend be shifting (the 45 day rally point is indicated by a red vertical line). So far this is validated by the 52 week daily close high of Feb 18th . Unless we get a move 3 points above this $291 high, we should not be worried about a possible 60-65 day rally.
If a 60-65 day rally is in fact the case, this would mark a top for CVNA at Mar 5th and Mar 10th in that case. (Marked by our red vertical lines)
2. We have a break below the old 52 week high support level of $268
3. We have a lack of strong support until the Gann 50% midpoint between the 52 week highs of Feb 19th and Jan 3rd . This midpoint noted by the horizontal blue line is around $234
STOP LOSS: $271
Set a stop loss around 3 points above the Support/Resistance level of $268 that we mentioned.

#LAYERUSDT remains weak — expecting further downside!This is a quick trade designed for a fast entry and exit with profit.
📉 SHORT #LAYERUSDT from $0.6780
🛡 Stop Loss: $0.6840
⏱ 15M Timeframe
✅ Overview:
➡️ #LAYERUSDT remains in a downtrend, trading near $0.6780, which could act as a short entry point.
➡️ POC (Point of Control) at $0.7316 confirms a high liquidity zone above the current price, indicating strong selling pressure.
➡️ The price failed to hold above the previous consolidation zone and continues downward.
➡️ If the price breaks below $0.6780, a further decline is expected, targeting lower support levels.
⚡ Plan:
➡️ Enter short upon breaking $0.6780, confirming the downward trend.
➡️ Risk management via Stop-Loss at $0.6840, protecting against a false breakout.
🎯 TP Targets:
💎 TP1: $0.6690
🚀 #LAYERUSDT remains weak—expecting further downside!
📢 #LAYERUSDT is under strong selling pressure. If the price breaks $0.6780, increased momentum may push it toward $0.6690. However, if it reclaims $0.6840, a short-term rebound could occur.

#SPELLUSDT continuation of the downtrend📉 SHORT BYBIT:SPELLUSDT.P from $0.0009866
🛡 Stop Loss: $0.0010430
⏱ 1H Timeframe
✅ Overview:
➡️ BYBIT:SPELLUSDT.P remains in a downtrend, forming lower highs and lower lows. The price failed to hold above $0.0010000, signaling weak buying momentum.
➡️ POC at $0.0010250 suggests that major volume accumulation is above the current price, reinforcing the bearish outlook.
➡️ If the price stays below $0.0009866, a continuation towards $0.0009485 and $0.0008901 is expected.
➡️ Volume remains moderate, indicating declining demand and a likely continuation of the downtrend.
⚡ Plan:
📉 Bearish Scenario:
➡️ Enter SHORT from $0.0009866 if price confirms rejection at resistance.
➡️ Risk management with Stop-Loss at $0.0010430, above key resistance.
🎯 TP Targets:
💎 TP1: $0.0009485 — first profit-taking level.
🔥 TP2: $0.0008901 — major support zone.
🚀 BYBIT:SPELLUSDT.P Expecting a continuation of the downtrend!
📢 BYBIT:SPELLUSDT.P remains under selling pressure. If the price holds below $0.0009866, further downside movement towards $0.0009485 and then $0.0008901 is expected.
📢 However, if the price reclaims $0.0010430, the bearish scenario could be invalidated, leading to a potential upward correction.
