PLTR WAIT FOR THE CRACK!The double top is complemented with a bearish rising wedge stuck in a rising bearish F flag.
A straightforward, short setup if you wait for the CRACK!
Shortsetup

GBP/USD manipulation going on right now ??gbpusd had a good rise the last few weeks/months, now its time to pay attention.
the price is now ranging,. let me tell you what i think.
a little bit higher there is a imbalance in the chart. for me and many others thats a reason to short.
why do i think manipulation is going on?
for the big people in order to go short they need to attract buyers, so how do they do that? they go long, they build up long orders to attract more buyers so the price doesnt go down and the shorts can get filled. thats what happening right now in my opinion. (i can be wrong)
also the rsi is overbought (indicating downside could come )
in my opinion the price will be ranging for a week of 2, after that is wil go a bit higher to eventually come down big time , (like 5% or more)
here is the setup i will take.
no financial advice, just my thoughts

EUR/USD Rejected at Resistance – Bearish Setup in Motion!Timeframe: 15-Minute (M15)
Designed for short-term or intraday trades.
Entry Zone (Short):
Price is reacting to a fresh supply zone around 1.13260–1.13280.
Stop Loss:
Just above the supply zone, near 1.13280 (tight SL setup).
Bearish Reaction:
Price rejected resistance with a wick and bearish body — strong confirmation of selling pressure.
Target Zone (Demand):
A wide green demand area is marked at 1.12810–1.12830, providing a solid take-profit level.
Structure Bias:
Current formation shows lower highs and clear resistance respect — indicating bearish momentum.
Risk-to-Reward Ratio:
Strong RRR (more than 2:1) – minimal risk for decent reward.

NFLX Bearish Setup!This is a simple setup that almost anyone can read—a Head & Shoulders at the top signaling a reversal pattern.
Contrary to popular belief H&S are continuation patterns if they are not at a top.
The only other time H&S are reversal patterns is if the chart has multiple H&S everywhere.
Time for bulls to take their money and RUN!!! The fun ride is over for a while. Time to go home. ((
CAUTION!
Click BOOST, follow subscribe. Let me help you navigate these crazy markets. ))

Trump's latest tariff announcement weakens the dollar🔔🔔🔔 USD/CHF news:
➡️ US President Donald Trump on Sunday announced a 100% tax on films produced outside the country. A move to reimpose tariffs by President D. Trump. This move, once again raised concerns about the Trump administration's tariff policy. At the same time, the uncertain context of potential trade agreements between the United States and its trading partners has not been completed, causing the USD bulls to decrease. The US dollar fell again amid trade uncertainty and repositioning before the Fed.
Personal opinion:
➡️ The trade agreements are still uncertain and it is positive only at the level of cooling down between the parties involved, causing the USD to decrease.
➡️ Analysis based on important support resistance and Fibonacci levels combined with EMA to come up with a suitable strategy
Plan:
🔆Price Zone Setup:
👉Sell USD/CHF 0.8256 - 0.8270
❌SL: 0.8296 | ✅TP: 0.8200
FM wishes you a successful trading day 💰💰💰

Stay within the trend line and wait for US NFP news🔔🔔🔔 EUR/USD news:
➡️ EUR/USD is climbing above the 1.1300 level during Friday’s European session, rebounding from a three-day losing streak that had pushed the pair to its lowest level in over two weeks. The recovery is being driven by profit-taking on the US dollar as traders adjust their positions ahead of the upcoming US Non-Farm Payrolls (NFP) report.
Personal opinion:
➡️ EUR/USD will remain in a trending position after a significant increase today and await the results of the US NFP data
➡️ Analysis based on resistance - support levels and trend lines combined with EMA to come up with a suitable strategy
Personal plan:
🔆Price Zone Setup:
👉Sell EUR/USD 1.1345 - 1.1355
❌SL: 1.1390 | ✅TP: 1.1300
FM wishes you a successful trading day 💰💰💰

Cold shower for bitcoinAs I mentioned earlier — when gold cools down, Bitcoin tends to rise. And when gold climbs, Bitcoin usually takes a breather. Don’t forget this dynamic.

$MSTR regretting the missed shortJust steadily up the last month. Reversal candles coming in. Wish I had puts. I’m an idiot. Retrace to $350-$360.

Master HBAR with Fibonacci: The Golden Pocket BlueprintSince topping out at $0.20151, HBAR has spent the last nine days in a corrective pullback. Digging into a rich confluence of supports that offers a long trade setup. Here’s how to spot the high‑probability entries, manage your risk, and scale out for maximum reward.
Current Context
Two days ago, price was firmly rejected at the weekly open ($0.19029) right alongside the anchored VWAP drawn from the $0.28781 swing high.
HBAR now trades below the monthly open ($0.18210), the weekly open ($0.19029), and the daily open ($0.18024), sitting at about $0.177.
Just beneath today’s level lies the swing low at $0.17543. Breaching this could flush out stops before any meaningful bounce.
The Golden Support Zone
All signals converge between $0.170 and $0.1725:
The anchored VWAP from the $0.12488 low sits at around $0.17.
The 0.618 fib retracement of the $0.15396→$0.20239 move falls at $0.17246. Just under the swing low where the liquidity lies.
The secondary 0.666 fib retracement lands at $0.17014, reinforcing that floor.
Volume‑profile analysis of the past 27 days pins its Point of Control right at $0.17, great confluence with the anchored VWAP.
This “golden pocket” is your pivot for a low‑risk, high‑probability long.
Long Trade Setup
Ladder buy orders between the swing low ($0.17543) and the 0.666 fib at $0.17014.
Aim to average in around $0.1725.
Place a single stop‑loss just below $0.17
Scaling Your Exits
First Partial Exit at the monthly open ($0.18210). This offers roughly a 2:1 R:R.
Second Exit Zone around the weekly open and VWAP resistance (~$0.19) for about a 3:1 R:R.
Final Target at the 0.618 fib retracement of the entire down‑wave (from $0.28781 to $0.12488) near $0.2256. An astounding 10:1 payoff for the patient trader.
Keep in mind a potential false‑break (SFP) at $0.17543: if price briefly dips below then snaps back up, with increased volume.
Short Trade Setup
For traders looking to play the downside from the “golden pocket” flip, here’s a clear short strategy:
Entry Zone: Ladder short entries between the 0.618 fib at $0.22557 and the 0.666 fib at $0.23339.
Confluence: The 0.666 level aligns perfectly with the negative 0.618 fib from the prior swing, creating a resistance zone.
Stop‑Loss: Place your stop just above $0.23339, invalidating the confluence.
Take‑Profit: Target a return to around $0.206, where you can lock in gains as HBAR retests its previous high.
By scaling into shorts across that fib band, you balance your risk and capture the high‑odds reversal offered by stacked Fibonacci confluence. Let the golden pocket guide both your longs and shorts!
Key Takeaways
Confluence is king: VWAPs, Fibonacci retracements, Liquidity and volume‑profile all align in the $0.170–$0.175 zone.
Risk control: One stop‑loss under $0.17 protects the entire laddered entry.
Tiered targets: Small wins at $0.182, larger as you clear $0.19, and a big payoff if HBAR rallies toward $0.225. Trail your SL accordingly.
Patience pays: Wait for price to enter the golden pocket, avoid chasing!
With these confluences lining up and clear levels to work from, HBAR’s next high‑probability long setup is staring you in the face. Trade smart, size appropriately, and let the market reward your discipline.
Happy Trading!
___________________________________
If you found this helpful, leave a like and comment below! Got requests for the next technical analysis? Let me know.

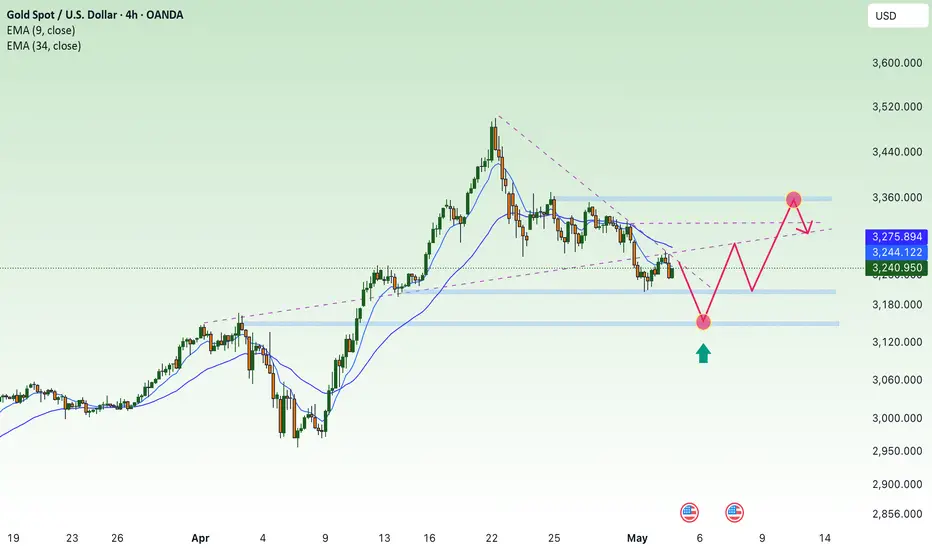
Positive tariff news favors lower gold prices - wait for FOMC🔔🔔🔔 Gold news:
➡️ Gold prices ended the week down around 2.50% as improved risk appetite - driven by easing trade tensions and a strong US jobs report - prompted investors to book profits ahead of the weekend.
➡️ Over the weekend, China's Ministry of Commerce said the US was open to trade and tariff talks, reaffirming that Beijing's door to dialogue remains open.
➡️ Bullion prices continued to fall after April's non-farm payrolls unexpectedly rose, beating expectations, while the unemployment rate remained unchanged from March. XAU/USD fell to an intraday low of $3,222 as traders reduced expectations for four rate cuts from just three now.
Personal opinion:
➡️ There is still no strong enough momentum for gold to continue rising and must wait for the upcoming FMOC. Therefore, gold will maintain a short-term downtrend in the beginning of next week
➡️ Note: any information about the US-China trade war is given top priority
➡️ Analysis based on resistance - support levels and trend lines combined with EMA to come up with a suitable strategy
Plan:
🔆Price Zone Setup:
👉Buy Gold 3293 - 3296
❌SL: 3190 | ✅TP: 3200 - 3205 - 3210
👉Sell Gold 3255 - 3258 (Scalping)
❌SL: 3263 | ✅TP: 3251 - 3246 - 3240
FM wishes you a successful trading week 💰💰💰

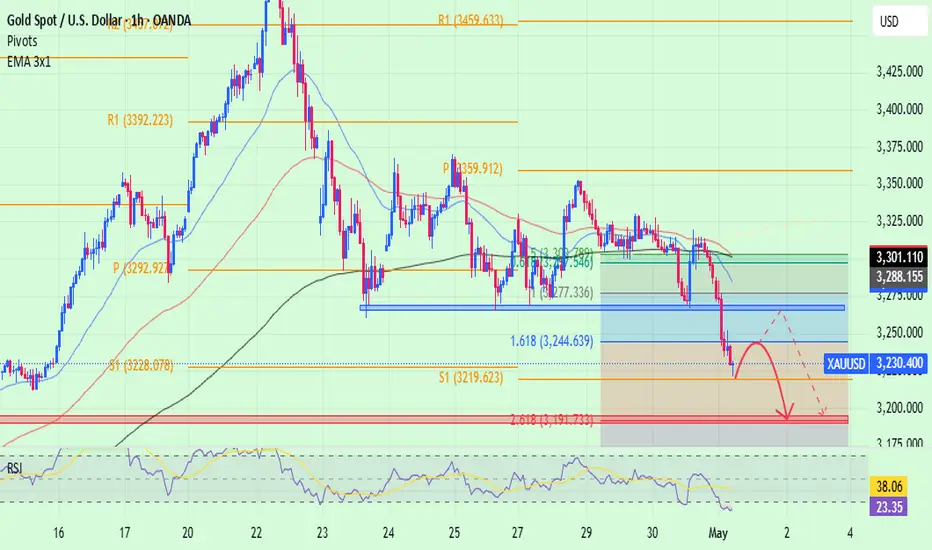
move below 3273-3270 zone and wait for reaction from US NF news🔔🔔🔔 Gold news:
➡️ Gold prices are holding modest gains heading into the European session, though bullish conviction remains lacking, and the metal continues to trade below the key $3,265–$3,2703 support-turned-resistance zone. Meanwhile, the US dollar has come under some selling pressure, snapping a three-day winning streak after hitting a three-week high.
➡️ A mix of factors is discouraging traders from making aggressive bullish bets, thereby capping further upside in the precious metal. Investors remain hopeful for easing trade tensions between the United States and China—the world’s two largest economies. This optimism supports a broader risk-on sentiment, which in turn undermines demand for safe-haven assets like gold.
Personal opinion:
➡️ The 3265–3273 zone is a strong resistance zone for gold. A break above this zone would mean the end of the short-term downtrend and vice versa. Therefore, buyers and sellers will be aggressive to secure this zone. Today's US NF news will be a strong driving force for gold prices before the tariff information appears and covers the market.
➡️ Analysis based on resistance - support levels and trend lines combined with EMA to come up with a suitable strategy
Personal Plan:
🔆Price Zone Setup:
👉Buy Gold 3202- 3205
❌SL: 3198 | ✅TP: 3210 - 3215 – 3220
👉Sell Gold 3270 - 3272
❌SL: 3276 | ✅TP: 3266 - 3261 – 3255
FM wishes you a successful trading day 💰💰💰

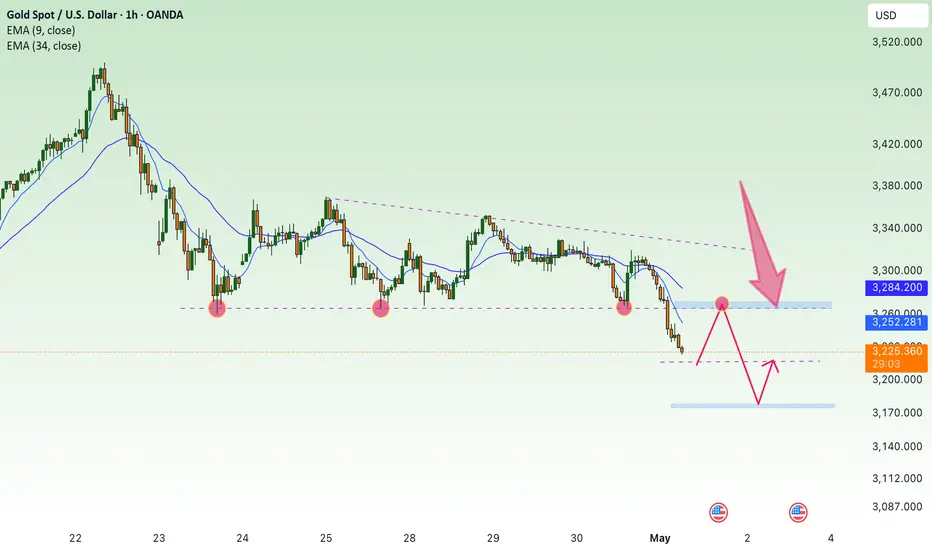
Lack of bullish momentum, gold price waits, slight decrease✍️ NOVA hello everyone, Let's comment on gold price next week from 05/05/2025 - 05/09/2025
🔥 World situation:
Gold (XAU/USD) slipped by more than 0.35% on Friday and is on track to close the week with a decline exceeding 2.5%, as easing trade tensions and upbeat US labor market data boosted investor risk appetite. This shift in sentiment encouraged profit-taking ahead of the weekend, weighing on the safe-haven asset. At last check, XAU/USD was trading around $3,226, pulling back from an intraday peak of $3,269.
Adding to the improved market mood, China’s Commerce Ministry confirmed that the US has shown a willingness to resume discussions on tariffs, while reiterating that Beijing remains open to dialogue.
🔥 Identify:
Gold price continues to adjust down, lacking momentum to increase price. around price range 3200 - 3350
🔥 Technically:
Based on the resistance and support areas of the gold price according to the H4 frame, NOVA identifies the important key areas as follows:
Resistance: $3285, $3316, $3355
Support : $3202, $3155
🔥 NOTE:
Note: Nova wishes traders to manage their capital well
- take the number of lots that match your capital
- Takeprofit equal to 4-6% of capital account
- Stoplose equal to 2-3% of capital account
- The winner is the one who sticks with the market the longest
BTC - “Bull Market” OR Bearish Retest on HTF? Bitcoins excessive rise for the previous two years brings concern for the mechanics of this market. Moving only up for so long leaves much liquidity in the form of long position stop losses below the current price.
These stop loss orders, or leveraged sell orders, are an explosive chain reaction ready to set off.
Observe these two trendlines and copy them to your charts. These two bearish trendlines (in my view) are why bitcoin has truly been rising so freely.
Moves up in the form of bearish retests are fast and fluid, only after the rejection does price fall aggressively.
I anticipate two scenarios here in the realm of bearish ideas:
Possibility 1 - 30% Probability
96,700 to 34,500
34,500 retrace to 68,500
68,500 to 7,000
Possibility 2 - 70% Probability
96,700 to 43,000
43,000 retrace to 60,000
60,000 to 7,000
Note that both of these possibilities end with 7,000. I’m mapping out two routes that take us there, using confluences with trendlines, volume profiles, liquidity mapping, and common sense.
Be mindful of this possibility. And protect yourself accordingly.

AUD/CAD Short🔻 AUD/CAD Short Setup (High-Probability Rejection Play)
🔹 Entry Zone:
0.8990 – 0.9060
Ideal entry: 0.9020 (mid-zone if price stalls or forms a wick)
🔺 Stop Loss:
0.9120 (above all 2023–2024 highs and structure traps)
This SL protects you from a true breakout
🎯 Targets:
TP1: 0.8800 (prior swing lows / first clean zone)
TP2: 0.8650 (mid-range support with confluence)
TP3 (extended): 0.8500 (range bottom — aggressive but clean if momentum kicks in)

BTC Shortwe in 4h sibi + week -breaker
we are have 4h - braker
Price need rebalance zone its
-week bisi
-day bisi
-4h bisi
Below we are have month bisi
Lets see week bisi can be true support and move price to new Higher High or this make inversion
Now I look short for 91060

SUI - Leveraging Fibonacci & Elliott for Precision TradesSUI’s movement is rapid, sharp swings—both up and down. In volatile conditions like this, we aim 0.702–0.786 fib retracements (and occasionally 0.886 in harmonic contexts) for high‑probability entries. Below is a clear, Elliott-focused breakdown of the current setup and both long and short trade plans.
Before diving into the charts, let’s cover the basics of Elliott Wave Theory. Elliott Wave Theory provides a roadmap for market psychology by dividing price action into two distinct phases:
1. Impulse Phase (Waves 1–5)
Wave 1: The spark that ignites a new trend as early adopters push prices beyond the prior range.
Wave 2: A corrective pullback that tests the strength of the emerging trend, often retracing 38–61.8%.
Wave 3: The powerhouse wave—typically the longest and most dynamic—driven by broad market participation and often extending to key Fibonacci levels (1.618, 2.618).
Wave 4: A consolidating correction that digests gains and builds the base for the final thrust; it must not overlap Wave 1 territory in a classic impulse.
Wave 5: The final leg of the advance, often fueled by last bursts of optimism and weaker hands.
2. Corrective Phase (Waves A–B–C)
Wave A: Initial counter-trend reaction as profit-taking begins.
Wave B: A deceptive retracement back toward the trend, frequently trapping traders.
Wave C: The concluding leg of the correction, which typically tests or breaks the low of Wave A before the next cycle begins.
Key Points:
Impulse waves showcase momentum and structural clarity, often aligning with Fibonacci extensions.
Corrective waves follow Fibonacci retracements (38.2%, 50%, 61.8%), offering optimal entry points.
Wave 3 is seldom the shortest; Wave 4’s complexity sets the stage for Wave 5’s final push.
In the current SUI structure:
Wave 1 ignited the initial rally.
Wave 2 delivered a healthy retracement, a pullback close to the 0.618 fib, setting the stage for stronger momentum.
Wave 3 roared to a powerful peak topped at the 2.618 extension ($3.875)
Now, we’re deep into Wave 4, likely an ABC corrective pattern. This pause is critical—it gathers energy before the final push of Wave 5. Below is a clear breakdown of each wave, big-picture confluences, and trade setups.
🚀 Elliott Wave Overview
1. Wave 1 & Wave 2
Wave 1: Quick surge from $2.4175 → $2.75, setting initial momentum.
Wave 2: Pulled back close to the 0.618 fib, creating a solid launchpad.
2. Wave 3: The Power Move
Peak: Hit the 2.618 extension of Wave 1→2 and aligned with the –2 extension of Wave 1.
Significance: In strong bull markets, a run to the 2.618 extension often precedes a meaningful pullback. Here, Wave 3’s exhaustion suggests a retrace toward the 38.2% Fib of that advance—our ideal Wave 4 entry zone.
3. Wave 4: The Correction
All eyes on the $3.17 level—the projected 1:1 extension of A→B and 0.382 fib retracement of Wave 3. This confluence zone is yet to be tested and could offer an ideal Wave 4 entry.
ABC Pattern: Currently working on Wave C.
4. Wave 5: The Finale
Target Zone: $4.00–$4.35, with strong focus at $4.31
Extension Levels:
1.133 → $3.9695 aligns with the 0.618 fib retracement.
1.272 → $4.0683 is close to the weekly resistance level.
1.412 → $4.1678 alings with the 0.666 fib retracement.
1.618 → $4.3142 alings with the key swing high.
🔑 Key Confluence Levels
Golden Pocket: $3.9739–$4.1492 (90-day retrace).
Speed Fan 0.618: Support around $3.15.
Fair Value Gap:
Psychological: $3.00 major support.
📈 Long Trade Setup
Entry Ladder: $3.25–$3.111 (stack orders to DCA)
Stop‑Loss: $3.07 (just below the 0.786 Fib low)
Profit Targets:
Fib 1.133 at $3.9795 ($4 psychological & partial take‑profit)
Fib 1.272 at $4.0683
Fib 1.412 at $4.1678
Fib 1.618 at $4.3142
Risk:Reward: ~6:1+ (average entry around $3.20 → SL at $3.07 → TP1 at $3.9795)
📉 Short Trade Setup
Entry Zone: $4.00–$4.35 (sweet spot at weekly level/yearly open)
Confirmation: Bearish reversal candle or volume spike down
Stop‑Loss: Above $4.35
Target: $3.77 (near Wave 3 high turned support)
Risk:Reward: ~2:1 (varies with DCA entry)
⚙️ Summary & Game Plan
Primary Bias: Long in the $3.25–$3.111 zone—stack into the 0.382-0.412 fib retracement entries with tight SL, aiming for the $4.00–$4.30 upside zone.
Alternate Bias: Short on a clear rejection within $4.00–$4.35, targeting $3.77 or lower.
Risk Management: Keep stops tight to maximize R:R.
Patience & Confirmation: Wait for price to reach these zones and show reversal signals (price action, volume, patterns) before committing.
All set—now let SUI’s swings unveil the opportunities. Sit tight, follow your plan, and let patience pay its dividend.
Happy Trading!
____________________________________
If you found this helpful, leave a like and comment below! Got requests for the next technical analysis? Let me know.

SOL Analysis Deep Dive: Identifying Optimal Entry and Exit ZonesYesterday, SOL gave a sharp downside shakeout, dropping from the weekly open at $147.98 (perfectly retested) down to the 0.5 Fib retracement of the swing at $140.25. Here’s a structured breakdown of the key levels, trade setups, and R:R profiles for both longs and shorts:
🔑 Key Levels & Confluences
1. Higher-Timeframe Opens
Weekly Open & Retest: $147.98 – pivoted price before the drop
Monthly & Prior-Day Open Cluster: $147.98–$146.31 – strong support confluence zone
2. Fibonacci Support Zones
0.5 Fib at $140.25 – primary mean-reversion entry
0.786 Fib (smaller wave) at $138.78 – secondary, deeper support
3. Order Block
Daily Bullish Order Block at $139.87 – just below 0.5 Fib, adds extra support
4. Volume-Weighted Average Price
Anchored VWAP (from ATH $295.83) at ~$166.45 – key upside resistance
5. Market Profile Value Areas (10-Day Range)
Value Area High (VAH) at ~$153.00 – overhead resistance confluence
Value Area Low (VAL) at ~$145.75 – underpins support
📈 Long Trade Setups
1. 0.5/0.786 Fib + Daily Bullish Order Block
Entry: $141-138.78
Stop-Loss: $137.5
Target: $165 (anchored VWAP / Fib zones)
R:R ≈ 9:1
2. Higher-Timeframe Open Cluster
Entry Zone: $147.98–$146.31(monthly/weekly open)
Stop-Loss: $142.5
Target: $165
R:R ≈ 3:1
• Why these levels? The 0.5 Fib is a classic mean-reversion zone, bolstered by the daily order block. The $147–146 zone ties together multiple opens (weekly, monthly, prior-day), offering a solid demand area if price retraces back up.
📉 Short Trade Setup
Trigger: Rejection / swing-failure around $153.4
Entry: $153.4
Stop-Loss: $154.3
Target: Weekly/Monthly open (~$147)
R:R ≈ 6:1
• Low-risk short: A clean rejection at the recent high lets you define risk tightly above the swing, aiming to capture the retrace back to the opens.
🎯 Summary & Game Plan
Primary bias: Look for long entries at the 0.5 Fib ($140.25) or the open-cluster zone ($147–146), with targets toward the anchored VWAP at ~$166.
Alternate bias: A short on clear rejection from $153.4, targeting the opens as support.
Risk management: Keep stops tight (SL below $137.5 or above $154.3) to maximize R:R on your favored setups.
Volume & Price Action: Confirm entries with an uptick in volume or bullish price structure (for longs) or swift failure patterns (for shorts).
Now it’s a waiting game! Let price revisit these zones, watch for confirmation signals, and then scale into your chosen side. Good luck! Don't chase, let the charts come to you!
____________________________________
If you found this helpful, leave a like and comment below! Got requests for the next technical analysis? Let me know.

NF fluctuates in a downward trend⭐️GOLDEN INFORMATION:
China’s Ministry of Commerce announced Friday that the United States has recently initiated communication through official channels, expressing interest in reopening talks on tariffs. Beijing is currently evaluating the proposal, fueling optimism that a resolution to the prolonged tariff standoff between the world’s two largest economies may be on the horizon.
This renewed hope for a breakthrough in trade negotiations helped lift the US Dollar to a three-week high on Thursday, pressuring Gold prices down toward the $3,200 mark. However, bullish momentum for the USD remains tempered as markets increasingly price in the likelihood of more aggressive rate cuts by the Federal Reserve, especially with the closely watched US Nonfarm Payrolls data looming.
⭐️Personal comments NOVA:
NF news volatility is certain, with the big accumulation from last week. Gold price has confirmed the trend after breaking 3267, will fluctuate in a downtrend below 3200
⭐️SET UP GOLD PRICE:
🔥SELL GOLD zone : 3312- 3310 SL 3317
TP1: $3290
TP2: $3280
TP3: $3270
🔥BUY GOLD zone: $3175 - $3177 SL $3170
TP1: $3185
TP2: $3200
TP3: $3210
⭐️Technical analysis:
Based on technical indicators EMA 34, EMA89 and support resistance areas to set up a reasonable SELL order.
⭐️NOTE:
Note: Nova wishes traders to manage their capital well
- take the number of lots that match your capital
- Takeprofit equal to 4-6% of capital account
- Stoplose equal to 2-3% of capital account

SHORT ON EUR/JPYEUR/JPY has created a head and shoulders pattern at a major resistance area.
I will be selling EJ to the pervious swing low / demand level.

Short-term downtrend has formed 🔔🔔🔔 Gold news:
➡️ The US dollar continues to rebound following recent remarks from President Donald Trump, who stated that he has "potential" trade agreements with India, South Korea, and Japan, and expressed high confidence in reaching a deal with China.
➡️ Meanwhile, gold prices have been declining for the third consecutive day as of early Thursday, nearing a two-week low. Trade-related headlines have once again overshadowed US economic data, significantly impacting the traditional safe-haven appeal of gold.
Personal opinion:
➡️ Negative US fundamentals cannot help gold rise after positive signals from the trade war are still the decisive factor. Gold has broken the 3265 zone and turned into a short-term downtrend.
➡️ Analysis based on important resistance - support and Fibonacci levels combined with RSI to come up with a suitable strategy
Personal plan:
🔆Price Zone Setup:
👉Buy Gold 3191 - 3194
❌SL: 3186 | ✅TP: 3199 - 3205 – 3210
👉Sell Gold 3262 - 3265
❌SL: 3270 | ✅TP: 3257 - 3251 – 3245
FM wishes you a successful trading day 💰💰💰
bearish reversal sign after entering overbought zone🔔🔔🔔 GBP/USD news:
➡️ The British Pound edged lower below 1.3400 against the U.S. Dollar during Tuesday’s European session, retreating from a fresh three-year high of 1.3445 reached earlier in the day. The decline came as traders grew increasingly confident that the Bank of England (BoE) will cut interest rates at its May policy meeting. This dovish shift is largely driven by weakening UK inflation expectations and rising concerns over global economic stress.
Personal opinion:
➡️ The USD is showing good signs of recovery during the day, plus not very positive news from GBP. So GBP/USD will maintain its downward momentum in the coming time
➡️ GBP/USD is showing signs of a recovery after reaching the overbought level
➡️ Analysis based on resistance - support levels combined with EMA and trend lines to come up with a suitable strategy
Personal plan:
🔆Price Zone Setup:
👉sell GBP/USD 1.3410 - 1.3400
❌SL: 1.3460 | ✅TP: 1.3345 - 1.3270
FM wishes you a successful trading day 💰💰💰

Gold price weakens, correction 3176⭐️GOLDEN INFORMATION:
Gold’s intraday decline appears partly driven by technical selling pressure after decisively breaking below the key $3,265–$3,260 support zone. However, the US Dollar (USD) struggles to sustain any significant recovery as expectations grow for more aggressive Federal Reserve (Fed) rate cuts—fueled by an unexpected contraction in US GDP and signs of softening inflation. These factors may continue to support demand for the non-yielding precious metal, suggesting that traders should remain cautious before anticipating a deeper pullback from the recent all-time high near $3,500.
⭐️Personal comments NOVA:
Crossing the 3264 mark in the sideways price zone, gold prices continue to weaken.
⭐️SET UP GOLD PRICE:
🔥SELL GOLD zone : 3270- 3272 SL 3277
TP1: $3260
TP2: $3250
TP3: $3240
🔥BUY GOLD zone: $3178 - $3176 SL $3171
TP1: $3185
TP2: $3200
TP3: $3210
⭐️Technical analysis:
Based on technical indicators EMA 34, EMA89 and support resistance areas to set up a reasonable SELL order.
⭐️NOTE:
Note: Nova wishes traders to manage their capital well
- take the number of lots that match your capital
- Takeprofit equal to 4-6% of capital account
- Stoplose equal to 2-3% of capital account
Gold has little momentum to continue rising - continues to fall 🔔🔔🔔 Gold news:
➡️ Gold prices reverse course during Monday’s U.S. trading session, recovering strongly from an intraday low of $3,268.03 to hover around $3,330. In the absence of major macroeconomic data, investors remained focused on trade developments. Mixed headlines regarding U.S.-China trade negotiations stirred some concerns after a quiet start to the day, with cautious optimism leading earlier sessions in Asia and Europe, thereby putting pressure on demand for the U.S. Dollar.
➡️ However, gold struggled to maintain its overnight rebound and faced renewed selling pressure during Tuesday's Asian session. Signs of easing U.S.-China trade worries and optimism about potential trade deals from the U.S. continued to support a risk-on sentiment, weighing on the appeal of the safe-haven metal.
Personal opinion:
➡️ Positive information about tariff negotiations is appearing more and more, and the parties are also easing trade tensions. So the gold price decrease is still maintained or at least difficult to increase further, unless there is a strong enough announcement to push the gold price up
➡️ Analysis based on important resistance - support levels and Fibonacci combined with trend lines to come up with a suitable strategy
Plan:
🔆Price Zone Setup:
👉Sell Gold 3357 - 3360
❌SL: 3365 | ✅TP: 3352 - 3346 – 3340
👉Buy Gold 3270 - 3273
❌SL: 3265 | ✅TP: 3278 - 3283 – 3289
FM wishes you a successful trading day 💰💰💰
