ZEN’s Reversal Zone – Perfect Time to Go Long?ZEN has seen a sharp 78.65% decline from its $46.28 high, dropping over the past 40 days. With six consecutive red daily candles, we’re at a critical point to determine whether a bullish reversal is near or if further downside is ahead. Let's analyse the key support and resistance zones and establish high-probability trade setups.
Support Levels & Confluences
1️⃣ Psychological Support – $10: Price bounced off $10, aligning with the 0.886 Fib retracement.
2️⃣ Trend-Based Fib Extension 0.786 – $11.33: Indicates potential correction completion
3️⃣ Yearly Open from 2021 – $11.61: Acts as a historical support level
4️⃣ Weekly Support at $11.48 (0.618 Fib Retracement): Aligns with the weekly order block ($12.13 - $11.45)
5️⃣ Monthly 21 SMA – $10.86: Aligns with the 0.786 Fib
Long Trade Setups – Laddering Strategy
Long positions can be laddered from $11.48 (0.618 Fib) down to $10.82 (0.786 Fib) for a better cost basis.
Long Entry #1: $11.48 (0.618 Fib Retracement)
Long Entry #2: $11.00 (Mid-range level between fibs)
Long Entry #3: $10.82 (0.786 Fib Retracement)
Stop Loss: Below $10.60
Take Profit: $14 - $15
R:R: 13:1 (for 0.786 Fib entry)
This laddering approach allows for better risk management and capital allocation.
Alternative Long Entry – Confirmation-Based Trade
Entry: If price reclaims $12.11 (Daily Open & Weekly Level) and retests it as support
Stop Loss: Below $11.48
Target: $14 - $15
R:R: 3:1
Resistance Levels & Short Setup
1️⃣ Weekly Open - $14.20
2️⃣ Monthly Level - $14.85
3️⃣ Weekly Level - $15.12
4️⃣ Key Resistance - $15
5️⃣ 0.5 Fib Retracement from Downward Wave - $15.25
6️⃣ Weekly 21 SMA - $14.92
Short Setup (If Price Reaches Resistance & Shows Weakness)
Entry: Between $14.85 - $15.25
Stop Loss: Above $15.50
Take Profit: $14.2 - wOpen
Key Takeaways:
Ladder long entries from $11.48 - $10.82 to maximise R:R
Alternative long trade if price confirms $12.11 as support
Strong resistance at $14.85 - $15.25, ideal for profit-taking or a short trade setup
Multiple confluences (Fib levels, moving averages, order blocks) confirm these setups
New Free Indicator Release 🚀
I've just launched a FREE TradingView indicator – Multi Timeframe 8x MA Support & Resistance Zones. It helps visualise key support and resistance levels across different timeframes. Check it out and let me know your thoughts!
Shortsetup

BBAI - Great Breakout, over 600% gain. Now its time for Puts!I would not short this with shares! Positive news about new or existing contracts and it will go towards 10$. Puts are safe with low cost and defined risk. They should give 600-1000% over the next week or two. More if the market tanks or PLTR dropping could take this with it as they move together somewhat. I always hedge and the Puts are paid for with some of the profits from calls and shares so no real money risk.
This is not advice, sharing what I am doing is not a recommendation. Always use risk management.
Good luck if you play.

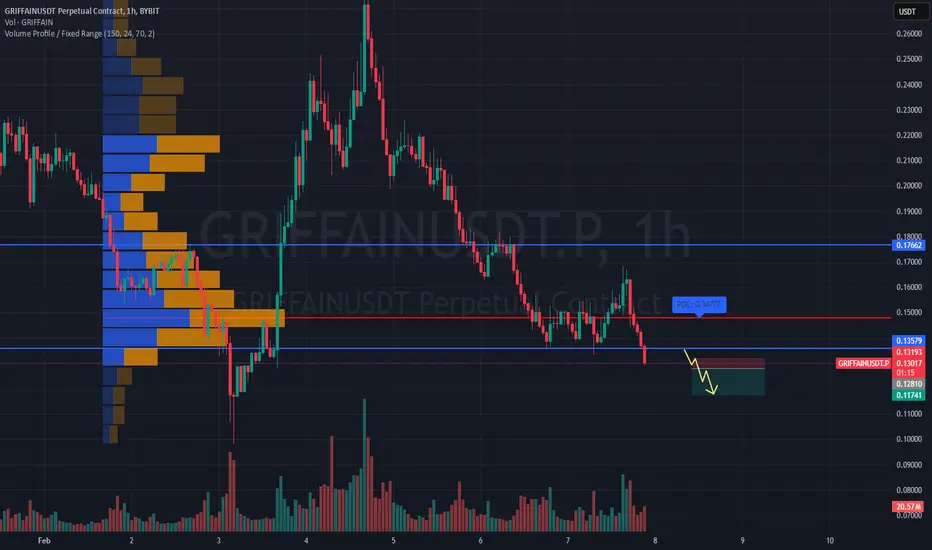
SHORT #GRIFFAINUSDT expecting further downside📉 SHORT BYBIT:GRIFFAINUSDT.P from $0.12810
🛡 Stop loss $0.13193
⏱ Timeframe: 1H
✅ Overview:
➡️ BYBIT:GRIFFAINUSDT.P is showing weakness after reaching a local high, rejecting from a resistance zone.
➡️ POC (Point of Control) at 0.13193 acts as a key volume area with significant trading activity.
➡️ Price action suggests seller dominance, indicating a potential continuation of the downtrend.
➡️ If the 0.12810 support level breaks, expect an increase in bearish momentum.
⚡ Plan:
➡️ Short entry upon confirmation of a breakdown below 0.12810.
➡️ Increased selling volume will confirm the continuation of the bearish trend.
➡️ Holding the position with dynamic monitoring until the first Take Profit level.
🎯 TP Targets:
💎 TP 1: 0.11741 – first target based on the nearest support level.
📢 BYBIT:GRIFFAINUSDT.P is showing bearish signs, but volume and pullback dynamics should be monitored.
📢 A break below 0.12810 could trigger a deeper decline.
📢 If buyers show strength, watch 0.13193 as a possible reversal point.
🚀 BYBIT:GRIFFAINUSDT.P maintains bearish momentum — expecting further downside!
RNDR SHORT/LONGWe had a strong reaction from $3.5, with a bounce of nearly 50%. Currently, the price is at a support level of around $4.1.
From here, the price could either consolidate or gradually move lower toward $3.5, possibly even $3, as the Stoch RSI still has room to go down.
However, a short-term rally toward the 21 EMA on the daily timeframe ($5.6) is also possible.
I'm considering entering a short if the price makes a fakeout above the 21 EMA, targeting at least $4. After that, if the setup aligns, I would look for opportunities to scale into long positions. We also need to remember that on February 11, RNDR will release 0.10% of its total supply into circulation.
This could add some selling pressure, so it’s worth considering when evaluating potential price movements.

$NVO more pain ahead! Headed down to $46-55 - NYSE:NVO was one of the hottest stocks of 2024 is now facing immense challenges by other healthcare companies in weight loss drug.
- With weak results, it sets up for disappointment for 1-2 quarters. Quick turnaround in experiments isn't feasible and would need considerable time to show promising results.
- It's better to put it on watchlist, attend earning call however it is likely that it might underperform FY 2025 or alteast first half of FY 2025.

NF - Will the BIG SELL happen or not?⭐️ Smart investment, Strong finance
⭐️ GOLDEN INFORMATION:
China has imposed tariffs on select US goods in response to President Trump’s 10% levy on Chinese imports, escalating trade tensions between the world’s two largest economies and reinforcing demand for safe-haven gold.
On the economic front, the US Department of Labor (DoL) reported that initial jobless claims rose to 219K for the week ending February 1, up from the previous week’s revised 208K. Meanwhile, US Treasury Secretary Scott Bessent stated that the Trump administration is less concerned about the Federal Reserve’s rate path and is instead focused on lowering 10-year Treasury yields.
⭐️ Personal comments NOVA:
The market is too expecting a price increase - big FOMO will have high risks. NF news will shock the market today, BIG SELL will happen
⭐️ SET UP GOLD PRICE:
🔥 BUY GOLD zone: $2851 - $2949 SL $2845 scalping
TP1: $2855
TP2: $2860
TP3: $2865
🔥 BUY GOLD zone: $2813 - $2811 SL $2806
TP1: $2820
TP2: $2828
TP3: $2835
⭐️ Technical analysis:
Based on technical indicators EMA 34, EMA89 and support resistance areas to set up a reasonable SELL order.
⭐️ NOTE:
Note: Nova wishes traders to manage their capital well
- take the number of lots that match your capital
- Takeprofit equal to 4-6% of capital account
- Stoplose equal to 2-3% of capital account

ATOM WEEKLY PART I The ATOM weekly chart is exciting. Every time the Stoch RSI oscillator is about to make a bullish cross but gets rejected, the price drops by at least 40%—this has happened the last two times.
However, the first time this fake cross occurred, the price increased by 68% before dropping by 74%.
Considering that on February 3, we saw a high-volume rejection from $3.7 (a 34% drop), I believe there is still room for the price to go lower, possibly even below $3.7.
If you flip the chart, it looks like it could reach around $3.2.

#TRUMPUSDT expecting further decline📉 SHORT BYBIT:TRUMPUSDT.P from $17.400
🛡 Stop Loss: $17.966
⏱ 1H Timeframe
📍 Overview:
➡️ BYBIT:TRUMPUSDT.P is showing signs of weakness after forming local resistance. The price failed to hold above $17.966 , confirming seller pressure.
➡️ POC (Point of Control) is positioned above the current price, indicating that liquidity has already been distributed in the upper range, while demand zones are shifting lower.
➡️ The price tested $17.400 and started moving downward, reinforcing the bearish scenario. If this level breaks, a move toward $16.412 is likely, where demand was previously observed.
➡️ The $16.412 level may serve as a short-term bounce zone, so monitoring price reaction is crucial.
⚡ Plan:
➡️ Short entry after breaking $17.400 , confirming buyer weakness.
➡️ Risk management through Stop-Loss at $17.966 , placed above the nearest liquidity zone.
➡️ Primary downside target – $16.412 , where buyers may step in.
🎯 TP Targets:
💎 TP 1: $16.412
🚀 BYBIT:TRUMPUSDT.P continues to lose momentum — expecting further decline!
📢 BYBIT:TRUMPUSDT.P remains under pressure, and the current market structure suggests a potential continuation of the downtrend. If the asset breaks below $17.400, the decline may accelerate.
📢 It is crucial to monitor volume—if selling volume increases, the bearish trend will strengthen.
📢 However, the $16.412 level may act as a reversal zone, so partial profit-taking could be a smart strategy.

BTC Correction Nearing Key Support – What’s Next?Bitcoin has been in a corrective phase over the past two days, retracing from recent highs and approaching critical support levels. Let’s break down the current market structure and identify potential trade opportunities based on confluences from multiple technical indicators.
Key Support and Resistance Levels:
1. ) Golden Pocket Zone – $95,535 to $94,994
The 0.618 Fibonacci retracement is a widely recognised level where strong reactions often occur.
This level aligns with a previous consolidation zone, making it a key demand area for potential long entries.
A bounce from here could indicate that bulls are regaining strength.
2.) Deeper Support – 0.786 Fib, Monthly Order Block, and Yearly Open (~$93,576)
If the golden pocket fails, the next key area of interest is around $93,576.
Here, we see confluence with:
The 0.786 Fibonacci retracement, often the last strong retracement before a reversal.
A monthly order block, which has previously acted as a strong support area.
The yearly open, a crucial psychological and technical level that often holds significance throughout the year.
3.) Next Major Support if Yearly Open Fails – $88,000 to $86,000 (Swing Low & Weekly Support Zone)
If price drops below the yearly open with confirmation of bearish momentum, I would look for the next buying opportunity at the swing low or weekly support zone, highlighted in the yellow box around $88,000 to $86,000.
This area holds strong confluence as a higher timeframe support level, making it an attractive zone for potential accumulation.
4.) Resistance Levels – Open Price and Psychological Barrier at $100K
$97,700 – This is the weekly open resistance level. If BTC struggles to reclaim this level, it could indicate further downside.
$100K – A major psychological resistance where sellers could step in. Breaking and holding above this level would be a strong bullish signal.
Trade Setups Based on Current Structure:
1.) Long Trade Setup – Golden Pocket Zone ($95,535 - $94,994)
Entry: Between $95,535 and $94,994 (Golden Pocket Zone)
Stop Loss: Below $93,500 to protect against further downside
Take Profit 1: $97,700 (weekly open resistance)
Take Profit 2: $100K (psychological resistance)
2.) Deeper Long Setup – If 0.618 Fib Fails ($93,576 - Yearly Open Zone)
Entry: Around $93,576 (0.786 Fib + Monthly Order Block + Yearly Open)
Stop Loss: Below $92,000
Take Profit 1: $97,700
Take Profit 2: $100K
3.) Alternative Long Setup – If Yearly Open Breaks ( FWB:88K - $86K Zone)
Entry: Around $88,000 to $86,000 (Weekly Support Zone)
Stop Loss: Below $85,000
Take Profit 1: $93,500 (yearly open retest)
Take Profit 2: $100K
Final Thoughts:
Bitcoin’s current structure suggests a healthy correction within a larger uptrend. The golden pocket ($95,535 - $94,994) remains a key level for potential long entries, while a failure to hold here could see price testing the $93,576 region. However, if price drops below the yearly open and confirms bearish momentum, the next major buying opportunity lies at the Swing Low or Weekly Support Zone at $88,000 - $86,000.
New Free Indicator – Multi Timeframe 8x MA Support Resistance Zones
I’ve just released a free indicator called Multi Timeframe 8x MA Support Resistance Zones, which is now live and ready to use! This indicator provides dynamic support and resistance zones based on multiple moving averages across different timeframes, helping you identify key areas for potential trade setups with better precision.
Feel free to check it out, give it a try, and let me know your feedback! 🚀

Alphabet (GOOGL) Analysis – Potential Downside RisksAlphabet is currently trading at $205. While it could still move higher, several factors might drive the price lower soon:
Extended Distance from 55 EMA:
The stock hasn’t touched the 55-day EMA for 147 days. While this doesn’t mean a pullback will happen immediately, a sharper downside move is possible.
Bearish Divergence:
The RSI has formed a lower high, while the price has made a higher high, signaling a potential bearish divergence.
Fundamental Risks – AI & Earnings:
Earnings Report on Tuesday:
Alphabet will report its earnings, and investors will focus on its high AI-related expenditures.
Revenue Growth Concerns:
The company may have experienced slower revenue growth in Q4 due to weakness in advertising and cloud services.
Competitive Pressure in AI:
Chinese startup DeepSeek recently launched low-cost AI models, raising concerns over a potential AI price war, which could impact Alphabet’s profitability.
While Alphabet remains strong, combining technical weakness and fundamental risks (earnings pressure, AI spending, and increased competition) could lead to a correction. If a pullback occurs, the 55 EMA could act as a key support level.
92% of positions are long. We all know the old saying—most people lose in trading. So if 92% of the market is long, we should at least be short for the moment.
This extreme bullish positioning suggests a potential contrarian opportunity, as overly crowded trades often lead to sharp reversals.

Short Idea On ZC1! (Corn)1)On Cot data,we can see the commercials shorting at the extremes.
2)Seasonality gives us a short bias and quantitative data shows 80% win rate for shorts.
3) We overvalued on daily and weekly timeframe against several benchmarks
4) On weekly timeframe,the price rejected the EMA Forming a Pin bar reversal
5) I set the entry and stoploss on the supply structure as you can see in the picture

AAVEUSDT Breakdown Imminent ? Bearish Setup AAVE/USDT perpetual contract on the 2-hour timeframe presents a descending channel formation in the. The price has been respecting the upper and lower trendlines, showing multiple rejections at both levels. Currently, the price is testing the lower boundary of the channel, and a breakdown could trigger further downside momentum.
The short setup suggests a bearish continuation if the price breaks below the lower trendline. The entry point is positioned around the 264.57 level, with a stop-loss placed above the recent swing high to manage risk. The take-profit zone is projected toward 221.84, aligning with the next significant support level.
Key factors to consider
The price is forming lower highs and lower lows, confirming the downtrend structure.
The red zone represents the stop-loss area, ensuring risk management in case of reversal.
The blue zone marks the potential profit-taking region, which aligns with a strong demand zone.
If a breakdown occurs with strong bearish volume, it could accelerate the move toward the target zone.
A potential retest of the broken support level could offer additional confirmation before further downside.
Traders should monitor volume and market sentiment before entering the trade, ensuring that bearish momentum supports the continuation of the trend.

Trade the Crude OIl Range Shorts and Longs Crude oil perspective going into Inventories data highlighting solid levels for longs and shorts

15min - 1 hour short term Day trade Idea for MES15min - 1hr trading idea for short term gain. Thoughts.
After reviewing and studying the chart I found myself pondering on a short term gain for the upcoming trading session. Thoughts and critique welcome.
The use of FVG that has not been mitigated is in play
Oversold on an RSI
Momentum on slowing down on a bear trend
As always. Not offering financial advice. Just food for thought.

The greatest short ever?! Is Celsius next...The greatest short ever?!
NASDAQ:WKHS -99.92% 🔪🩸
Is this what's in store for NASDAQ:CELH ?!
Brought to you by the Tweezer Pattern
What say you?
Not financial advice

Solana Breaks Key Support Level – Is a Short Opportunity Ahead.?Solana has recently breached its previous support level of $221, signaling a potential shift in market dynamics. Given the technical analysis indicators, there may be an opportunity to initiate a short trade upon the price retesting this level, which could serve as a new resistance point. However, traders should exercise caution in their approach, particularly in light of the ongoing trade tensions involving the United States, Canada, China, and Mexico. These geopolitical factors could introduce volatility and impact market sentiment significantly, making it essential to implement risk management strategies when executing trades.

EURGBP - Bearish ReversalHello traders
EURGBP has been slowly grinding up since 9 January with there being a trendline holding this slight uptrend. But it broke out of the trendline last week and it retested it. The ideal entry would have been on the retest but let's hope this 4H fvg gets filled then price goes down.
Furthermore, the rsi has been making lower lows while price was making higher highs showing bearishness. Add to this that this setup is forming on a daily resistance zone as per the chart.

EUR/USD - Bearish Setup with Elliott Wave StructureAnalyzing EUR/USD on the 15-minute timeframe using Elliott Wave Theory. Expecting a corrective wave (4) to complete before a final impulsive wave (5) downward.
Entry Zone: Just below the recent high
Stop Loss: Above wave (4) completion
Target: 1.0330-1.0315 range
Watching for confirmation before taking the trade. Let’s see how it plays out!
#ElliottWave #EURUSD #ForexTrading #TechnicalAnalysis

Bearish trends in the days ahead. Hello,
To all my folks who are trading forex. Right now everything has been going crazy with all the news across the world.
One thing can be sure is the USD is reigning supreme. With a guy sitting at the big White House in DC. Be rest assured he wants to be first at everything. He wants US first in everything. It’s only a matter of time before things start to reflect certain aspects of that. Especially the USD.
So let’s take a look at what the EUR has been doing for a while! What it has been doing for a long time is falling.
Things will continue to be that way. If we extend the times on the chart to 4hrs, day, week and even month. You can see that things are looking to trace back to low’s that haven’t been hit in years.
Of course, things will always have to retrace, you will have your support and resistance levels. That’s a gimme. It’s what we do at those levels is what will define these future trades.
At this time. It’s time to throw the towel in and admit. We are in a EUR/USD downtrend for a long time to come.
As always, research your entries, confirm your strengths and look for opportunities to trade smarter. If you enjoy this publish idea, please follow and boost this up.
- Thank you


WHEAT – Signs of Weakness, Could a Short Be Next?PEPPERSTONE:WHEAT is within a clear resistance zone that has times before led to bearish reversals. In any case, this zone marked by previous price rejections, could once again attract selling pressure.
If bearish confirmation occurs—through rejection wicks, bearish engulfing candles, or a decrease in buying volume—we could see a decline toward the 544,00 level.
However, I’ll be watching for strong support reactions or signs of exhaustion before confirming the next move.
Just my take on support and resistance zones—not financial advice. Always confirm your setups and trade with solid risk management!
What’s your take on the potential trend of this chart? I’d love to hear your perspective in the comments.
Best of luck , TrendDiva

#BTC short trade, previously shared trade idea still activeI saw that it still appears like a great time to buy, but after previewing it, it never gave us the price we wanted to buy at. More liquidity was created before it went down, and now there are more opportunities for our entry price to go down. Let's watch how it moves from here.

BTCUSDT Short Swing trade.Hello everyone, i want to share my price prediction at Bitcoin.
The week started with strong sell which activated buyers but i think buyers is not more strong, price tested well 2h FVG and Fibonacci Strong sell zone after New York session open.
Price is into consolidation, and if we look higher timeframe Bitcoin losing buyers with my strategy here is my short position setup.
Open Short position at - 102500
Stop Loss at - 104500
Take profit - i will follow trend if i will be right.
Always manage your risk!!! don't risk more than 2.6% of your balance in this trade.
