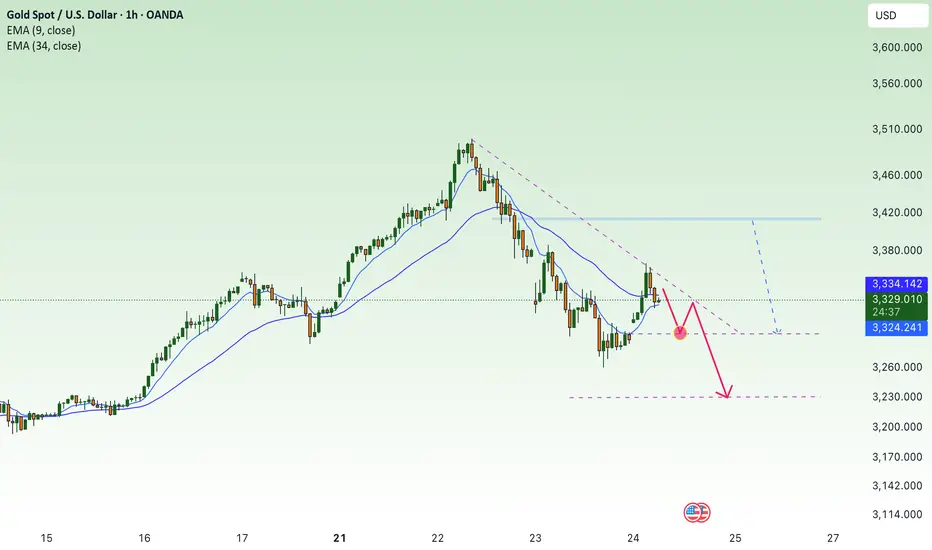
Gold has little momentum to continue rising - continues to fall 🔔🔔🔔 Gold news:
➡️ Gold prices reverse course during Monday’s U.S. trading session, recovering strongly from an intraday low of $3,268.03 to hover around $3,330. In the absence of major macroeconomic data, investors remained focused on trade developments. Mixed headlines regarding U.S.-China trade negotiations stirred some concerns after a quiet start to the day, with cautious optimism leading earlier sessions in Asia and Europe, thereby putting pressure on demand for the U.S. Dollar.
➡️ However, gold struggled to maintain its overnight rebound and faced renewed selling pressure during Tuesday's Asian session. Signs of easing U.S.-China trade worries and optimism about potential trade deals from the U.S. continued to support a risk-on sentiment, weighing on the appeal of the safe-haven metal.
Personal opinion:
➡️ Positive information about tariff negotiations is appearing more and more, and the parties are also easing trade tensions. So the gold price decrease is still maintained or at least difficult to increase further, unless there is a strong enough announcement to push the gold price up
➡️ Analysis based on important resistance - support levels and Fibonacci combined with trend lines to come up with a suitable strategy
Plan:
🔆Price Zone Setup:
👉Sell Gold 3357 - 3360
❌SL: 3365 | ✅TP: 3352 - 3346 – 3340
👉Buy Gold 3270 - 3273
❌SL: 3265 | ✅TP: 3278 - 3283 – 3289
FM wishes you a successful trading day 💰💰💰
Shortsetup

SHORT ON GOLDGOLD has created a nice head and shoulders pattern and has also broke the neckline.
Since then we have created a lower high and are starting to push down.
Dollar should rise after news today at 8:15 this would aid in pushing gold down.
I will be selling gold to the 3000 price level looking to catch 2000 pips.

EURGBP Short SetupEURGBP Short Setup
4H Chart Trendline Breakdown and Retest
Entry : 0.84944
Stop Loss : 0.86678
Take Profit : 0.83310
RR 1 to 1.9
Market broke below the ascending support and retested the underside of a broken trendline confluence. Bearish pressure is building as price fails to reclaim 0.85396 zone. Clean structure for continuation to the downside.
Price is now respecting lower highs with momentum shifting beneath structure. This setup targets the previous demand zone near 0.833 region where price consolidated before the last impulse up.
As long as price holds below 0.854 zone, bearish bias remains valid.

SHORT ON GBP/USDGBP/USD Has bearish divergence on the 4hr timeframe.
This is a bearish reversal indication. Price is also over brought on GU.
The Dollar (dxy) Looks like it will start to rise from its demand area.
I will be selling GU looking to catch over 300-400 pips to the previous swing low /demand zone.

Trade talks improve and confidence returns🔔🔔🔔 Gold news:
➡️ Gold prices declined as improved risk sentiment weakened demand for safe-haven assets. Optimistic U.S. macroeconomic data released on Thursday supported the USD, limiting gains for the precious metal.
➡️ On Friday, the U.S. dollar showed signs of recovery as market sentiment remained upbeat due to positive developments in trade negotiations. According to Reuters, the Trump administration appeared to be making progress in preliminary trade talks with Asian allies South Korea and Japan.
Personal opinion:
➡️ The sellers are gaining the upper hand thanks to optimistic news, and the buyers are resting due to little news affecting the upward momentum of gold prices.
The analysis is based on resistance - support levels and Pivot points combined with EMA to come up with a suitable strategy.
Personal plan:
🔆Price Zone Setup:
👉Buy Gold 3281 - 3284
❌SL: 3277 | ✅TP: 3289 - 3294 – 3300
👉Sell Gold 3369 - 3372
❌SL: 3377 | ✅TP: 3365 - 3360 – 3355
FM wishes you a successful trading day 💰💰💰

#WALUSDT continues its bearish momentum 📢 As long as the price stays under $0.6000 — short BYBIT:WALUSDT.P bias remains valid.
📢 Watch for further weakness!
📉 SHORT BYBIT:WALUSDT.P from $0.5794
🛡 Stop loss: $0.6000
🕒 Timeframe: 1H
✅ Overview:
➡️ The chart shows a clearly formed and broken Bearish Rectangle, confirming a short setup after price exited the range to the downside.
➡️ The $0.6090 support level has turned into strong resistance.
➡️ Entry at $0.5794 follows a textbook breakdown and retest structure.
➡️ Target area aligns with the volume-based support near POC $0.515, offering solid R:R.
🎯 TP Targets:
💎 TP 1: $0.5725
💎 TP 2: $0.5665
💎 TP 3: $0.5600
📢 Bearish structure confirmed with increased volume.
🚀 BYBIT:WALUSDT.P continues its bearish momentum — downside potential remains active!

Bitcoin - Back Under Intersecting Bearish TrendlinesBitcoin is back underneath these two intersecting bearish trendlines.
I have laid out two potential paths Bitcoin could take to play this out.
When an asset in crypto goes only up for so long, it leaves behind a trail of leveraged liquidity in the form of stop losses. These wide open gaps filled with long stop losses, is the fuel that would make such a move possible. In other words, the sell orders are already in the chart in order to make this possible.
Personally, I expect this to happen.
DXY is showing a major breakdown and bearish retest at the moment - with a falling dollar over the next 2-3 years, that translates to a true bull market for Bitcoin and related assets.
The market has a very small time window to recollect all of the long position liquidity in the chart, which is in the billions.
See my previous posts to see confluences, liquidity mapping, etc.
Happy trading and I will be trading this myself.

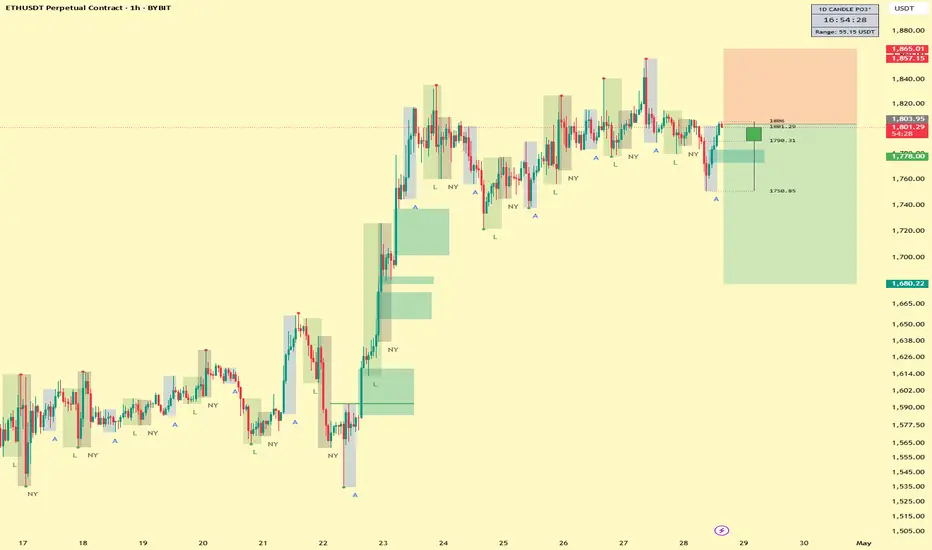
ETHUSD SHORT 1PercentFundedTICKER: ETHUSD
ENTRY 1: 1810
ENTRY 2: 1795
SL: 1865
TP1: 1720
TP2: 1680
Trade Active
Sellers continue to dominate the market today.🔔🔔🔔 Gold news:
➡️ The US dollar (USD) continues to attract buying interest driven by short-covering and easing US-China trade tensions, maintaining downward pressure on gold prices denominated in USD, even as US Treasury yields and risk sentiment decline once again.
➡️ With trade tensions between the US and China subsiding, market focus is shifting back to US fundamentals and the Federal Reserve's interest rate outlook, which could potentially support gold prices in the coming days.
Personal opinion:
➡️ Gold continues to maintain a downtrend today, following positive trade negotiations between the US and related countries.
➡️ However, it is necessary to closely monitor the US-China trade negotiations. This is still the main focus of the market
➡️ Analysis based on resistance - support levels combined with Fibonacci and EMA to come up with a suitable strategy
Plan:
🔆Price Zone Setup:
👉Sell Gold 3367 - 3370
❌SL: 3375 | ✅TP: 3362 - 3356 – 3350
👉Buy Gold 3244 - 3247
❌SL: 3240 | ✅TP: 3252 - 3258 – 3265
FM wishes you a successful trading day 💰💰💰

Positive trade talks could send gold prices lower next week🔔🔔🔔 Gold news:
➡️ Gold reversed its Thursday recovery and slipped to around $3,300 per ounce by the weekend as market sentiment continued to improve, driven by optimism over positive developments in the U.S.-China trade dispute. U.S. Treasury Secretary Scott Bessent stated that the United States and South Korea could reach a "mutual understanding" on trade as early as next week, according to Bloomberg. The growing number of headlines suggesting potential trade agreements is adding downward pressure on gold prices.
Personal opinion:
➡️ Positive trade agreements are emerging, and the market is gradually pricing in positive news, causing gold to continue to decline early next week
➡️ Note: The trade war remains the focus and any negative news could affect gold prices and cause the upward trend to resume.
➡️ Analysis based on important resistance - support levels and Fibonacci combined with EMA to come up with a suitable strategy
Resistance zone: 3370 - 3433 - 3500
Support zone: 3270 - 3253 - 3145
FM wishes you a successful trading week💰💰💰

H4 downtrend line, gold price cools down✍️ NOVA hello everyone, Let's comment on gold price next week from 04/28/2025 - 05/02/2025
🔥 World situation:
Gold prices reversed course on Friday, wiping out Thursday’s gains and slipping below the $3,300 threshold, as persistent US Dollar strength weighed heavily on the precious metal despite declining US Treasury yields. The easing of tensions in the US-China trade dispute further pressured bullion, with XAU/USD trading around $3,294, down more than 1.6%.
Market sentiment remains fragile, swinging sharply between risk-on and risk-off modes in response to comments from US President Donald Trump. Earlier, Bloomberg reported that China was considering tariff exemptions on some US goods, sparking optimism. However, the mood soured after Trump asserted that he would not lift tariffs on China without significant concessions.
🔥 Identify:
News about Russia-Ukraine peace talks this weekend will continue to put selling pressure on gold prices next week. Moving along the downtrend line H4
🔥 Technically:
Based on the resistance and support areas of the gold price according to the H4 frame, NOVA identifies the important key areas as follows:
Resistance: $3357, $3498
Support : $3228, $3155
🔥 NOTE:
Note: Nova wishes traders to manage their capital well
- take the number of lots that match your capital
- Takeprofit equal to 4-6% of capital account
- Stoplose equal to 2-3% of capital account
- The winner is the one who sticks with the market the longest

Doge Usdt ShortHello dear friends, I have a short theory on Dogecoin with a specified stop. The market is closed and the volume is low, please manage your money.

Gold price heading below 3300⭐️GOLDEN INFORMATION:
Federal Reserve (Fed) officials have signaled openness to potential interest rate cuts, a stance that could limit further upside in the US Dollar (USD) and lend support to the non-yielding Gold price. Additionally, growing concerns over the economic repercussions of President Donald Trump’s aggressive tariff measures, combined with ongoing geopolitical instability, continue to bolster the appeal of safe-haven assets. In this environment, the broader bias for gold remains tilted to the upside, urging caution for traders considering bold bearish positions.
⭐️Personal comments NOVA:
continue sideways, price range fluctuates around 3300
⭐️SET UP GOLD PRICE:
🔥SELL GOLD zone : 3382- 3384 SL 3389
TP1: $3370
TP2: $3360
TP3: $3350
🔥BUY GOLD zone: $3294 - $3292 SL $3287
TP1: $3300
TP2: $3310
TP3: $3320
⭐️Technical analysis:
Based on technical indicators EMA 34, EMA89 and support resistance areas to set up a reasonable SELL order.
⭐️NOTE:
Note: Nova wishes traders to manage their capital well
- take the number of lots that match your capital
- Takeprofit equal to 4-6% of capital account
- Stoplose equal to 2-3% of capital account

AT&T I Tipping Point : Short Opportunity with Head & ShouldersHey traders after a previous trade trade on the hood hitting targets of 16.4%. Today I bring you NYSE:T
Technical + Fundamental View
Pro Tip
- Breakdown below the Entry Line will be considered at Trade Initiation. (Risky Traders)
R:R= 5.4
- Rest can follow entry at day close post breakdown SL above Entry Candle.
- The Breakdown Below the Entry Line will confirm the head and shoulder pattern
Entry Line - 26.93
Stoploss - 27.53
Target 1 - 25.59 (Neckline of head and shoulder)
Target 2 - 24.74
Target 3 - 23.68
Technical View
- Head And Shoulder on Daily Time frame
- On the hourly timeframe, the chart looks weak, showing a potential double top pattern where the second peak is lower than the first, indicating growing investor fear.
Fundamental View
- High Debt: Over $140 billion in debt limits investment capacity and consumes significant cash flow.
- Network Issues: Poor service quality and outages risk losing customers to competitors.
- Strong Competition : T-Mobile and Verizon offer better plans, making customer retention harder.
- Market Saturation: The U.S. wireless market is nearly saturated, limiting new customer growth.
- Execution Risks: Growth and debt reduction depend on flawless asset sales and network upgrades; delays could harm finances and stock performance.
Additional Considerations
- AT&T’s valuation is higher than some peers, potentially capping upside.
- Telecom market competitiveness means growth hinges on successful 5G and fiber rollouts.
- Dividend yield (~3.9%) is attractive but lower than some rivals, which may impact income investors.

Gold's short-term decline continues⭐️GOLDEN INFORMATION:
Gold price (XAU/USD) regained strong upward momentum during the Asian session on Thursday, rebounding sharply from the previous day’s steep decline and ending a two-day losing streak near the $3,260 weekly low. The renewed buying interest comes amid lingering concerns over the protracted trade impasse between the US and China, following US Treasury Secretary Scott Bessent’s comments indicating that the standoff could drag on.
Compounding market anxiety is the persistent uncertainty surrounding President Donald Trump’s tariff policies and their broader implications for global growth. These factors have fueled a fresh wave of safe-haven demand, driving investors back toward gold.
⭐️Personal comments NOVA:
Still under selling pressure, gold price is consolidating below the downtrend line. Trading around 3300 and lower.
⭐️SET UP GOLD PRICE:
🔥SELL GOLD zone : 3412- 3414 SL 3419
TP1: $3390
TP2: $3380
TP3: $3370
🔥BUY GOLD zone: $3228 - $3230 SL $3223
TP1: $3240
TP2: $3250
TP3: $3260
⭐️Technical analysis:
Based on technical indicators EMA 34, EMA89 and support resistance areas to set up a reasonable SELL order.
⭐️NOTE:
Note: Nova wishes traders to manage their capital well
- take the number of lots that match your capital
- Takeprofit equal to 4-6% of capital account
- Stoplose equal to 2-3% of capital account
SHORT ON SILVER XAG/USDSilver is currently at a major level of supply and is currently respecting it.
it has swept liquidity and is also over brought on the RSI.
I will be selling silver to the previous swing low / demand zone.

SHORT ON AUD/USDAUD/USD has given us a double top at a major resistance area/zone.
It has currently formed a lower high after giving us a change of character (choc) to the downside.
I expect price to drop to the next demand level for 200-300 pips.
Dxy News for the rest of the week should help fuel the move if positive for the dollar.

Panic Selling LINK? Here’s Your Master PlanBuckle up! LINK has been riding a relentless bearish trend for 113 days, ever since it kissed its peak of $30.94 back in December 2024. With economic uncertainty casting a shadow over the markets and fear gripping investors, the big questions loom: Is this the dip to buy while others panic-sell? Or is it wiser to sit on the sidelines? Let’s slice through the noise, dissect LINK’s chart like a seasoned pro, and uncover the setups that could turn this chaos into opportunity. Let’s dive in!
The Big Picture: LINK’s Bearish Blueprint
LINK is currently trading at $13, a far cry from its yearly open of $20. April has kicked off, and LINK has already surrendered the monthly open at $13.5, a critical level now acting as a brick wall overhead. Zooming out, the trend is unmistakably bearish: lower highs and lower lows dominate the chart. Adding fuel to the fire, LINK is languishing below the Point of Control (POC) at $14.32, derived from a 1.5-year trading range. This is a market screaming caution for bulls and whispering opportunity for bears, at least for now.
But charts don’t lie, and they’re packed with clues. Let’s map out the key levels, pinpoint trade setups, and arm ourselves with a plan that’d make even the most seasoned traders nod in approval.
Resistance Zones: Where Bears Sharpen Their Claws
1.) Resistance - The Golden Pocket ($13.6 - $13.7)
Using the Fibonacci retracement tool on the latest downward wave, the golden pocket (0.618 - 0.65 Fib) aligns beautifully with the monthly open at $13.5. Oh wait there’s more, this zone overlaps with a Fair Value Gap (FVG), making it a magnet for price action.
Trade Setup (Short):
Entry: ~$13.5 (if price tests and rejects this zone).
Stop Loss (SL): Above the recent swing high at $14.4.
Take Profit (TP): First target at $11.85 (swing low), with a stretch goal at $11.
Risk-to-Reward (R:R): A solid 2:1.
The Play: If LINK crawls up to this resistance and gets smacked down, bears can pounce. Watch for rejection candles (e.g., shooting star, bearish engulfing) to confirm the move.
2. Key Resistance - Cloud Edge & VWAP ($15.74 - $16.5)
The Cloud edge of my indicator sits at $15.74, while the anchored VWAP (from the $26.4 high) hovers at $16.5. A break above $16.5 would flip the script, snapping the bearish structure and signaling a potential trend reversal.
Bullish Scenario: If bulls reclaim $16.5 as support, it’s a green light for a long trade. Until then, this is a fortress for bears to defend.
The Play: No bullish setups here yet.
Support Zones: Where Bulls Build Their Base
1.) Support - Swing Low ($11.85)
This is the first line in the sand for bulls. A potential Swing Failure Pattern (SFP), where price dips below $11.85, sweeps liquidity, and reverses—could spark a long trade.
The Play: Watch for a bullish reversal candle or volume spike here.
2.) Major Support Cluster - The Golden Zone ($10 - $11.85)
This is where the chart sings a symphony of confluence:
Swing Low: $11.85.
POC: $11.33 (1.5-year trading range).
Monthly Level: $11.02.
Fib Retracement: 0.886 at $10.69 and 0.786 (log scale) at $10.77.
Psychological Level: $10.
Trade Setup (Long):
Entry: Dollar-Cost Average (DCA) between $11.85 and $10.
Stop Loss (SL): Below $10
Take Profit (TP): First target: $13.5 (monthly open), stretch goal: $20 (yearly open).
Risk-to-Reward (R:R): A monstrous 6:1 or better, depending on your average entry. This is the kind of trade we are looking for!
The Play: Patience is key. Wait for confirmation—think bullish engulfing candles, a surge in volume, or positive order-flow momentum. This isn’t a “hope and pray” trade; it’s a calculated ambush on the bears.
Market Structure: Bears Rule, But Bulls Lurk
Right now, LINK’s chart is a bear’s playground—lower highs, lower lows, and no bullish momentum to speak of. The $16.5 VWAP is the line in the sand for a trend shift, but until then, short trades take priority. That said, the $10 - $11.85 support zone is a coiled spring for bulls. If fear drives LINK into this range, it’s time to load the boat with longs—provided confirmation aligns.
Your Trading Edge
LINK’s 113-day bearish descent is a wild ride, but it’s not random chaos—it’s a roadmap. Bears can feast on rejections at $13.5 - $13.7 with a tidy 2:1 R:R short. Bulls, meanwhile, should stalk the $10 - $11.85 zone for a high-probability long with a 6:1+ R:R payoff. Whether you’re scalping the dips or swinging for the fences, these levels give you the edge to trade with confidence.
So, what’s it gonna be? Short the resistance and ride the wave down? Or stack bids at support and catch the reversal of a lifetime? The chart’s laid bare—now it’s your move. Drop your thoughts below, and let’s conquer this market together!
If you found this helpful, leave a like and comment below! Got requests for the next technical analysis? Let me know, I’m here to break down the charts you want to see.
Happy trading =)

EURUSD SHORT FORECAST Q2 W17 D23 Y25EURUSD SHORT FORECAST Q2 W17 D23 Y25
Professional Risk Managers👋
Welcome back to another FRGNT chart update📈
Diving into some Forex setups using predominantly higher time frame order blocks alongside confirmation breaks of structure.
Let’s see what price action is telling us today!
Trade confluences
- Weekly order block rejection
- Daily bearish close
- Intraday breaks of structure
- 15’ order block created
- Tokyo ranges to be filled
🔑 Remember, to participate in trading comes always with a degree of risk, therefore as professional risk managers it remains vital that we stick to our risk management plan as well as our trading strategies.
📈The rest, we leave to the balance of probabilities.
💡Fail to plan. Plan to fail.
🏆It has always been that simple.
❤️Good luck with your trading journey, I shall see you at the very top.
🎯Trade consistent, FRGNT X

GBPUSD Analysis with ICT ConceptsMy current outlook on the British Pound is bearish, with an expectation of lower levels in the near term.
A key level I am anticipating price to reach is the Weekly Open, which has not yet been touched.
Yesterday's price action seems to be confirming this potential move towards the Weekly Open.
Therefore, I am actively looking for confirmed short position opportunities to align with this view.
Trade safe!

SHORT ON NZD/USDNZD/USD Is currently at a major resistance level/zone and has created a double top or equal highs.
Price has started to fall a bit, but I do believe price will rise to take out the equal highs in a "Liquidity hunt"
Overall I am taking a market execution sell on NZD/USD to the next demand level looking to catch over 300+ pips.

Watch for a breakout from the #BANKUSDT📍 The price of MEXC:BANKUSDT.P is approaching the apex of the pattern — a breakout from consolidation is expected soon. The main scenario favors a downward breakout, with a short opportunity if confirmed.
📍 Important note: ➡️ Don’t rush the entry! Wait for a clear breakout from the pennant and confirmation of the direction.
📍 Beware of fakeouts — the key to success lies in confirmation with candle closes and volume.
📉 SHORT MEXC:BANKUSDT.P from $0.04118
🛡 Stop loss: $0.04284
🕒 Timeframe: 1H
📢 Overview:
➡️ The main structure of MEXC:BANKUSDT.P remains bearish, showing consolidation after a drop.
➡️ A break below the $0.04118 support will trigger the Bearish Pennant pattern.
➡️ Volume increase on the breakout will confirm sellers' dominance.
🎯 TP Targets for SHORT:
💎 TP 1: $0.04010
💎 TP 2: $0.03900
💎 TP 3: $0.03815
📢 Entry conditions for MEXC:BANKUSDT.P :
Enter only after a clear breakdown and candle close below $0.04118, ideally with volume confirmation.
📢 If the price holds above $0.04588, the structure may be invalidated, and the short scenario should be reconsidered.
📈 LONG MEXC:BANKUSDT.P from $0.04652
🛡 Stop loss: $0.04501
🕒 Timeframe: 1H
📢 Overview:
➡️ Price is compressing inside a Bearish Pennant, but there is still potential for a fake breakout upward.
➡️ A breakout above the pennant on strong volume may lead to a bullish impulse.
➡️ The $0.04652 level is key for a long entry after confirmation.
🎯 TP Targets for LONG:
💎 TP 1: $0.04760
💎 TP 2: $0.04870
💎 TP 3: $0.04970
📢 Entry conditions:
Enter only after a confident breakout above $0.04652 and a solid candle close (preferably with high volume).
🚀 Watch for a breakout from the MEXC:BANKUSDT.P structure and trade only in the confirmed direction. Either way — there is good movement potential and the R/R ratio is solid in both directions!

USDCHF SELLSPrice is still bearish therefore I’m only interested in sells for now. I’d wait for price to breakout of this h4 range then I’ll look for sells towards 0.78250 area.
