Bitcoin (BTC/USD) 4H Chart Analysis – Professional BreakdownBitcoin (BTC/USD) 4H Chart – Detailed Professional Analysis
This chart presents a Rectangle Pattern, a common consolidation structure in technical analysis. The price has been oscillating between a well-defined resistance level near $88,000 - $89,000 and a support level around $80,000 - $81,000. This pattern suggests an upcoming breakout, with bearish continuation being the most probable scenario.
Understanding the Rectangle Pattern
A rectangle pattern forms when price moves sideways, trapped between two horizontal levels. Traders watch for a breakout in either direction to determine the next trend. In this case, Bitcoin has tested the resistance multiple times but failed to break above, indicating strong selling pressure. Meanwhile, support has been retested several times, which weakens its strength over time.
A bearish breakdown is likely because:
Buyers appear unable to push past resistance, showing exhaustion.
Support has been tested multiple times, which increases the chance of a breakdown.
The dotted black trendline is now being tested, and a break below it would further confirm bearish momentum.
Trade Setup for a Breakdown
A short trade becomes valid only if Bitcoin breaks below the $81,000 - $82,000 support zone with strong momentum. The price must close below this level to confirm the move.
How to Enter the Trade?
Look for a strong bearish candle close below the $81,000 - $82,000 range.
If Bitcoin retests this broken support (now acting as resistance), this can be a secondary short entry point.
Once confirmation is seen, open a short position.
Stop Loss Placement
To protect against false breakouts, a stop loss should be set above the $88,457 resistance zone. If the price moves back into the rectangle and surpasses this level, it means the bearish setup is no longer valid.
Profit Target and Trade Expectation
The expected take profit target is $73,541. This is calculated using the measured move projection, meaning the height of the rectangle is subtracted from the breakdown point. If Bitcoin reaches this level, the trade will have successfully captured the bearish momentum.
Market Psychology Behind This Move
The repeated failure to break above resistance ($88,000 - $89,000) signals weak buying interest. Buyers have been stepping in at support, but each retest of the $80,000 - $81,000 zone makes it more vulnerable.
Once support finally breaks, several factors will accelerate the move:
Long positions will be forced to sell, increasing selling pressure.
Breakout traders will enter new short positions, pushing price further down.
Liquidity below support will be triggered, causing Bitcoin to fall sharply toward the $73,541 target.
Invalidation Scenario (Bullish Case)
If Bitcoin breaks above $88,000 - $89,000 and holds, the bearish setup becomes invalid. In that case:
The price would shift into a bullish continuation pattern.
Traders should avoid shorting and instead look for buying opportunities above resistance.
Final Thoughts
This is a high-probability bearish setup, but patience is key—wait for confirmation before entering.
Risk management is crucial : The stop loss at $88,457 ensures that losses are minimized if the market moves against the trade.
If Bitcoin remains inside the rectangle, traders can buy at support and sell at resistance until a breakout occurs.
Shorttrade

Gold prices cool after tariff announcement⭐️GOLDEN INFORMATION:
Gold prices (XAU/USD) surged to a new all-time high during the Asian session on Thursday as investors flocked to safe-haven assets amid heightened risk aversion. Market sentiment took a sharp downturn after US President Donald Trump unveiled sweeping reciprocal tariffs on Wednesday evening, igniting fears of a global economic slowdown and a potential US recession.
The announcement triggered a broad sell-off in equity markets, reinforcing the risk-off mood and further fueling demand for gold as a traditional store of value.
⭐️Personal comments NOVA:
Gold hits 3167 peak, buying pressure gradually decreases. Adjustment waiting for new moves from other countries on Trump's tariff policy
⭐️SET UP GOLD PRICE:
🔥 SELL 3165 - 3168 SL 3172
TP1: $3160
TP2: $3150
TP3: $3140
🔥BUY GOLD zone: $3108 - $3110 SL $3103
TP1: $3115
TP2: $3130
TP3: $3140
⭐️Technical analysis:
Based on technical indicators EMA 34, EMA89 and support resistance areas to set up a reasonable SELL order.
⭐️NOTE:
Note: Nova wishes traders to manage their capital well
- take the number of lots that match your capital
- Takeprofit equal to 4-6% of capital account
- Stoplose equal to 2-3% of capital account

JPY/USD: Bearish Triangle Pattern Breakout Towards TargetChart Pattern: Triangle Pattern
Pattern Description
Type: The chart identifies a Triangle Pattern, which is a type of consolidation pattern that can act as either a continuation or reversal pattern depending on the preceding trend and the breakout direction. Triangles are characterized by converging trendlines, indicating a period of indecision in the market as the price range narrows.
Specific Type: This appears to be a Symmetrical Triangle, as the upper and lower trendlines converge at a similar angle, suggesting neither buyers nor sellers have clear control during the consolidation phase.
Appearance on the Chart:
The Triangle Pattern is marked with two converging trendlines:
Upper Trendline (Resistance): Connects the lower highs, sloping downward.
Lower Trendline (Support): Connects the higher lows, sloping upward.
The pattern began forming around March 27, after a sharp downtrend, and continued until the breakout on April 2, 2025.
Breakout Direction:
Symmetrical Triangles can break out in either direction, but they often continue the preceding trend. In this case, the preceding trend was bearish (a sharp decline from 0.006720 to 0.006640), and the breakout is to the downside, confirming a bearish continuation.
The chart shows the price breaking below the lower trendline of the triangle around April 2, 2025, with a strong bearish candle, indicating a confirmed bearish breakout.
Key Levels and Trading Setup
1. Support Level
A horizontal support zone is marked around 0.006640 (approximately 0.00664–0.00665).
This level acted as a base during the triangle formation, with the price bouncing off this zone multiple times (e.g., on March 28 and March 31).
The price has now broken below this support, turning it into a resistance level on any potential retest.
2. Resistance Level
A resistance zone is marked around 0.006705 (approximately 0.00670–0.00671).
This level corresponds to a previous high within the triangle and aligns with the upper boundary of the triangle at the time of the breakout.
After the breakout, this resistance level is where the stop loss is placed, as a move back above this level would invalidate the bearish setup.
3. Target
The target for the breakout is projected at 0.006599 (approximately 0.00660).
This target is likely calculated by measuring the height of the triangle at its widest point (from the highest high to the lowest low within the pattern) and projecting that distance downward from the breakout point.
The chart indicates a potential move of -0.000604 (-0.96%), which aligns with the distance from the breakout level (around 0.006654) to the target (0.006599).
4. Stop Loss
A stop loss is suggested above the resistance level at 0.006705.
This placement ensures that if the breakout fails and the price moves back above the triangle’s lower trendline (now acting as resistance), the trade is exited with a manageable loss.
Trading Setup Summary
Entry:
The setup suggests entering a short (sell) position after the price breaks below the lower trendline of the Triangle Pattern, which occurred around April 2, 2025. The breakout is confirmed by a strong bearish candle closing below the trendline at approximately 0.006654.
Stop Loss:
Place a stop loss above the resistance level at 0.006705 to protect against a false breakout or reversal. The distance from the breakout level (0.006654) to the stop loss (0.006705) is 0.000051, representing the risk on the trade.
Take Profit/Target:
Aim for the target at 0.006599, which is the projected price objective based on the triangle’s height. The distance from the breakout level to the target is 0.000055, or a 0.96% move.
Risk-Reward Ratio:
The risk is 0.000051 (from 0.006654 to 0.006705), and the reward is 0.000055 (from 0.006654 to 0.006599), giving a risk-reward ratio of approximately 1:1.08 (0.000055 / 0.000051). While this ratio is slightly above 1:1, it’s on the lower side for a typical trading setup, so traders should ensure high confidence in the breakout.
Additional Observations
Price Action Context:
Before the triangle formed, the price experienced a sharp decline from 0.006720 (March 23) to 0.006640 (March 27), indicating a strong bearish trend.
The triangle represents a consolidation phase within this downtrend, and the downside breakout suggests a continuation of the bearish momentum.
Volume and Momentum:
The chart doesn’t display volume or momentum indicators (e.g., RSI, MACD). However, a typical confirmation of a triangle breakout would include:
An increase in volume on the breakout candle, indicating strong selling pressure.
Bearish momentum signals, such as an RSI below 50 or a bearish MACD crossover.
Traders might want to check these indicators for additional confirmation of the breakout’s strength.
Timeframe:
This is a 1-hour chart, so the setup is intended for short-term trading, with the target potentially being reached within a few hours to a day.
Market Context:
USD/JPY is influenced by factors like U.S. dollar strength, Japanese yen safe-haven demand, and interest rate differentials. A bearish move in USD/JPY could be driven by a stronger yen (e.g., due to risk-off sentiment) or a weaker dollar (e.g., due to dovish U.S. economic data).
Conclusion
The TradingView idea presents a bearish setup for USD/JPY based on a Symmetrical Triangle Pattern on the 1-hour chart. The price has broken below the triangle’s lower trendline, confirming a bearish continuation with a target of 0.006599. The setup includes a stop loss at 0.006705 to manage risk, offering a risk-reward ratio of approximately 1:1.08. Key levels to watch include the former support (now resistance) at 0.006640 and the resistance at 0.006705. Traders should consider additional confirmation from volume and momentum indicators, as well as broader market conditions, before executing the trade. Since this chart is from April 2, 2025, market conditions may have evolved, and I can assist with searching for more recent data if needed!

Bitcoin Rejection from Resistance – Short Setup with Bullish PotBitcoin is currently testing a key resistance zone around $85,500, where previous price action showed strong selling pressure. A rejection from this level could lead to a short-term pullback towards $83,750 - $83,250 , aligning with a retest of the broken trendline before a potential bullish continuation.
🔹 Entry: $85,200 - $85,500
🔹 Stop-Loss (SL): $86,000
🔹 Take-Profit (TP): $83,750, with potential long re-entry from this zone targeting $86,000+
📊 Watch for price action confirmation within the resistance zone before entering. If BTC holds above $85,500, the bullish breakout could accelerate. 🚀

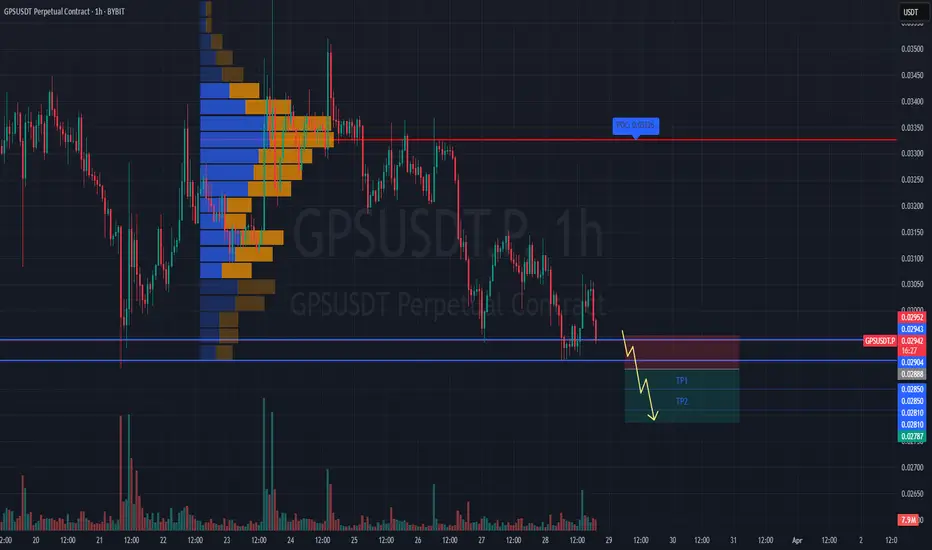
#GPSUSDT is forming a bearish structure📉 Short BYBIT:GPSUSDT.P from $0.02888
🛡 Stop loss $0.02952
🕒 1H Timeframe
⚡️ Overview:
➡️ The main POC (Point of Control) is at 0.03326, marking the highest volume zone and a major resistance above the current price.
➡️ The 0.02952 level acts as local resistance and an ideal stop placement.
➡️ Price BYBIT:GPSUSDT.P has already tested the $0.02888 support — a confirmed breakdown could trigger stronger downward momentum.
➡️ Volume is increasing on the decline, supporting the sellers' pressure.
🎯 TP Targets:
💎 TP 1: $0.02850
💎 TP 2: $0.02810
💎 TP 3: $0.02787
📢 Watch for a clean break of the $0.02888 level — it could be the entry trigger for this short setup.
📢 If price pulls back above $0.02952, the short scenario becomes invalid.
BYBIT:GPSUSDT.P is forming a bearish structure — continuation to the downside is expected if support fails.
TAO SHORTDisclaimer 👉 This is my personal analysis for educational purposes , Buy/Sell/Trade at your own risk. I am not a financial Advisor

Short Position Targeting Below $3,000🔍 Market Analysis After Durable Goods Orders Release
The latest Durable Goods Orders (MoM) for February 2025 were released today, showing a surprising 0.9% increase, while economists had expected a 1.0% decline. However, core capital goods orders fell by 0.3%, indicating weaker business investment.
These mixed figures create uncertainty in the markets. The strong durable goods orders support the U.S. dollar, while the drop in business investment may signal economic concerns. In the short term, the expectation that the Federal Reserve (Fed) will not rush to cut interest rates could put pressure on gold prices.
📉 Trading Idea: Short Gold from $3,025 to Below $3,000
Entry: $3,025 (already opened)
Gold is currently trading around $3,025, showing signs of weakness near resistance levels.
Why This Short Trade Makes Sense:
1️⃣ U.S. Economic Data Supports the Dollar
The unexpected rise in durable goods orders suggests economic resilience.
A stronger U.S. dollar typically weighs on gold prices.
2️⃣ Lower Expectations for Fed Rate Cuts
These data points may reduce expectations for imminent Fed rate cuts.
Higher rates increase the opportunity cost of holding gold, which is bearish for gold.
3️⃣ Technical Resistance & Downward Momentum
Gold has struggled to break above $3,025 - $3,035 multiple times.
If this level holds, we could see a drop below $3,000 soon.
📊 Price Targets & Stop-Loss
🎯 First Target: $3,000 (psychological support level)
🎯 Second Target: $2,985 - $2,975 (next key technical support zone)
📌 Risk-Reward Ratio (RRR):
Entry: $3,025
Target: at least $3,000
RRR = 1.66 : 1 – a solid setup for a short-term trade.
🧐 Potential Risks to the Trade
⚠ If the U.S. Dollar Weakens:
If markets interpret weak core capital goods orders as a sign of economic slowdown, the Fed might shift to a more dovish stance, weakening the dollar and boosting gold.
⚠ If Geopolitical Tensions Increase:
Rising geopolitical risks (e.g., China, Middle East) could drive safe-haven demand for gold, pushing prices higher.
📌 Conclusion: Bearish Setup for Gold
Today’s Durable Goods Orders release supports a stronger U.S. dollar, while gold is struggling to break resistance at $3,025 - $3,035. As long as this zone holds, the probability of a correction below $3,000 remains high.
🟢 Plan:
Short at $3,025 is active.
Target: Below $3,000.
Gold remains volatile – keep an eye on the U.S. dollar, Fed policy, and market sentiment for further confirmation! 🔥🚀
-------------------------------------------------------------------------
This is just my personal market idea and not financial advice! 📢 Trading gold and other financial instruments carries risks – only invest what you can afford to lose. Always do your own analysis, use solid risk management, and trade responsibly.
Good luck and safe trading! 🚀📊

continue downtrend , GOLD⭐️GOLDEN INFORMATION:
Gold price (XAU/USD) holds steady above the key $3,000 level for the second consecutive day on Wednesday, though it struggles to reclaim the previous session’s peak. Ongoing uncertainty surrounding US President Donald Trump’s proposed reciprocal tariffs set for next week continues to bolster demand for the safe-haven metal. At the same time, the US Dollar (USD) remains under pressure following Tuesday’s weaker-than-expected macroeconomic data, providing additional support for gold’s upward momentum.
⭐️Personal comments NOVA:
Gold price continues to decrease, around 2990 - 3000
⭐️SET UP GOLD PRICE:
🔥SELL GOLD zone: $3039 - $3041 SL $3046
TP1: $3030
TP2: $3020
TP3: $3010
🔥BUY GOLD zone: $2992 - $2990 SL $2985
TP1: $3000
TP2: $3008
TP3: $3018
⭐️Technical analysis:
Based on technical indicators EMA 34, EMA89 and support resistance areas to set up a reasonable SELL order.
⭐️NOTE:
Note: Nova wishes traders to manage their capital well
- take the number of lots that match your capital
- Takeprofit equal to 4-6% of capital account
- Stoplose equal to 2-3% of capital account
Gold declines, accumulate and wait for April news⭐️GOLDEN INFORMATION:
Gold price (XAU/USD) continues its pullback, slipping toward $3,025 in early Asian trading on Monday. The metal retreats from Thursday’s record high, driven by renewed optimism over a potential Ukraine peace deal. However, expectations of Federal Reserve (Fed) rate cuts and lingering economic uncertainties could provide support, limiting further downside for the yellow metal.
⭐️Personal comments NOVA:
Gold is under pressure to sell and take profits in the short term. There is still a lot of liquidity in the 3000 price zone. The price will continue to accumulate around $3000.
⭐️SET UP GOLD PRICE:
🔥SELL GOLD zone: $3031 - $3033 SL $3038
TP1: $3020
TP2: $3010
TP3: $3000
🔥BUY GOLD zone: $2991 - $2993 SL $2986
TP1: $3000
TP2: $3008
TP3: $3017
⭐️Technical analysis:
Based on technical indicators EMA 34, EMA89 and support resistance areas to set up a reasonable SELL order.
⭐️NOTE:
Note: Nova wishes traders to manage their capital well
- take the number of lots that match your capital
- Takeprofit equal to 4-6% of capital account
- Stoplose equal to 2-3% of capital account

Gold price start to adjust yet?⭐️GOLDEN INFORMATION:
Gold prices (XAU/USD) face renewed selling pressure during the Asian session on Friday, retreating toward the $3,030 level in recent trading, inching closer to the previous session’s low. The US Dollar (USD) maintains its upward trajectory for the third consecutive day, prompting some profit-taking on the precious metal ahead of the weekend. However, a confluence of supportive factors is likely to keep bullion resilient, positioning it for a third consecutive week of gains.
⭐️Personal comments NOVA:
Breaking the trend, has gold price really been in the weekend price adjustment rhythm? According to NOVA, it has started. Before the tax policies in early April, the market needs a little balance in terms of liquidity on the selling side.
⭐️SET UP GOLD PRICE:
🔥SELL GOLD zone: $3040 - $3042 SL $3047
TP1: $3030
TP2: $3020
TP3: $3010
🔥BUY GOLD zone: $3019 - $3017 SL $3014 scalping
TP1: $3023
TP2: $3030
TP3: $3040
🔥BUY GOLD zone: $3000 - $3002 SL $2995
TP1: $3010
TP2: $3020
TP3: $3030
⭐️Technical analysis:
Based on technical indicators EMA 34, EMA89 and support resistance areas to set up a reasonable SELL order.
⭐️NOTE:
Note: Nova wishes traders to manage their capital well
- take the number of lots that match your capital
- Takeprofit equal to 4-6% of capital account
- Stoplose equal to 2-3% of capital account

#AVLUSDT continues its downtrend 📉 Short BYBIT:AVLUSDT.P from $0,4060
🛡 Stop loss $0,4136
🕒 1H Timeframe
⚡️ Overview:
➡️ The main POC (Point of Control) is 0,4201
🎯 TP Targets:
💎 TP 1: $0,4015
💎 TP 2: $0,3975
💎 TP 3: $0,3945
📢 Monitor key levels before entering the trade!
BYBIT:AVLUSDT.P continues its downtrend — watching for further movement!

XAUUSD - Short Trade after Resistance Test ($3,005 - $3,010)Short after Resistance Test ($3,005 - $3,010)
📌 Entry: Sell within the $3,005 - $3,010 range if there is a clear rejection and price weakness.
🎯 Take-Profit 1: $2,985 (immediate support)
🎯 Take-Profit 2: $2,970 (recent lows)
🛑 Stop-Loss: $3,015 (above resistance)
🔹 Probability: High – Confirmed by weak volume on rallies and strong resistance.
Trade Rationale:
Key Resistance Zone ($3,005 - $3,010): This level has historically acted as a supply zone, where sellers step in to push prices lower. If price action shows rejection (e.g., wicks or bearish engulfing candles), it confirms a high-probability short setup.
Weak Volume on Rallies: Volume analysis suggests that bullish momentum lacks strong participation. A rising price with decreasing volume often signals an exhaustion of buyers, increasing the probability of a reversal.
Technical Indicators Align:
RSI (Relative Strength Index): Overbought or showing bearish divergence, signaling potential downside pressure.
MACD (Moving Average Convergence Divergence): Losing bullish momentum or forming a bearish crossover, indicating potential for a pullback.
Donchian Trend & Moving Averages : Price is testing upper Donchian bands and key moving averages are suggesting overextension.
Risk-Reward Ratio:
> The stop-loss at $3,015 ensures protection against false breakouts.
> The first take-profit ($2,985) targets the nearest support, locking in quick profits.
> The second take-profit ($2,970) aligns with recent swing lows, maximizing the downside potential.
Final RRR (TP2) is 1 : 3,4
Conclusion:
A rejection from the $3,005 - $3,010 resistance zone presents a solid short opportunity, backed by weak bullish momentum, technical confluence, and favorable risk-reward. If the price fails to break higher and shows signs of rejection, this trade setup has a strong probability of success.
⚠️ Final Warning: Trading involves significant risk, and past performance does not guarantee future results. Always use proper risk management and never trade with money you can't afford to lose. This analysis is for educational purposes only and not financial advice.
What do you think about this setup? Would you take this trade? Drop your thoughts in the comments! 👇

#REDUSDT continues its downtrend📉 Short BYBIT:REDUSDT.P from $0,7814
🛡 Stop loss $0,8061
🕒 1H Timeframe
⚡️ Overview:
➡️ The main POC (Point of Control) is 0,5802
🎯 TP Targets:
💎 TP 1: $0,7600
💎 TP 2: $0,7330
💎 TP 3: $0,7112
📢 Monitor key levels before entering the trade!
BYBIT:REDUSDT.P continues its downtrend — watching for further movement!

#OIKUSDT continues its downtrend📉 Short BITGET:OIKUSDT.P from $0,0870
🛡 Stop loss $0,0909
🕒 1H Timeframe
⚡️ Overview:
➡️ The main POC (Point of Control) is N
🎯 TP Targets:
💎 TP 1: $0,0833
💎 TP 2: $0,0795
💎 TP 3: $0,0769
📢 Monitor key levels before entering the trade!
BITGET:OIKUSDT.P continues its downtrend — watching for further movement!

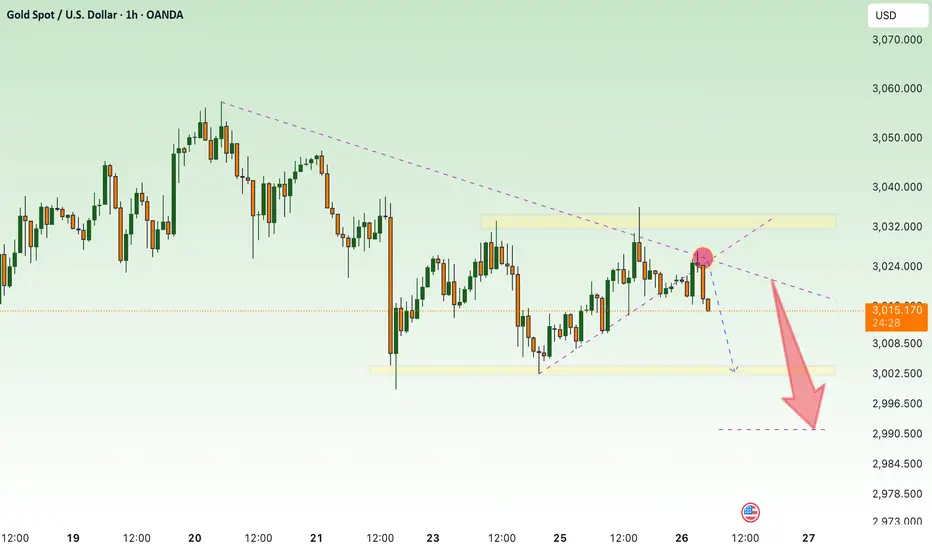
How to continue to short (2)As in my last analysis, currently XAUUSDXAUUSD is about to hit that 2945-2948
Operation policy reference:
Short Position Strategy
1:XAUUSD sell@2945-2948 20%Transaction of funds , tp:2930-2920-2910
2:XAUUSD Buy@2910-2915 20%Transaction of funds , tp:2930-2945-2955
The Signals have timeliness , if you also need to get accurate signals every day,follow the link below to get my daily strategy updates
If your account is still in the red, you need to pay attention to whether the resistance is valid. If the resistance is valid, there may be a decline. You can close your order on the decline and trade in the right direction again
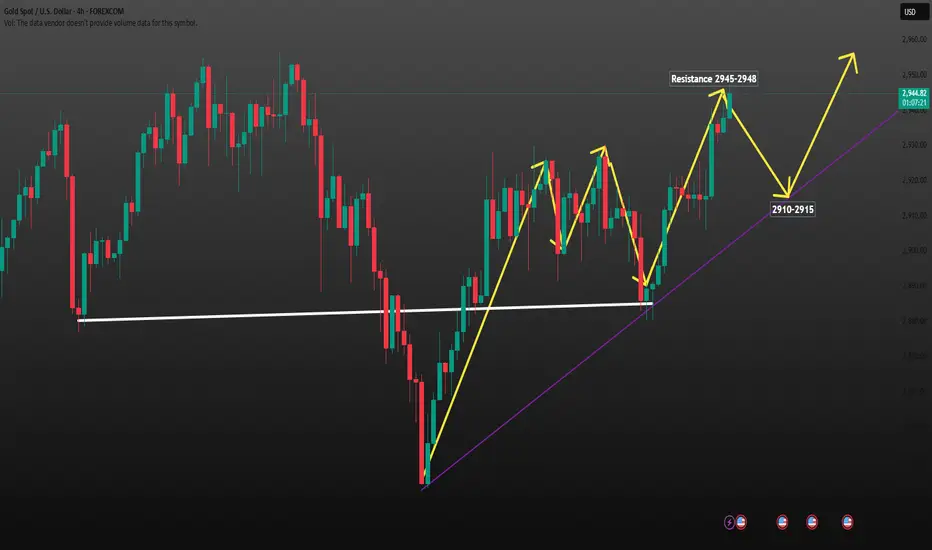
How to continue to short
After experiencing intraday volatility, XAUUSD rebounded from the bottom after the release of the Consumer Price Index (CPI) data in the evening. The price dropped to the 0.382 support level of the upward retracement at the lowest.
In terms of this retracement, the range is relatively small, which fully demonstrates that the bulls remain strong. The price level of 2930 has withstood market tests for many times, and there is a high probability of a subsequent breakout. Therefore, the main trading strategy should focus on going long and anticipating a breakout. Calculated based on the magnitude of the previous upward trend, the price of XAUUSD is expected to rise to 2940/2960.
Operation policy reference:
Short Position Strategy
1:XAUUSD sell@2945-2948 20%Transaction of funds , tp:2930-2920-2910
2:XAUUSD Buy@2910-2915 20%Transaction of funds , tp:2930-2945-2955
The Signals have timeliness , if you also need to get accurate signals every day,follow the link below to get my daily strategy updates
If your account is still in the red, you need to pay attention to whether the resistance is valid. If the resistance is valid, there may be a decline. You can close your order on the decline and trade in the right direction again

#BANANAUSDT maintains bearish momentum📉 Short BYBIT:BANANAUSDT.P from $14.905
🛡 Stop loss $15.490
🕒 1H Timeframe
⚡️ Overview:
➡️ The main POC (Point of Control) is at 16.112, indicating the area with the highest trading volume.
➡️ The 15.490 level acts as a local resistance, as the price previously faced selling pressure there.
➡️ The volume and market profile highlight areas of high trader activity, especially in the 14.250 – 15.500 range.
➡️ The chart shows a potential decline after an impulse move and profit-taking.
🎯 TP Targets:
💎 TP 1: $14.580
💎 TP 2: $14.250
💎 TP 3: $13.920
📢 Monitor key levels before entering the trade!
📢 If 15.490 is broken upward, the trade may be invalidated.
📢 If the price continues to decline and breaks through TP 1, the downside potential remains.
BYBIT:BANANAUSDT.P maintains bearish momentum — expecting further downside movement!

Gold price recovers, waiting for CPI inflation data today⭐️Smart investment, Strong finance
⭐️GOLDEN INFORMATION:
The US 10-year Treasury yield rebounds, rising six basis points to 4.282% as markets focus on potential Federal Reserve rate cuts.
Meanwhile, US real yields—measured by the 10-year Treasury Inflation-Protected Securities (TIPS), which typically move inversely to gold prices—climb 5.5 basis points to 1.963%, posing a headwind for the non-yielding metal.
The Atlanta Fed’s GDP Now model projects a -2.4% contraction for Q1 2025, marking the first negative reading since the COVID-19 pandemic.
⭐️Personal comments NOVA:
Recovering in the sideway price range below 2930
⭐️SET UP GOLD PRICE:
🔥SELL GOLD zone: $2928 - $2930 SL $2935
TP1: $2920
TP2: $2910
TP3: $2900
🔥BUY GOLD zone: $2894 - $2896 SL $2889
TP1: $2900
TP2: $2910
TP3: $2920
⭐️Technical analysis:
Based on technical indicators EMA 34, EMA89 and support resistance areas to set up a reasonable SELL order.
⭐️NOTE:
Note: Nova wishes traders to manage their capital well
- take the number of lots that match your capital
- Takeprofit equal to 4-6% of capital account
- Stoplose equal to 2-3% of capital account

Bitcoin Weekly Analysis – Retest Incoming?BTC has lost momentum after breaking above its previous high but failing to retest that level. With the $91,500 support now broken, the trend shows signs of weakness.
Unless BTC reclaims $91,500 on a weekly close, I expect a move down to the $69K - FWB:73K zone (marked in red). This level aligns with a key breakout area that hasn’t been properly tested. A retest here would be a logical step before any potential continuation upwards.
I’ll be watching for bullish reactions in this range before considering long positions. What do you think—will BTC revisit this level, or are we heading for an even deeper correction? Let me know your thoughts! 🚀🔍

H1 bearish pattern appears , XAU / USD ⭐️Smart investment, Strong finance
⭐️GOLDEN INFORMATION:
The US labor market showed signs of slowing last month, reinforcing expectations that the Federal Reserve will proceed with multiple rate cuts this year. This sentiment pressured the US Dollar while boosting the price of USD-denominated commodities.
Data from the US Bureau of Labor Statistics (BLS) on Friday revealed that Nonfarm Payrolls (NFP) rose by 151,000 in February, following January’s upwardly revised 125,000 (previously 143,000), falling short of the 160,000 market forecast.
Meanwhile, the Unemployment Rate edged up to 4.1% from 4.0% in January, while annual wage inflation, measured by Average Hourly Earnings, ticked higher to 4.0% from 3.9%, though it was revised down from an initial 4.1%.
⭐️Personal comments NOVA:
Gold price is sideways around 2910 at the beginning of the week, H1 frame shows head and shoulders pattern, downtrend
⭐️SET UP GOLD PRICE:
🔥SELL GOLD zone: $2928 - $2930 SL $2935
TP1: $2920
TP2: $2910
TP3: $2900
🔥BUY GOLD zone: $2891 - $2893 SL $2886
TP1: $2900
TP2: $2910
TP3: $2920
⭐️Technical analysis:
Based on technical indicators EMA 34, EMA89 and support resistance areas to set up a reasonable SELL order.
⭐️NOTE:
Note: Nova wishes traders to manage their capital well
- take the number of lots that match your capital
- Takeprofit equal to 4-6% of capital account
- Stoplose equal to 2-3% of capital account

SIDEWAY waiting for news this week⭐️Smart investment, Strong finance
⭐️GOLDEN INFORMATION:
As a result, investors turned to bullion for safety, driving prices toward the $2,900 mark. Meanwhile, the US 10-year Treasury yield dropped two basis points to 4.176%, its lowest level since December 2024.
Commenting on the economy, St. Louis Fed President Alberto Musalem acknowledged steady economic growth but cautioned that recent data indicate potential downside risks.
⭐️Personal comments NOVA:
Continue in correction phase - gold price under selling pressure below 2900. Sideway and waiting for important news this week
⭐️SET UP GOLD PRICE:
🔥 BUY GOLD zone: $2851 - $2853 SL $2846
TP1: $2860
TP2: $2870
TP3: $2880
🔥 SELL GOLD zone: $2898 - $2900 SL $2905
TP1: $2890
TP2: $2880
TP3: $2870
⭐️Technical analysis:
Based on technical indicators EMA 34, EMA89 and support resistance areas to set up a reasonable SELL order.
⭐️NOTE:
Note: Nova wishes traders to manage their capital well
- take the number of lots that match your capital
- Takeprofit equal to 4-6% of capital account
- Stoplose equal to 2-3% of capital account

Gold short term recovery - downtrend⭐️Smart investment, Strong finance
⭐️GOLDEN INFORMATION:
Gold prices (XAU/USD) start the week on a strong footing, rebounding further from Friday’s three-week low near $2,833–2,832. Despite US inflation data aligning with expectations, traders remain confident that the Federal Reserve will implement two quarter-point rate cuts by year-end. Additionally, renewed selling pressure on the US Dollar supports the appeal of the non-yielding yellow metal.
⭐️Personal comments NOVA:
Gold price recovers in short term, sellers are dominating, retesting liquidity zone 2883
⭐️SET UP GOLD PRICE:
🔥 BUY GOLD zone: $2832 - $2834 SL $2827
TP1: $2840
TP2: $2850
TP3: $2960
🔥 SELL GOLD zone: $2883 - $2885 SL $2890
TP1: $2875
TP2: $2868
TP3: $2860
⭐️Technical analysis:
Based on technical indicators EMA 34, EMA89 and support resistance areas to set up a reasonable SELL order.
⭐️NOTE:
Note: Nova wishes traders to manage their capital well
- take the number of lots that match your capital
- Takeprofit equal to 4-6% of capital account
- Stoplose equal to 2-3% of capital account

Downward momentum, downtrend next week, XAU ✍️ NOVA hello everyone, Let's comment on gold price next week from 03/3/2025 - 03/07/2025
🔥 World situation:
US President Donald Trump confirmed that 25% tariffs on Mexican and Canadian goods will take effect next week on March 4. Meanwhile, the Fed’s preferred inflation gauge, the Core PCE Price Index, signaled continued progress toward the central bank’s 2% target.
Following the data, expectations for further Fed policy easing grew. According to Prime Market Terminal, the Fed is anticipated to cut rates by 70 basis points this year, with investors betting on the first reduction in June.
🔥 Identify:
Breaking the trend, gold continues to maintain a downtrend
🔥 Technically:
Based on the resistance and support areas of the gold price according to the H4 frame, NOVA identifies the important key areas as follows:
Resistance: $2876, $2903, $2956
Support : $2810, $2773
🔥 NOTE:
Note: Nova wishes traders to manage their capital well
- take the number of lots that match your capital
- Takeprofit equal to 4-6% of capital account
- Stoplose equal to 2-3% of capital account
- The winner is the one who sticks with the market the longest
