eurusd short setupeurusd has an engulf south the price and this inner fl would be a great supply zone for fake out and then there would be a great bearish trend
Shorttrade

cadjpy sella good short setup for CADJPY, there is a good chance for CADJPY to start a bearish trend from here

Risk to Reward Ratio is the key to constant wins at tradingI love writing those articles on my Blog, mainly because I learn from reviewing my trades & secondary for the value it gives back to the trading community.
I been preaching Trading is simple but not easy. It is based on following a winning trade plan. & how do you find such a plan? Try & fail, Try & succeed there is no other way. There is the possibility of a generous soul teaching how a winning strategy & thats what I hope to do in this article. I will share 2 rules
Rule number 1 Always trade the bigger picture.
Find out what the bigger picture chart is doing & trade based on that. In this trade am placing my trade decision in the (W) chart the top chart in white. My bigger picture chart is the monthly (M) not shown. And the chart I use to time my enter & exit is the Day chart (D) below in Black
Rule number 2 Risk to Reward ratio,
This should be rule #1 but I placed it as number 2 to add importance to the rules of trading the bigger picture. Aim for a Risk to Reward ratio of 3 to 5. This means you asses the Risk (how. much money you can loose) before you asses the Reward (how much money you can win).
In this trade, the bigger picture chart (M) is in a downtrend. The trading chart (W) comes into untested Supply Zone (SZ) with a Risk of less than a dollar. I take my SHRT in the red Circle
The reward is 4-5 dollars per share, mostly due to a price free fall zone, with little Demand zone (DZ) to challenge the price. I took profit at two point marked by the red X in the Daily chart.
There are odd enhancers as to why I took this trade, but they are outside the scope of this blog. If you like to learn more about my winning trading strategy that I been practicing for 11 years. Follow my Blog & learn to trade smarter.

XAUUSD Bearish TrendXAUUSD Bearish Trend showing in 1 hour Chart that there is Bearish Divergence , and the trend reversal from the exact Bearish Point, now to get the Entry Put the FIB Retrc Entry Point is already Defined & TP1 & TP2 Set Accordingly,

Daily Wave Rider - SELL NZDUSDNZDUSD
Channel: RED
WK Pivot: RED
AOB: 10
CON: SBB
SELL Stop: 0.5867
Stop Loss: 0.5921
TP01: 0.5813
TP02: 0.5705
DWR presents as a sell setup on 11SEP, with Channel and Pivot are red bouncing off SMA 10.
However, trade is not taken/considered as it differs from our Market Analysis Bias.
SPX500: Up
DXY: Down
OIL: Up
GOLD: Up
Reference to our WK37 analysis, we are anticipating a "Risk-On" sentiments thus will BUY AUD/NZD.

Daily Wave Rider - SELL NZDCADNZDCAD
Channel: RED
WK Pivot: RED
AOB: WP
CON: SBB
SELL Stop: 0.8022
Stop Loss: 0.8081
TP01: 0.7963
TP02: 0.7845
DWR presents as a sell setup on 11SEP, with Channel and Pivot are red bouncing off weekly pivot.
However, trade is not taken/considered as it differs from our Market Analysis Bias.
SPX500: Up
DXY: Down
OIL: Up
GOLD: Up
Reference to our WK37 analysis, we are anticipating a "Risk-On" sentiments thus will BUY AUD/NZD.

Daily Wave Rider - SELL AUDUSDAUDUSD
Channel: RED
WK Pivot: RED
AOB: WS1
CON: SBB
SELL Stop: 0.6366
Stop Loss: 0.6417
TP01: 0.6315
TP02: 0.6213
DWR presents as a sell setup on 11SEP, with Channel and Pivot are red bouncing off Weekly support 1.
However, trade is not taken/considered as it differs from our Market Analysis Bias.
SPX500: Up
DXY: Down
OIL: Up
GOLD: Up
Reference to our WK37 analysis, we are anticipating a "Risk-On" sentiments thus will BUY AUD/NZD.

Daily Wave Rider - SELL AUDCHFAUDCHF
Channel: RED
WK Pivot: RED
AOB: WP
CON: IB
SELL Stop: 0.5678
Stop Loss: 5711
TP01: 0.55826
TP02: 0.5630
DWR presents as a sell setup on 11SEP, with Channel and Pivot are red bouncing off Weekly pivot.
However, trade is not taken/considered as it differs from our Market Analysis Bias.
SPX500: Up
DXY: Down
OIL: Up
GOLD: Up
Reference to our WK37 analysis, we are anticipating a "Risk-On" sentiments thus will BUY AUD/NZD.

Daily Wave Rider - SELL AUDCADChannel: RED
WK Pivot: RED
AOB: EMA10
CON: SBB
SELL Stop: 0.8688
Stop Loss: 0.8760
TP01: 0.8616
TP02: 0.8588
DWR present as a sell setup on 11SEP, with Channel and Pivot are red bouncing off EMA10.
However, trade is not taken/considered as it differs from our Market Analysis Bias.
SPX500: Up
DXY: Down
OIL: Up
GOLD: Up
Reference to our WK37 analysis, we are anticipating a "Risk-On" sentiments thus will BUY AUD/NZD.

Symmetrical Triangle continuationAUDJPYSymmetrical Triangle continuation Pattern in 1 Hour Chart AUDJPY, its show that might they Break out from this point to Upward Direction, showing bullish Trend. Entry Price & TP1 & TP2 Set Accordingly Stop Loss for Long: 93.939,
For Plan B Entry price is also set for Short Trade might this go from this Point to down ward so we set trade accordingly & Entry Price & Stop Loss for Short Trade is 94.326 also Defined with TP1 & TP2 as well.
Symmetrical Triangle continuation Pattern might take break out both side so we already make plan for the both side trades, once one side trade is active, so cancelled the other side, wait & watch

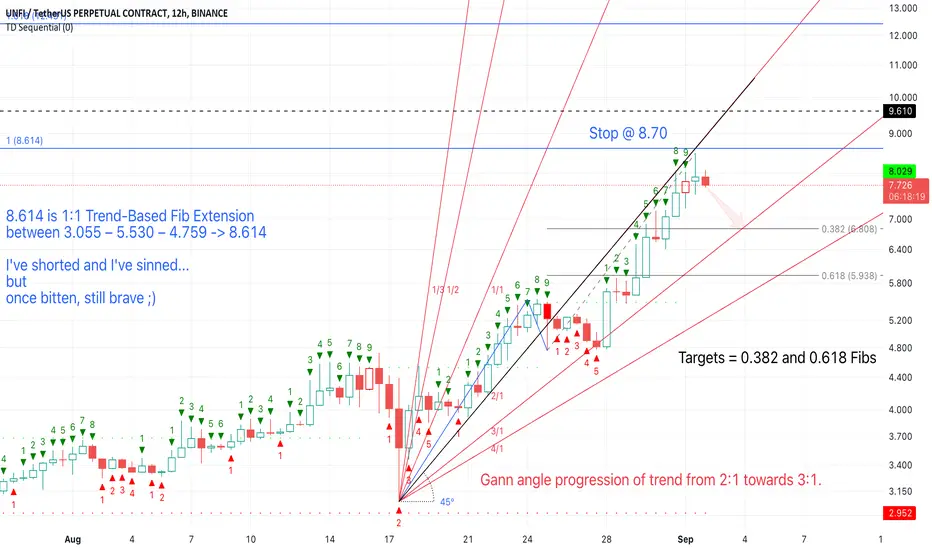
UNFI/USDT I've shorted and I've sinned... but 💪 😎I've shorted and I've sinned...
but
once bitten, still brave ;)
8.614 is 1:1 Trend-Based Fib Extension
between 3.055 – 5.530 – 4.759 -> 8.614
Gann angle progression of trend from 2:1 towards 3:1.
Stop @ 8.70
Targets = 0.382 and 0.618 Fibs, that is 6.81 and 5.94.
LPT EZ MoneyWe need some money so we must wait for breakout and open it later.
Give me like if you agree ! Eazy money for us !
Good luck my friends

PENDLEUSDT Looks Bearish! PENDLEUSDT Technical analysis update
Short level: $0.625 - $0.629
Stop loss : $0.654
Take Profit 1 : $0.605
Take Profit 2 : $0.560
Take Profit 3 : $0.465
Thanks
Hexa

BCH Targets Hit as PredictedBCH had a very nice run, but when you properly apply divergence indicators and TD counts on the right timeframes... it's not that hard to spot a good short.

USD/CHF - Too many signs to ignore!!Time Frame:
Weekly/Daily – Analysis & Levels
1 HR – Confirmation
1 HR/30 Min - Execution
Trend: LTF Pullback within HTF downtrend. Resistance and bounce at 50% retracement on fib.
- HTF (Daily) = Downtrend
- LTF (1 Hour) = Uptrend
This trade has a lot of confluence for us to have a pretty sizable move to the downside.
1. We have a symmetrical triangle pattern (in black) holding us within these levels since 2012. In July 2023 we broke out of this pattern with a ton of strength, bringing us down to a level of strong support and a low since 2015.
2. Price rebounded from this support but with unimpressive volume, leading me to believe there is a lack of liquidity for buyers to get the necessary push up to break back into the triangle and former trading zone.
3. This rebound/retrace also led us to 50% on the fib which we are holding strong at with strong rejection indications.
4. We currently in an already mitigated demand zone that was formed from a prior liquidity grab – and below that, a strong unmitigated demand zone & POI.
5. We are approaching a retest of the bottom of the triangle which will require a lot of volume to break through – ans at the same time, we are approaching the top of the daily trend line (blue) in which we have rejected 3 times this year.
Confluence Review:
1. Continue higher time frame downtrend
2. Break below weekly/10 year trend line/support channel – Heading for retest of break point
3. Top of strong selling channel which has proven to be resistance 3 times
4. Strong support @ .857 that led to rebound but with low buying volume
5. Resistance at 50% retrace (current price)
My Trade Plan and Hypothesis:
Trade 1: Resistance at upper blue trend line and failed support at lower green trend line.
I predict price to mitigate the lower demand zone/POI. I will wait for price to reject the top of our LTF selling channel (blue trendline on daily chart) and subsequently fail support on the LTF buying channel (Green trendline on 1 hour chart).
Stop Loss – Above/break of blue trendline
Take Profit 1 – Strong Weekly Support / Recent Lower Low = 2.32 R:R
Take Profit 2 – Unmitigated Demand Zone / POI = 6.5 R:R
Trade 2: - Resistance and failure to break back into black HTF triangle.
If price breaks out of the daily TF blue selling channel, I will wait for a retest of the bottom of weekly symmetrical triangle (black trendline on all charts). Once there are signs of strong rejection I will enter trade on 30min/1 hour timeframe.
Stop Loss – Above/break of bottom of weekly channel
Take Profit - Unmitigated Demand Zone / POI = 7.38 R:R

BCH/USD ShortShorting opportunity, 15m play, waiting for TD9 confirmation and a red Heikin Ashi candle.
Bearish divergence already setting in.
Targets 213 and 206.

UNFI/USDT Futures Short on 3hUNFI/USD Futures 3-hour: An actionable setup here. Shorting into strength with signs of losing steam. Particularly like the double top scenario.

Shorting ARKMUSDTShorting from 0.44 with initial Target 0.4 then will update rest of 75% . SL is last 0.5
Happy Selling

$RUNE Short IdeaPlan is simple.
Break the trend line = short to the box.
Dotted green line is TP1.
Let's see.

EUR/USD Prediction on 25.08.2023 The Gross Domestic Product (GDP) of a country is one of the primary indicators of its economic health. It reflects the total market value of all goods and services produced over a specific time period within a country's borders. When the GDP of a dominant economy within a currency zone, like Germany in the Eurozone, shows a bearish trend, it can have profound effects on the currency, in this case, the Euro (EUR).
Dominance of the German Economy in the Eurozone: Germany is the largest economy in the Eurozone, contributing a significant portion of the zone's aggregate GDP. As a result, its economic performance often serves as a barometer for the entire Eurozone's health. A bearish GDP trend in Germany can, therefore, suggest a potential slowdown across the entire Euro area.
Investor Confidence: A declining GDP often points to broader economic issues. This can include declining industrial production, reduced consumer spending, or challenges in the services sector, among other factors. As a consequence, investors might perceive the Eurozone as a riskier investment, leading to capital outflows and a reduced demand for the Euro, thus driving its value down.
Monetary Policy Implications: The European Central Bank (ECB) closely monitors economic indicators like the GDP to shape its monetary policy. A bearish GDP trend in Germany might prompt the ECB to adopt a more accommodative monetary policy to stimulate growth, such as cutting interest rates or implementing quantitative easing. These measures often lead to a depreciation of the currency as lower interest rates tend to reduce foreign capital inflows seeking higher returns.
Trade Balance Implications: Germany is a significant exporter, and a bearish GDP might reflect challenges in its export sector, potentially due to global economic conditions or decreased competitiveness. If German exports decline, it could result in a deteriorating trade balance for the Eurozone, further placing downward pressure on the Euro.
Psychological Factor: The financial markets are influenced not only by tangible factors but also by traders' and investors' perceptions. A slowdown in Germany, given its economic stature, can create a bearish sentiment around the Euro, leading market participants to short the currency or look for safer investment alternatives.
Potential Ripple Effects: While Germany is the primary focus here, a downturn in its economy could impact its trading partners within the Eurozone. As trade and investment links are dense among Eurozone countries, a slowdown in one major economy can have spill-over effects, creating a feedback loop that amplifies the bearish sentiment.

DIS Short: Break down from descending triangleServe DIS right for pursuing the Woke agenda. I guessed Little Mermaid is bad enough but Snow White is probably the straw that breaks the camel's back.
I've been monitoring this for a long time and finally it broke down.

British Pound Futures 6BV3Disclaimer-Doing this mobile, it really sucks to be honest but here we go.
British Pound October 2023 - Short
Why V instead of U, concerns about the open interest on the September contracts on the CME. Open interest shirks about one month out, don’t get left holding the bag. For option traders, this does not affect your trade, your preference should be 6BU3 not 6BV3, futures is different.
In the last 15 years has a probability of success of 66%. Not the greatest however this 66% is “targets achieved” so as long as it is managed and not “set and forget” you should get some profit out of it. My first target for assessment is at 1.25$ or about there (mobile) that is a .02->.03 draw down and then the king killer target is at 1.21 which is over the last 15yr the high end for profit (.07$) which also lines up with support levels. However just because it lines up doesn’t mean sh*t. Setups could include a calendar spread, back end contract best option would be March imo, or you can hedge the risk on the USD (DX! U3 or V3 on ICE or something)on a long dated or tight (close stops)6BV3 contract.
Option dawgs
Best case you buy the put and are in it for a short time bc extrinsic value on the option contract will increase so I would not leave it open til the 29th unlike a futures contract. Selling premium here instead is safer however you won’t make as much $ as a bought put. I may wait on the credit side until it recovers in Dec. Whether you’re running the option naked or as a debit spread it should be managed regularly.
I cannot post external sites/info however reach out to me and I can provide further documentation. Hope this is readable……
“Where are the kids?”
-kewlkat

EURUSD - Short trade FX:EURUSD
Based on swing trade idea, using Fibs on daily TF, I see an opportunity to short this pair using fibs level and price action, swing high and swing low on higher time frames.
Also EMA 200-100-50-20 indicate a strong downtrend
Current short move started from around 1.126 where EUR/USD finds the resistance level
Last 3 highs and lows create an rising channel but overall the pair is bearish and if we move to Monthly TF can observe better the area were we are, testing the previous support that becomes resistance for current move.
