BAKE - Some POIs that Blue box could be a nice short possibility.
Just wait until it reaches there then new small TA regarding Volume, then probably Short.
Follow for more ideas/Signals. 💲
Look at my other ideas 😉
Just donate some of your profit to Animal rights and rescue or other charity :)✌️
Signal

SAND - new LevelsCurrently this green move through small blue box is like a Short Squeeze.
For me that upper bigger blue box is more interesting for a Short.
A short right now would be 60/40 chance for a win.
I wait, but the POC could be nice 2% Short possibility too :)
Follow for more ideas/Signals. 💲
Look at my other ideas 😉
Just donate some of your profit to Animal rights and rescue or other charity :)✌️

RUNE - Some interesting Levels/POIsEyes on these levels.
Especially VAH and blue box for small Short.
Wait until it reaches there and new small TA regarding Volume then decide to Short.
That blue box could be a rotation level too!
Follow for more ideas/Signals. 💲
Look at my other ideas 😉
Just donate some of your profit to Animal rights and rescue or other charity :)✌️

BTC - Nice TA/Signal given 2 days ago !I wrote in my group, that blue TL will hold again.
Now : Boom 3.5 % 💰 💵 💲
My Original TA 2 days ago:
Follow for more ideas/Signals. 💲
Look at my other ideas 😉
Just donate some of your profit to Animal rights and rescue or other charity :)✌️

XRP - PERFECT Prediction/Signal.Those levels were hilarious.
I post the link to Original Signal/TA here so can you track it.
Look how many Short were possible.
over 17 %
I wrote : "Short the sht out of it if the lower blue trend line (marked as blue) breaks downward."
Then : Booooommmm ..... 💰 💵 💲
You had so many Short possibilities.
Original Signal/TA:https://www.tradingview.com/chart/XRPUSDT.P/V6Skh0wm-XRP-Looks-Bearish/
Follow for more ideas/Signals. 💲
Look at my other ideas 😉
Just donate some of your profit to Animal rights and rescue or other charity :)✌️

LTC - Perfect Signal/TA Was Given Days AgoLook at those Levels.
I post both previous signal too, so you you can track it and see how those Levels and Lines played out nicely :).
I wrote : "Lower points like VAL and last low are local key levels. If the price loses these levels, then a it goes lower."
We got several beautiful Short, even a small long.
💲💵 7.6 %
💲💵 6.6 %
💲💵 5.9 %
💲💵 2.5 %
and even more ... 👌 🎯
TA given on 16th March:https://www.tradingview.com/chart/LTCUSDT/Uuxk9kRM-LTC-Some-POIs-Better-to-Short/
Follow for more ideas/Signals. 💲
Look at my other ideas 😉
Just donate some of your profit to Animal rights and rescue or other charity :)✌️

USDCHF The Target Is UP! BUY!
My dear friends,
Please, find my technical outlook for USDCHF below:
The price is coiling around a solid key level - 0.8806
Bias - Bullish
Technical Indicators: Pivot Points Low anticipates a potential price reversal.
Super trend shows a clear buy, giving a perfect indicators' convergence.
Goal - 0.8825
About Used Indicators:
The pivot point itself is simply the average of the high, low and closing prices from the previous trading day.
Disclosure: I am part of Trade Nation's Influencer program and receive a monthly fee for using their TradingView charts in my analysis.
———————————
WISH YOU ALL LUCK

USOIL My Opinion! BUY!
My dear subscribers,
This is my opinion on the USOIL next move:
The instrument tests an important psychological level 68.97
Bias - Bullish
Technical Indicators: Supper Trend gives a precise Bullish signal, while Pivot Point HL predicts price changes and potential reversals in the market.
Target - 69.31
About Used Indicators:
On the subsequent day, trading above the pivot point is thought to indicate ongoing bullish sentiment, while trading below the pivot point indicates bearish sentiment.
Disclosure: I am part of Trade Nation's Influencer program and receive a monthly fee for using their TradingView charts in my analysis.
———————————
WISH YOU ALL LUCK

EURUSD Will Collapse! SELL!
My dear friends,
EURUSD looks like it will make a good move, and here are the details:
The market is trading on 1.0828 pivot level.
Bias - Bearish
Technical Indicators: Supper Trend generates a clear short signal while Pivot Point HL is currently determining the overall Bearish trend of the market.
Goal - 1.0792
About Used Indicators:
Pivot points are a great way to identify areas of support and resistance, but they work best when combined with other kinds of technical analysis
Disclosure: I am part of Trade Nation's Influencer program and receive a monthly fee for using their TradingView charts in my analysis.
———————————
WISH YOU ALL LUCK

SOL/USD Technical Analysis (March 31, 2025)🔹 Potential Scenarios:
✅ Bullish Path (Green): If the price holds above the Golden Pocket (119.89 - 121.15) and breaks 147.38, it may continue rising toward 165-176 and possibly 201-210.
❌ Bearish Path (Red): A drop below 112.40 could push the price toward 109-119, and further breakdown may lead to 78-86 or even 51-57 in extreme cases.
🔄 Neutral/Alternative Path (Yellow): If support holds but no strong breakout occurs, the price may consolidate and later move in either direction.
💡 Key Levels to Watch:
Resistance: 147.38, 165-176, 201-210, 272+
Support: 119-121 (Golden Pocket), 112.40, 78-86, 51-57
📌 Keep an eye on price reactions at these levels to confirm the next move.

NZDJPY: Long Trade Explained
NZDJPY
- Classic bullish pattern
- Our team expects retracement
SUGGESTED TRADE:
Swing Trade
Buy NZDJPY
Entry - 84.764
Stop - 84.140
Take - 85.960
Our Risk - 1%
Start protection of your profits from lower levels
Disclosure: I am part of Trade Nation's Influencer program and receive a monthly fee for using their TradingView charts in my analysis.
❤️ Please, support our work with like & comment! ❤️

AUDUSD: Long Trade with Entry/SL/TP
AUDUSD
- Classic bullish setup
- Our team expects bullish continuation
SUGGESTED TRADE:
Swing Trade
Long AUDUSD
Entry Point - 0.6221
Stop Loss - 0.6186
Take Profit - 0.6287
Our Risk - 1%
Start protection of your profits from lower levels
Disclosure: I am part of Trade Nation's Influencer program and receive a monthly fee for using their TradingView charts in my analysis.
❤️ Please, support our work with like & comment! ❤️

GOLD On The Rise! BUY!
My dear friends,
Please, find my technical outlook for GOLD below:
The instrument tests an important psychological level 3120.98
Bias - Bullish
Technical Indicators: Supper Trend gives a precise Bullish signal, while Pivot Point HL predicts price changes and potential reversals in the market.
Target - 3135.5
Recommended Stop Loss - 3113.1
About Used Indicators:
Super-trend indicator is more useful in trending markets where there are clear uptrends and downtrends in price.
Disclosure: I am part of Trade Nation's Influencer program and receive a monthly fee for using their TradingView charts in my analysis.
———————————
WISH YOU ALL LUCK

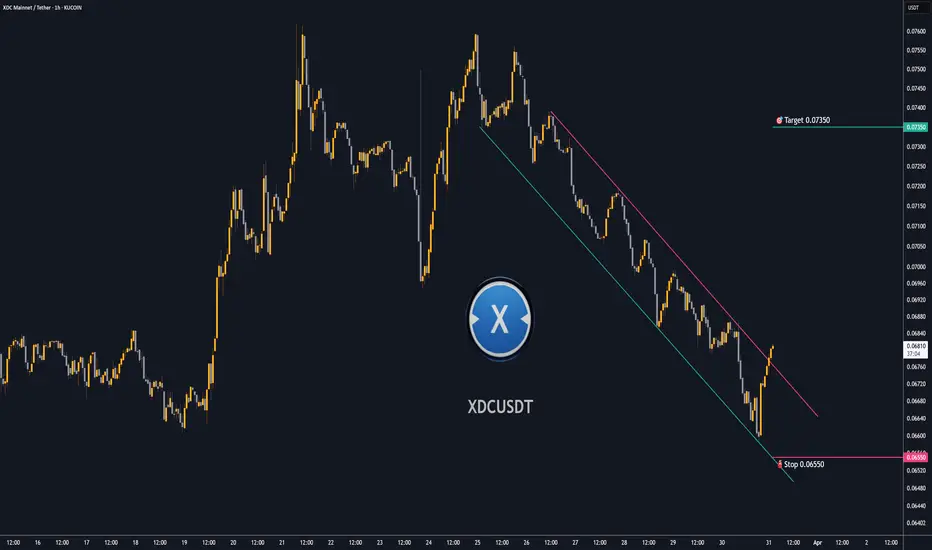
Trading opportunity for XDCUSDTBased on technical factors there is a Buy position in :
📊 XDCUSDT
🔵 Buy Now
🪫Stop loss 0.06550
🔋Target 0.07350
📏 R/R 2
💸RISK : 1%
We hope it is profitable for you ❤️
Please support our activity with your likes👍 and comments📝
QQQ: Bullish Continuation & Long Trade
QQQ
- Classic bullish formation
- Our team expects growth
SUGGESTED TRADE:
Swing Trade
Buy QQQ
Entry Level - 468.97
Sl - 457.71
Tp - 491.73
Our Risk - 1%
Start protection of your profits from lower levels
Disclosure: I am part of Trade Nation's Influencer program and receive a monthly fee for using their TradingView charts in my analysis.
❤️ Please, support our work with like & comment! ❤️

AUDCAD Trading Opportunity! BUY!
My dear subscribers,
My technical analysis for AUDCAD is below:
The price is coiling around a solid key level - 0.9004
Bias - Bullish
Technical Indicators: Pivot Points Low anticipates a potential price reversal.
Super trend shows a clear buy, giving a perfect indicators' convergence.
Goal - 0.9043
My Stop Loss - 0.8981
About Used Indicators:
By the very nature of the supertrend indicator, it offers firm support and resistance levels for traders to enter and exit trades. Additionally, it also provides signals for setting stop losses
Disclosure: I am part of Trade Nation's Influencer program and receive a monthly fee for using their TradingView charts in my analysis.
———————————
WISH YOU ALL LUCK

SILVER: Short Trade with Entry/SL/TP
SILVER
- Classic bearish setup
- Our team expects bearish continuation
SUGGESTED TRADE:
Swing Trade
Short SILVER
Entry Point - 34.116
Stop Loss - 34.505
Take Profit - 33.483
Our Risk - 1%
Start protection of your profits from lower levels
Disclosure: I am part of Trade Nation's Influencer program and receive a monthly fee for using their TradingView charts in my analysis.
❤️ Please, support our work with like & comment! ❤️

BTCUSD What Next? BUY!
My dear followers,
I analysed this chart on BTCUSD and concluded the following:
The market is trading on 82719 pivot level.
Bias - Bullish
Technical Indicators: Both Super Trend & Pivot HL indicate a highly probable Bullish continuation.
Target - 85417
Safe Stop Loss - 81310
About Used Indicators:
A super-trend indicator is plotted on either above or below the closing price to signal a buy or sell. The indicator changes color, based on whether or not you should be buying. If the super-trend indicator moves below the closing price, the indicator turns green, and it signals an entry point or points to buy.
Disclosure: I am part of Trade Nation's Influencer program and receive a monthly fee for using their TradingView charts in my analysis.
———————————
WISH YOU ALL LUCK

EURCAD Massive Long! BUY!
My dear subscribers,
EURCAD looks like it will make a good move, and here are the details:
The market is trading on 1.5441 pivot level.
Bias - Bullish
My Stop Loss - 1.5341
Technical Indicators: Both Super Trend & Pivot HL indicate a highly probable Bullish continuation.
Target - 1.5603
About Used Indicators:
The average true range (ATR) plays an important role in 'Supertrend' as the indicator uses ATR to calculate its value. The ATR indicator signals the degree of price volatility.
Disclosure: I am part of Trade Nation's Influencer program and receive a monthly fee for using their TradingView charts in my analysis.
———————————
WISH YOU ALL LUCK

GBPCHF Massive Short! SELL!
My dear subscribers,
GBPCHF looks like it will make a good move, and here are the details:
The market is trading on 1.1428 pivot level.
Bias - Bearish
Technical Indicators: Both Super Trend & Pivot HL indicate a highly probable Bearish continuation.
Target - 1.1410
About Used Indicators:
The average true range (ATR) plays an important role in 'Supertrend' as the indicator uses ATR to calculate its value. The ATR indicator signals the degree of price volatility.
Disclosure: I am part of Trade Nation's Influencer program and receive a monthly fee for using their TradingView charts in my analysis.
———————————
WISH YOU ALL LUCK

BNB/USDT – Bullish Channel Breakout in Play?
#BNB/USDT #Analysis
Description
---------------------------------------------------------------
📉 Pair: BNB/USDT (Binance, 1W Chart)
📊 Analysis by: VectorAlgo
Binance Coin (BNB) has been trading within a well-defined ascending channel, showing strong bullish momentum since mid-2023. The price is currently near the mid-range of the channel and is attempting to push higher.
- Ascending Channel: BNB is trending upwards, respecting both support and resistance levels within this channel.
- Moving Averages: The price is holding above key EMAs, reinforcing bullish sentiment.
- Potential Upside Target: If the trend continues, the next major resistance could be between $900–$1,100.
- Support Levels: If a pullback occurs, watch for support near $500–$550 as a potential buy zone.
Long Entry: Dips into the lower trendline (~$550) could be buying opportunities.
Breakout Play: If BNB clears the mid-channel resistance around $730, a move toward $900+ is likely.
Risk Management: A breakdown below the channel (~$500) could invalidate the bullish setup.
📢 What’s Your Outlook?
Is BNB heading toward new highs, or will we see a deeper pullback? Drop your thoughts below!
---------------------------------------------------------------
Enhance, Trade, Grow
---------------------------------------------------------------
Feel free to share your thoughts and insights. Don't forget to like and follow us for more trading ideas and discussions.
Best Regards,
VectorAlgo

SOL/USDT – Key Support Test: Will It Hold or Break?#SOL/USDT #Analysis
Description
---------------------------------------------------------------
Solana (SOL) has been in a strong uptrend since late 2023, but recent price action suggests a key test of support around the $115–$135 zone. This level was previously a major resistance and is now being retested as support.
Moving Averages: The price has dipped below the shorter EMAs but is still above the long-term moving average.
Bearish Momentum: The recent sharp drop suggests selling pressure, but the support zone could lead to a reversal.
Two Scenarios:
🔼 Bullish: If the support holds, SOL could bounce back towards $180+ and continue its uptrend.
🔽 Bearish: If support breaks, a deeper correction to $43–$60 is possible.
📊 Trading Strategy
Long Entry: If a strong bounce occurs from the $115–$135 zone, targeting $180+.
Short Entry: A confirmed breakdown below $115 could trigger a move toward $60 or lower.
---------------------------------------------------------------
Enhance, Trade, Grow
---------------------------------------------------------------
Feel free to share your thoughts and insights. Don't forget to like and follow us for more trading ideas and discussions.
Best Regards,
VectorAlgo

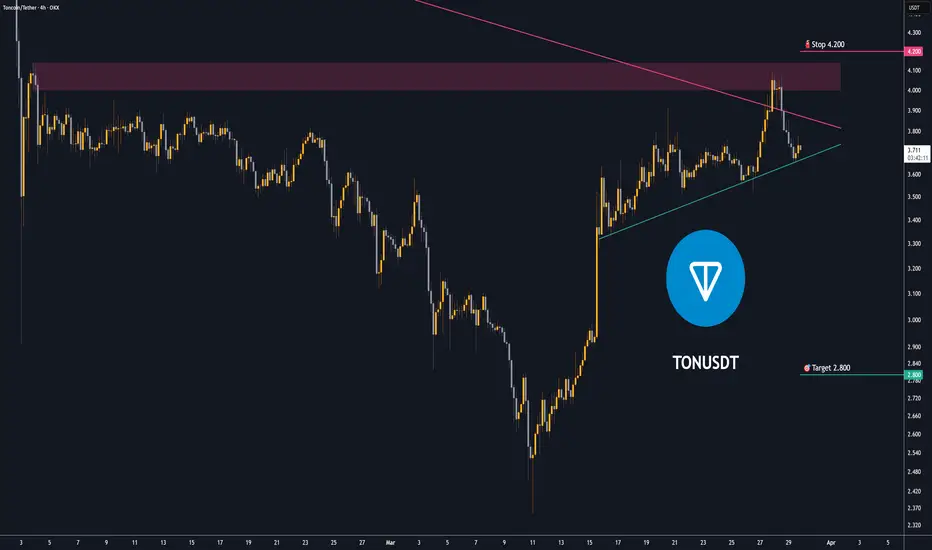
Trading opportunity for TONUSDTBased on technical factors there is a Sell position in :
📊 TONUSDT
🔴 Sell Now
🪫Stop loss 4.200
🔋Target 2.800
📏 R/R 2
💸RISK : 1%
We hope it is profitable for you ❤️
Please support our activity with your likes👍 and comments📝