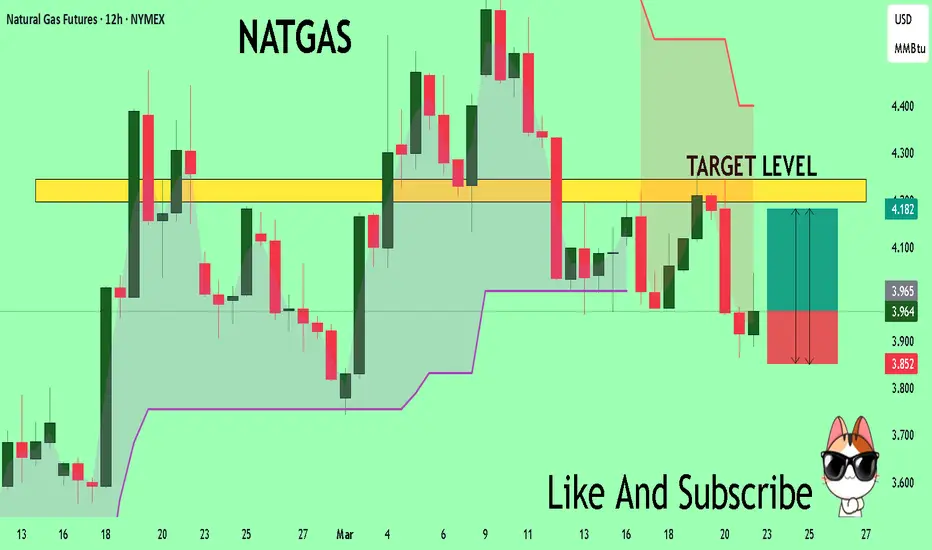
NATGAS What Next? BUY!
My dear friends,
Please, find my technical outlook for NATGAS below:
The instrument tests an important psychological level 3.964
Bias - Bullish
Technical Indicators: Supper Trend gives a precise Bullish signal, while Pivot Point HL predicts price changes and potential reversals in the market.
Target - 4.197
Recommended Stop Loss - 3.852
About Used Indicators:
Super-trend indicator is more useful in trending markets where there are clear uptrends and downtrends in price.
———————————
WISH YOU ALL LUCK
Signal
BTC - Let's Keep It Simple!Hello TradingView Family / Fellow Traders. This is Richard, also known as theSignalyst.
🏢BTC Building Blocks:
📉 Short-Term Bearish:
BTC is currently trading within a short-term bearish block between $81,200 and $87,500.
📉 Long-Term Bullish:
If the $81,200 low is broken to the downside, BTC is expected to enter the long-term bearish block.
📈 Short-Term Bullish:
If BTC breaks above the short-term bullish block at $87,500, it will enter a short-term bullosh block phase towards the $95,000 structure.
📈 Long-Term Bullish:
If the $95,000 level is broken to the upside, a long-term bullish movement toward the all-time high would be expected.
📚 Always follow your trading plan regarding entry, risk management, and trade management.
Good luck!
All Strategies Are Good; If Managed Properly!
~Rich

USOIL: Short Trade with Entry/SL/TP
USOIL
- Classic bearish formation
- Our team expects pullback
SUGGESTED TRADE:
Swing Trade
Short USOIL
Entry - 68.25
Sl - 68.94
Tp - 67.09
Our Risk - 1%
Start protection of your profits from lower levels
Disclosure: I am part of Trade Nation's Influencer program and receive a monthly fee for using their TradingView charts in my analysis.
❤️ Please, support our work with like & comment! ❤️

TESLA Trading Opportunity! SELL!
My dear followers,
I analysed this chart on TESLA and concluded the following:
The market is trading on 249.11 pivot level.
Bias - Bearish
Technical Indicators: Both Super Trend & Pivot HL indicate a highly probable Bearish continuation.
Target - 240.93
About Used Indicators:
A super-trend indicator is plotted on either above or below the closing price to signal a buy or sell. The indicator changes color, based on whether or not you should be buying. If the super-trend indicator moves below the closing price, the indicator turns green, and it signals an entry point or points to buy.
Disclosure: I am part of Trade Nation's Influencer program and receive a monthly fee for using their TradingView charts in my analysis.
———————————
WISH YOU ALL LUCK

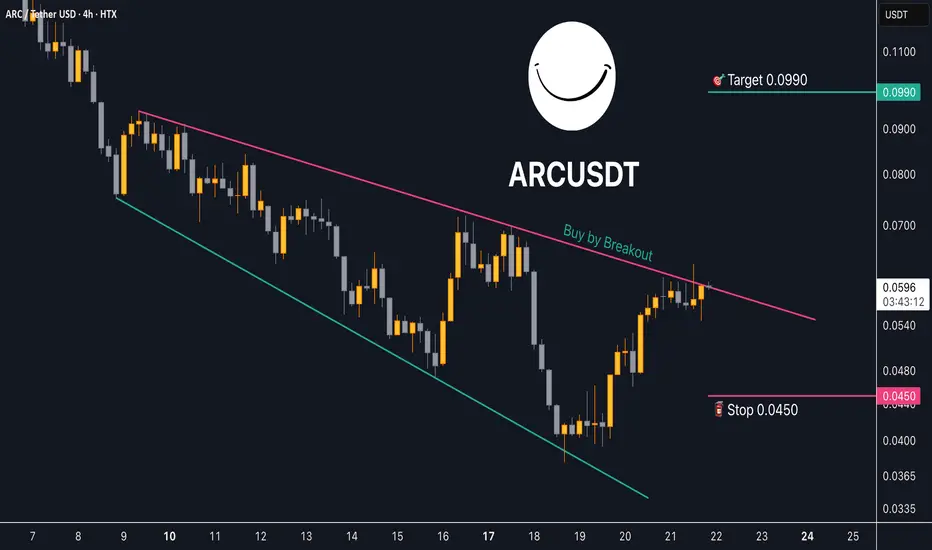
Trading opportunity for AI Rig Complex ARCUSDTBased on technical factors there is a Buy position in :
📊 ARCUSDT
🔵 Buy Now
🪫Stop loss 0.0450
🔋Target 0.0990
📏 R/R 2,7
💸RISK : 1%
We hope it is profitable for you ❤️
Please support our activity with your likes👍 and comments📝
AUDCAD Set To Grow! BUY!
My dear followers,
I analysed this chart on AUDCAD and concluded the following:
The market is trading on 0.9004 pivot level.
Bias - Bullish
Technical Indicators: Both Super Trend & Pivot HL indicate a highly probable Bullish continuation.
Target - 0.9048
Safe Stop Loss - 0.8977
About Used Indicators:
A super-trend indicator is plotted on either above or below the closing price to signal a buy or sell. The indicator changes color, based on whether or not you should be buying. If the super-trend indicator moves below the closing price, the indicator turns green, and it signals an entry point or points to buy.
Disclosure: I am part of Trade Nation's Influencer program and receive a monthly fee for using their TradingView charts in my analysis.
———————————
WISH YOU ALL LUCK

AUDCHF: Long Trade with Entry/SL/TP
AUDCHF
- Classic bullish setup
- Our team expects bullish continuation
SUGGESTED TRADE:
Swing Trade
Long AUDCHF
Entry Point - 0.5536
Stop Loss - 0.5514
Take Profit - 0.5578
Our Risk - 1%
Start protection of your profits from lower levels
Disclosure: I am part of Trade Nation's Influencer program and receive a monthly fee for using their TradingView charts in my analysis.
❤️ Please, support our work with like & comment! ❤️

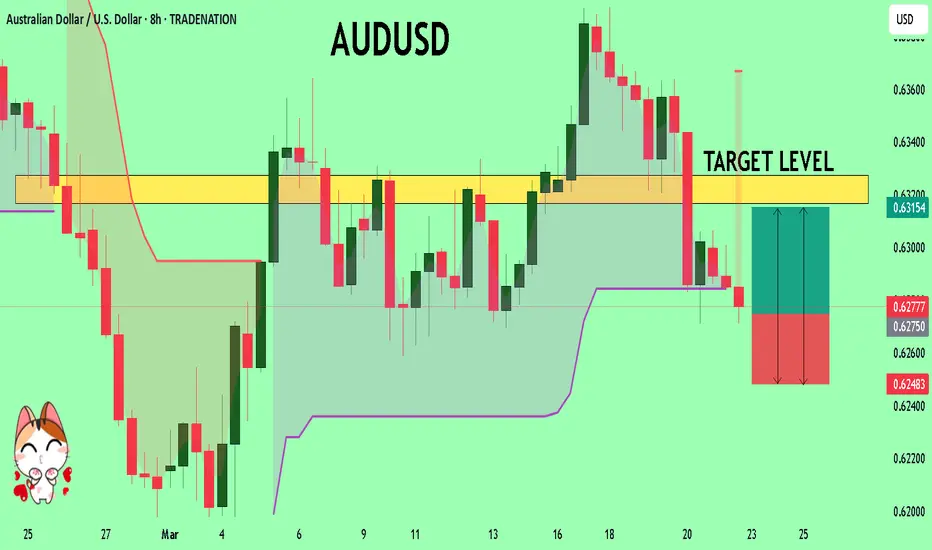
AUDUSD Will Explode! BUY!
My dear friends,
AUDUSD looks like it will make a good move, and here are the details:
The market is trading on 0.6274 pivot level.
Bias - Bullish
Technical Indicators: Supper Trend generates a clear long signal while Pivot Point HL is currently determining the overall Bullish trend of the market.
Goal - 0.6316
Recommended Stop Loss - 0.6248
About Used Indicators:
Pivot points are a great way to identify areas of support and resistance, but they work best when combined with other kinds of technical analysis
Disclosure: I am part of Trade Nation's Influencer program and receive a monthly fee for using their TradingView charts in my analysis.
———————————
WISH YOU ALL LUCK
EURUSD The Target Is UP! BUY!
My dear friends,
EURUSD looks like it will make a good move, and here are the details:
The market is trading on 1.0826 pivot level.
Bias - Bullish
Technical Indicators: Supper Trend generates a clear long signal while Pivot Point HL is currently determining the overall Bullish trend of the market.
Goal - 1.0873
About Used Indicators:
Pivot points are a great way to identify areas of support and resistance, but they work best when combined with other kinds of technical analysis
Disclosure: I am part of Trade Nation's Influencer program and receive a monthly fee for using their TradingView charts in my analysis.
———————————
WISH YOU ALL LUCK

Bearish Alert: Nasdaq’s Downtrend May Deepen Beyond 5%Hey Realistic Traders, Will CAPITALCOM:US100 Bearish Trend Stop? Let’s Dive In....
On the H4 timeframe, Nasdaq continues to follow the bearish trendline and the EMA-200 . Both trend analysis tools clearly signal a bearish trend. The downtrend may persist as a rising wedge pattern has formed, followed by a breakout and a MACD crossover.
Based on these technical signals, I anticipate a potential downward movement toward the first target at 19,077. After reaching this level, a minor pullback is likely before the decline continues toward a new low at 18,544.
This outlook remains valid as long as the price move below the stop-loss level at 20,080
Besides technical factors, U.S. President Donald Trump still intends to implement new reciprocal tariff rates on April 2, adding further uncertainty to the market. This could limit growth potential and contribute to an inflationary environment by increasing the cost of imported goods. Given this uncertainty, we believe the market will continue to decline.
Support the channel by engaging with the content, using the rocket button, and sharing your opinions in the comments below.
Disclaimer: "Please note that this analysis is solely for educational purposes and should not be considered a recommendation to take a long or short position on Nasdaq.

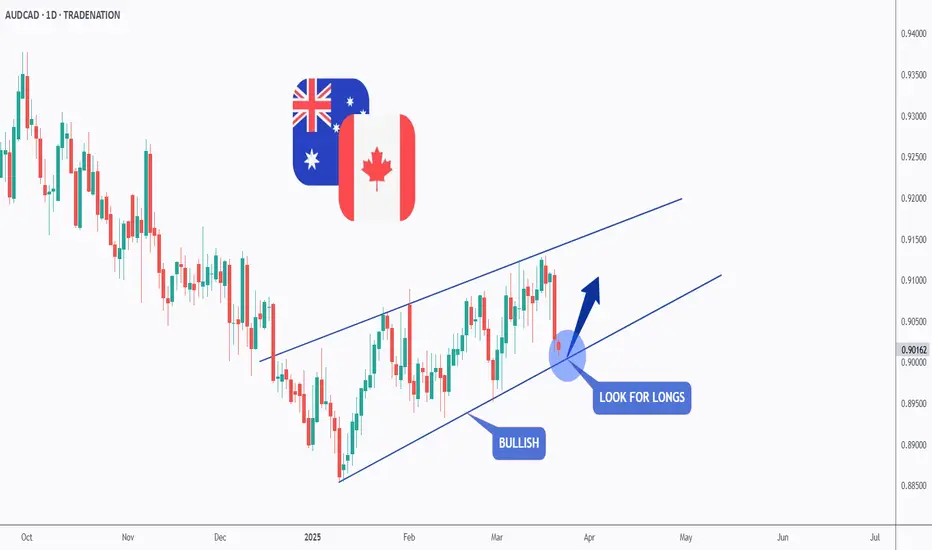
AUDCAD - Bulls Steppin in!Hello TradingView Family / Fellow Traders. This is Richard, also known as theSignalyst.
📈AUDCAD has been overall bullish trading within the rising wedge pattern marked in blue.
Today, AUDCAD is retesting the lower bound of the wedge.
Moreover, it is approaching its previous weekly low.
🏹 Thus, the highlighted blue circle is a strong area to look for buy setups as it is the intersection of weekly low and lower blue trendline acting as a non-horizontal support.
📚 As per my trading style:
As #AUDCAD approaches the blue circle zone, I will be looking for bullish reversal setups (like a double bottom pattern, trendline break , and so on...)
📚 Always follow your trading plan regarding entry, risk management, and trade management.
Good luck!
All Strategies Are Good; If Managed Properly!
~Rich
Disclosure: I am part of Trade Nation's Influencer program and receive a monthly fee for using their TradingView charts in my analysis.
NZDJPY - Shifting Trends Soon!Hello TradingView Family / Fellow Traders. This is Richard, also known as theSignalyst.
📉NZDJPY has been overall bearish , trading within the falling channel marked in red.
However, it is currently retesting the lower bound of the channel which lines up perfectly with the support zone marked in blue.
📈As per my trading style , as long as the support zone holds, I will be looking for buy setups on lower timeframes.
📚 Always follow your trading plan regarding entry, risk management, and trade management.
Good luck!
All Strategies Are Good; If Managed Properly!
~Rich
Disclosure: I am part of Trade Nation's Influencer program and receive a monthly fee for using their TradingView charts in my analysis.

Trading opportunity for ARCUSDTBased on technical factors there is a Buy position in :
📊 ARCUSDT
🔵 Buy Now
🪫Stop loss 0.0310
🔋Target 0.0600
📏 R/R 1,8
💸RISK : 1%
We hope it is profitable for you ❤️
Please support our activity with your likes👍 and comments📝

CADCHF BUYDue to the strong price action structure and various types of divergences, I have a bullish outlook. However, we should also be mindful of hidden divergence, which could indicate a potential correction.
#CADCHF #ForexAnalysis #PriceAction #Divergence #ForexTrading

Trading opportunity for PENDLEUSDTBased on technical factors there is a Buy position in :
📊 PENDLEUSDT
🔵 Buy Now
🪫Stop loss 1.800
🔋Target 2.550
📏 R/R 2
💸RISK : 1%
We hope it is profitable for you ❤️
Please support our activity with your likes👍 and comments📝

Trading opportunity for AXLUSDT AxelarBased on technical factors there is a Buy position in :
📊 AXLUSDT
🔵 Buy Now or by Breakout
🪫Stop loss 0.3600
🔋Target 0.4950
📏 R/R 2,5
💸RISK : 1%
We hope it is profitable for you ❤️
Please support our activity with your likes👍 and comments📝

AUDCAD: Long Signal Explained
AUDCAD
- Classic bullish formation
- Our team expects pullback
SUGGESTED TRADE:
Swing Trade
Long AUDCAD
Entry - 0.9024
Sl - 0.8994
Tp - 0.9076
Our Risk - 1%
Start protection of your profits from lower levels
Disclosure: I am part of Trade Nation's Influencer program and receive a monthly fee for using their TradingView charts in my analysis.
❤️ Please, support our work with like & comment! ❤️

GBPAUD: Bearish Continuation & Short Signal
GBPAUD
- Classic bearish setup
- Our team expects bearish continuation
SUGGESTED TRADE:
Swing Trade
Short GBPAUD
Entry Point - 2.0619
Stop Loss - 2.0692
Take Profit - 2.0483
Our Risk - 1%
Start protection of your profits from lower levels
Disclosure: I am part of Trade Nation's Influencer program and receive a monthly fee for using their TradingView charts in my analysis.
❤️ Please, support our work with like & comment! ❤️

ETH - AltSeason confirmed?Hello TradingView Family / Fellow Traders. This is Richard, also known as theSignalyst.
🔹 As per my last ETH analysis (attached to the chart), we expected that if $2,000 was broken to the upside, altseason would begin! 🚀
Now, ETH has been trading within the rising channel (marked in orange).
📈 As long as the lower orange trendline holds, the bulls remain in control, creating room for altcoins to surge!
💭 Do you think Altseason is confirmed, or is this just a bull trap? 🤔
📚 Always follow your trading plan regarding entry, risk management, and trade management.
Good luck!
All Strategies Are Good; If Managed Properly!
~Rich

AUDNZD Sellers In Panic! BUY!
My dear friends,
AUDNZD looks like it will make a good move, and here are the details:
The market is trading on 1.0957 pivot level.
Bias - Bullish
Technical Indicators: Supper Trend generates a clear long signal while Pivot Point HL is currently determining the overall Bullish trend of the market.
Goal - 1.1005
Recommended Stop Loss - 1.0933
About Used Indicators:
Pivot points are a great way to identify areas of support and resistance, but they work best when combined with other kinds of technical analysis
———————————
WISH YOU ALL LUCK

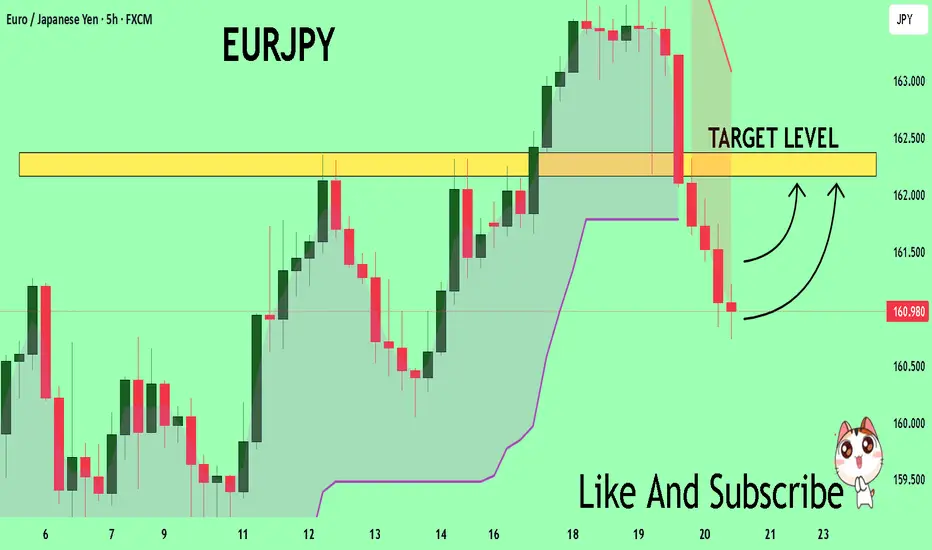
EURJPY Massive Long! BUY!
My dear friends,
Please, find my technical outlook for EURJPY below:
The price is coiling around a solid key level - 161.01
Bias - Bullish
Technical Indicators: Pivot Points Low anticipates a potential price reversal.
Super trend shows a clear buy, giving a perfect indicators' convergence.
Goal - 162.16
About Used Indicators:
The pivot point itself is simply the average of the high, low and closing prices from the previous trading day.
———————————
WISH YOU ALL LUCK
GOLD Expected Growth! BUY!
My dear subscribers,
This is my opinion on the GOLD next move:
The instrument tests an important psychological level 3031.1
Bias - Bullish
Technical Indicators: Supper Trend gives a precise Bullish signal, while Pivot Point HL predicts price changes and potential reversals in the market.
Target - 3042.3
My Stop Loss - 3025.2
About Used Indicators:
On the subsequent day, trading above the pivot point is thought to indicate ongoing bullish sentiment, while trading below the pivot point indicates bearish sentiment.
———————————
WISH YOU ALL LUCK

AUDCAD On The Rise! BUY!
My dear subscribers,
AUDCAD looks like it will make a good move, and here are the details:
The market is trading on 0.9063 pivot level.
Bias - Bullish
Technical Indicators: Both Super Trend & Pivot HL indicate a highly probable Bullish continuation.
Target - 0.9088
About Used Indicators:
The average true range (ATR) plays an important role in 'Supertrend' as the indicator uses ATR to calculate its value. The ATR indicator signals the degree of price volatility.
———————————
WISH YOU ALL LUCK
