NATGAS Set To Fall! SELL!
My dear friends,
NATGAS looks like it will make a good move, and here are the details:
The market is trading on 2.964 pivot level.
Bias - Bearish
Technical Indicators: Supper Trend generates a clear short signal while Pivot Point HL is currently determining the overall Bearish trend of the market.
Goal - 2.929
About Used Indicators:
Pivot points are a great way to identify areas of support and resistance, but they work best when combined with other kinds of technical analysis
Disclosure: I am part of Trade Nation's Influencer program and receive a monthly fee for using their TradingView charts in my analysis.
———————————
WISH YOU ALL LUCK
Signal

NVDIA Death Cross Quant Perspectives (Light Case Study)NASDAQ: Nvidia (NVDA ) has recently experienced an uptrend after a death cross formed consisting of the 65 and 200 EMAs on the 1 Day chart.
If we analyze back on Nvidia starting in 1999 , we can count a total of 10 death crosses that have occurred, and 9 have been immediately followed by downtrends. Although a single death cross did not have an immediate downtrend, shortly after this event (approx. 282 days) another death cross formed and price then fell roughly twice as it historically has , almost appearing to make up for the missed signal.
From a quantitative perspective:
If we calculate the raw historical success rate using:
Raw Success Rate = 9/10 = 90
With this calculation the observed success of 65/200 EMA death crosses correlating to an immediate downtrend is 90%
In order to avoid overconfidence we can apply Laplace smoothing using:
Smoothed Probability = 9+1/10+2 = 10/12 or 0.8333
With this calculation the observed success of 65/200 EMA death crosses correlating to an immediate downtrend is 83%
Given the results of the data I personally feel that there is a Very High (83%) chance this death cross that recently formed on the 1 Day chart (around 04/16/2025) will immediately lead to a downtrend. And a Low (17%) chance it does not. Furthermore these results support a technical analysis hypothesis that I formed prior.
Many different systemic factors can contribute to the market movement, but mathematics sometimes leave subtle clues. Will the market become bearish? Or will Nvidia gain renewed bullish interest?
Disclaimer: Not Financial Advice.

BTCUSD: Trading Signal From Our Team
BTCUSD
- Classic bearish pattern
- Our team expects retracement
SUGGESTED TRADE:
Swing Trade
Sell BTCUSD
Entry - 95407
Stop - 99310
Take - 88838
Our Risk - 1%
Start protection of your profits from lower levels
Disclosure: I am part of Trade Nation's Influencer program and receive a monthly fee for using their TradingView charts in my analysis.
❤️ Please, support our work with like & comment! ❤️

CADJPY: Bearish Continuation & Short Trade
CADJPY
- Classic bearish setup
- Our team expects bearish continuation
SUGGESTED TRADE:
Swing Trade
Short CADJPY
Entry Point - 103.70
Stop Loss - 104.30
Take Profit - 102.64
Our Risk - 1%
Start protection of your profits from lower levels
Disclosure: I am part of Trade Nation's Influencer program and receive a monthly fee for using their TradingView charts in my analysis.
❤️ Please, support our work with like & comment! ❤️

EURJPY Massive Long! BUY!
My dear friends,
EURJPY looks like it will make a good move, and here are the details:
The market is trading on 161.30 pivot level.
Bias - Bullish
Technical Indicators: Supper Trend generates a clear long signal while Pivot Point HL is currently determining the overall Bullish trend of the market.
Goal - 161.68
About Used Indicators:
Pivot points are a great way to identify areas of support and resistance, but they work best when combined with other kinds of technical analysis
Disclosure: I am part of Trade Nation's Influencer program and receive a monthly fee for using their TradingView charts in my analysis.
———————————
WISH YOU ALL LUCK

CADJPY Technical Analysis! SELL!
My dear subscribers,
CADJPY looks like it will make a good move, and here are the details:
The market is trading on 103.88 pivot level.
Bias - Bearish
Technical Indicators: Both Super Trend & Pivot HL indicate a highly probable Bearish continuation.
Target - 103.40
About Used Indicators:
The average true range (ATR) plays an important role in 'Supertrend' as the indicator uses ATR to calculate its value. The ATR indicator signals the degree of price volatility.
Disclosure: I am part of Trade Nation's Influencer program and receive a monthly fee for using their TradingView charts in my analysis.
———————————
WISH YOU ALL LUCK

GBPCHF The Target Is DOWN! SELL!
My dear followers,
This is my opinion on the GBPCHF next move:
The asset is approaching an important pivot point 1.1017
Bias - Bearish
Safe Stop Loss - 1.1089
Technical Indicators: Supper Trend generates a clear short signal while Pivot Point HL is currently determining the overall Bearish trend of the market.
Goal - 1.0879
About Used Indicators:
For more efficient signals, super-trend is used in combination with other indicators like Pivot Points.
Disclosure: I am part of Trade Nation's Influencer program and receive a monthly fee for using their TradingView charts in my analysis.
———————————
WISH YOU ALL LUCK

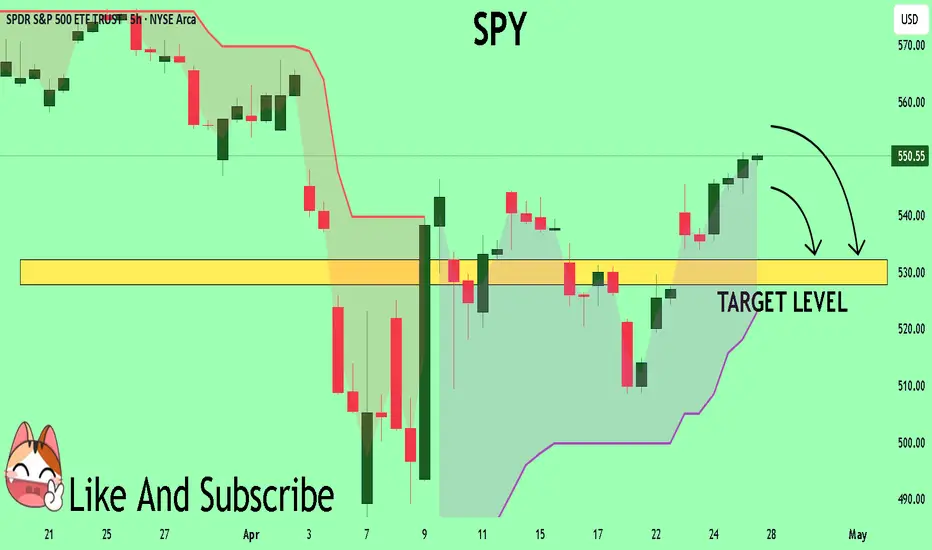
SPY Buyers In Panic! SELL!
My dear subscribers,
This is my opinion on the SPY next move:
The instrument tests an important psychological level 550.55
Bias - Bearish
Technical Indicators: Supper Trend gives a precise Bearish signal, while Pivot Point HL predicts price changes and potential reversals in the market.
Target - 532.22
About Used Indicators:
On the subsequent day, trading above the pivot point is thought to indicate ongoing bullish sentiment, while trading below the pivot point indicates bearish sentiment.
Disclosure: I am part of Trade Nation's Influencer program and receive a monthly fee for using their TradingView charts in my analysis.
———————————
WISH YOU ALL LUCK
SILVER My Opinion! BUY!
My dear friends,
Please, find my technical outlook for NATGAS below:
The price is coiling around a solid key level - 33.100
Bias - Bullish
Technical Indicators: Pivot Points Low anticipates a potential price reversal.
Super trend shows a clear buy, giving a perfect indicators' convergence.
Goal - 33.330
About Used Indicators:
The pivot point itself is simply the average of the high, low and closing prices from the previous trading day.
Disclosure: I am part of Trade Nation's Influencer program and receive a monthly fee for using their TradingView charts in my analysis.
———————————
WISH YOU ALL LUCK

GoldGold daily analysis
Time frame hourly
Risk rewards ratio >2
Analysis after explosion in Bandar Abas IRAN

Cosmos (Atom)Atom usdt Daily analysis
Time frame daily
We have 2 models of analysis
1. The green line. Price can't break the resistance line and fall down to 3.5$
2. Price can break the resistance (gray line) and pump to 9$
Therfore we must watch the reaction of price and resistance

EURUSD Buyers In Panic! SELL!
My dear friends,
Please, find my technical outlook for EURUSD below:
The price is coiling around a solid key level - 1.1506
Bias - Bearish
Technical Indicators: Pivot Points High anticipates a potential price reversal.
Super trend shows a clear sell, giving a perfect indicators' convergence.
Goal - 1.1409
About Used Indicators:
The pivot point itself is simply the average of the high, low and closing prices from the previous trading day.
———————————
WISH YOU ALL LUCK

GOLD My Opinion! SELL!
My dear friends,
GOLD looks like it will make a good move, and here are the details:
The market is trading on 3339.9 pivot level.
Bias - Bearish
Technical Indicators: Supper Trend generates a clear short signal while Pivot Point HL is currently determining the overall Bearish trend of the market.
Goal - 3323.8
Recommended Stop Loss - 3347.3
About Used Indicators:
Pivot points are a great way to identify areas of support and resistance, but they work best when combined with other kinds of technical analysis
Disclosure: I am part of Trade Nation's Influencer program and receive a monthly fee for using their TradingView charts in my analysis.
———————————
WISH YOU ALL LUCK

NZDCAD Trading Opportunity! SELL!
My dear followers,
This is my opinion on the NZDCAD next move:
The asset is approaching an important pivot point 0.8279
Bias - Bearish
Technical Indicators: Supper Trend generates a clear short signal while Pivot Point HL is currently determining the overall Bearish trend of the market.
Goal - 0.8264
About Used Indicators:
For more efficient signals, super-trend is used in combination with other indicators like Pivot Points.
Disclosure: I am part of Trade Nation's Influencer program and receive a monthly fee for using their TradingView charts in my analysis.
———————————
WISH YOU ALL LUCK

EURCHF: Short Signal with Entry/SL/TP
EURCHF
- Classic bearish setup
- Our team expects bearish continuation
SUGGESTED TRADE:
Swing Trade
Short EURCHF
Entry Point - 0.9431
Stop Loss - 0.9478
Take Profit - 0.9332
Our Risk - 1%
Start protection of your profits from lower levels
Disclosure: I am part of Trade Nation's Influencer program and receive a monthly fee for using their TradingView charts in my analysis.
❤️ Please, support our work with like & comment! ❤️

GOLD: Long Trading Opportunity
GOLD
- Classic bullish formation
- Our team expects pullback
SUGGESTED TRADE:
Swing Trade
Long GOLD
Entry - 3271.6
Sl - 3260.0
Tp - 3293.6
Our Risk - 1%
Start protection of your profits from lower levels
Disclosure: I am part of Trade Nation's Influencer program and receive a monthly fee for using their TradingView charts in my analysis.
❤️ Please, support our work with like & comment! ❤️

EURJPY Under Pressure! SELL!
My dear subscribers,
My technical analysis for EURJPY is below:
The price is coiling around a solid key level - 163.61
Bias - Bearish
Technical Indicators: Pivot Points Low anticipates a potential price reversal.
Super trend shows a clear sell, giving a perfect indicators' convergence.
Goal - 162.39
My Stop Loss - 164.06
About Used Indicators:
By the very nature of the supertrend indicator, it offers firm support and resistance levels for traders to enter and exit trades. Additionally, it also provides signals for setting stop losses
Disclosure: I am part of Trade Nation's Influencer program and receive a monthly fee for using their TradingView charts in my analysis.
———————————
WISH YOU ALL LUCK

EURUSD Set To Grow! BUY!
My dear friends,
My technical analysis for EURUSD is below:
The market is trading on 1.1361 pivot level.
Bias - Bullish
Technical Indicators: Both Super Trend & Pivot HL indicate a highly probable Bullish continuation.
Target - 1.1407
About Used Indicators:
A pivot point is a technical analysis indicator, or calculations, used to determine the overall trend of the market over different time frames.
Disclosure: I am part of Trade Nation's Influencer program and receive a monthly fee for using their TradingView charts in my analysis.
———————————
WISH YOU ALL LUCK

USDJPY - Already Over-Sold!Hello TradingView Family / Fellow Traders. This is Richard, also known as theSignalyst.
📈USDJPY has been overall bearish trading within the falling wedge pattern marked in blue and it is currently hovering around the lower bound of it.
Moreover, the orange zone is a strong weekly support.
🏹 Thus, the highlighted blue circle is a strong area to look for buy setups as it is the intersection of support and lower blue trendline acting as a non-horizontal support.
📚 As per my trading style:
As #USDJPY approaches the blue circle zone, I will be looking for bullish reversal setups (like a double bottom pattern, trendline break , and so on...)
📚 Always follow your trading plan regarding entry, risk management, and trade management.
Good luck!
All Strategies Are Good; If Managed Properly!
~Rich
Disclosure: I am part of Trade Nation's Influencer program and receive a monthly fee for using their TradingView charts in my analysis.

GBP Rebounds on Retail Sales – But USD Still in Control📌 GBP Bounces on Strong Retail Sales, But USD Strength Keeps Pressure On 💷📉
The British Pound (GBP) rebounded on Friday after UK Retail Sales data surprised to the upside. According to the Office for National Statistics (ONS), retail sales rose by 0.4% in March, beating expectations of a -0.4% decline. On a yearly basis, growth accelerated to 2.6%, outpacing the forecast of 1.8%.
However, despite the positive data, traders remain confident the Bank of England (BoE) may still cut interest rates by 25 bps to 4.25% in the May meeting, due to persistent global uncertainties and softer inflation expectations.
Meanwhile, the US Dollar (USD) gained ground across the board as trade tensions between the US and China appeared to ease. Durable Goods Orders in the US jumped by 9.2% in March — a clear sign of business confidence and policy impact.
📊 Technical Outlook – GBP/USD
GBP/USD briefly recovered from an intraday low of 1.3280 but remains under pressure near key resistance.
On the upside, the psychological barrier at 1.3500 remains a major hurdle.
To the downside, the April 3rd high around 1.3200 now acts as strong support.
💼 Trading Plan
🟢 BUY ZONE:
Entry: 1.32500
SL: 1.32000
TP: 1.33300
🔴 SELL ZONE:
Entry: 1.34180
SL: 1.34700
TP: 1.33500
📌 Stay alert ahead of key BoE guidance and further US-China headlines — volatility may increase as we head into May.

ONE/USDT - Harmoney - 4th Uptrend is just startingBINANCE:ONEUSDT (1W CHART) Technical Analysis Update
ONE is currently trading at $0.01121 and showing overall bullish sentiment
if we look at the past chart, we see ranging market for ONE from past 2 years, the price has hit the accumulation zone and reversing from the zone.
In the past 3 times we saw significant increase in price after hitting the support zone, and we expecting similar move this time.
Entry level: $ 0.01121
Stop Loss Level: $ 0.00765
TakeProfit 1: $ 0.01368
TakeProfit 2: $ 0.01855
TakeProfit 3: $ 0.02727
TakeProfit 4: $ 0.03795
TakeProfit 5: $ 0.05691
Max Leverage: 2x
Position Size: 1% of capital
Remember to set your stop loss.
Follow our TradingView account for more technical analysis updates. | Like, share, and comment your thoughts.
Cheers
GreenCrypto

DexeDexe usdt Daily analysis
Risk rewards ratio >5 👈👌
Time frame daily
First target =16$
2th target = 19.5 $
Stop is very tight. Below of support line.
If price break the support line and my stop , I don't lose because it's very tight. On the other hand, if price reach to my target , I get good benefit

Xrp (Ripple)Ripple
Xrp usdt Daily analysis
Time frame daily
Risk rewards ratio >3.2 👈👌
Target 3.2$
Ripple technical analysis ✅️
My last short position reached the target.
Head and shoulders pattern completed.
Now it is a good time to start
My critical area is red box that you see on the chart. It is very important area .
If Ripple can reach and break this resistance, we will have a good pump
But now 3 _3.2$ is a good target
