NZDJPY: Short Signal Explained
NZDJPY
- Classic bearish formation
- Our team expects fall
SUGGESTED TRADE:
Swing Trade
Sell NZDJPY
Entry Level - 85.165
Sl - 85.986
Tp - 83.647
Our Risk - 1%
Start protection of your profits from lower levels
Disclosure: I am part of Trade Nation's Influencer program and receive a monthly fee for using their TradingView charts in my analysis.
❤️ Please, support our work with like & comment! ❤️
Signal

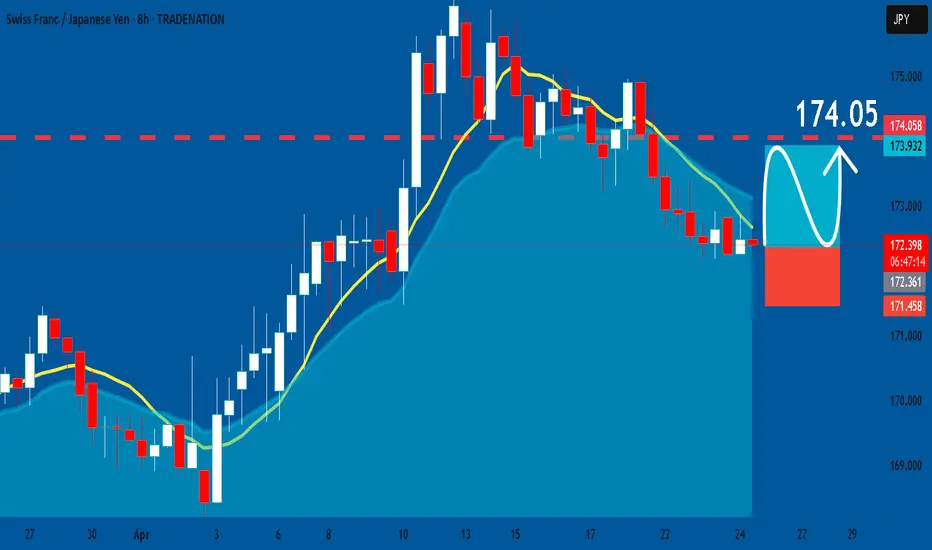
CHFJPY: Long Trade with Entry/SL/TP
CHFJPY
- Classic bullish pattern
- Our team expects retracement
SUGGESTED TRADE:
Swing Trade
Buy CHFJPY
Entry - 172.36
Stop - 171.45
Take - 174.05
Our Risk - 1%
Start protection of your profits from lower levels
Disclosure: I am part of Trade Nation's Influencer program and receive a monthly fee for using their TradingView charts in my analysis.
❤️ Please, support our work with like & comment! ❤️
AUDCHF What Next? SELL!
My dear subscribers,
AUDCHF looks like it will make a good move, and here are the details:
The market is trading on 0.5271 pivot level.
Bias - Bearish
Technical Indicators: Both Super Trend & Pivot HL indicate a highly probable Bearish continuation.
Target - 0.5227
About Used Indicators:
The average true range (ATR) plays an important role in 'Supertrend' as the indicator uses ATR to calculate its value. The ATR indicator signals the degree of price volatility.
Disclosure: I am part of Trade Nation's Influencer program and receive a monthly fee for using their TradingView charts in my analysis.
———————————
WISH YOU ALL LUCK

XAUUSD (Gold) - ICT AnalysisI'm currently looking for higher levels on Gold,
after we reversed from a Daily IRL zone and printed a clear 1H structure shift.
Price just rejected from a 4H IRL, and my first target is the 4H ERL,
which is already marked on the chart.
Watching price action closely for continuation confirmation.

GBPCAD The Target Is DOWN! SELL!
My dear followers,
This is my opinion on the GBPCAD next move:
The asset is approaching an important pivot point 1.8481
Bias - Bearish
Safe Stop Loss - 1.8552
Technical Indicators: Supper Trend generates a clear short signal while Pivot Point HL is currently determining the overall Bearish trend of the market.
Goal - 1.8357
About Used Indicators:
For more efficient signals, super-trend is used in combination with other indicators like Pivot Points.
———————————
WISH YOU ALL LUCK

NZDUSD Will Collapse! SELL!
My dear friends,
My technical analysis for NZDUSD is below:
The market is trading on 0.5997 pivot level.
Bias - Bearish
Technical Indicators: Both Super Trend & Pivot HL indicate a highly probable Bearish continuation.
Target -0.5855
Recommended Stop Loss - 0.6073
About Used Indicators:
A pivot point is a technical analysis indicator, or calculations, used to determine the overall trend of the market over different time frames.
Disclosure: I am part of Trade Nation's Influencer program and receive a monthly fee for using their TradingView charts in my analysis.
———————————
WISH YOU ALL LUCK

GBPAUD Will Explode! BUY!
My dear friends,
Please, find my technical outlook for GBPAUD below:
The instrument tests an important psychological level 2.0776
Bias - Bullish
Technical Indicators: Supper Trend gives a precise Bullish signal, while Pivot Point HL predicts price changes and potential reversals in the market.
Target - 2.0844
About Used Indicators:
Super-trend indicator is more useful in trending markets where there are clear uptrends and downtrends in price.
Disclosure: I am part of Trade Nation's Influencer program and receive a monthly fee for using their TradingView charts in my analysis.
———————————
WISH YOU ALL LUCK

BnbBnb usdt Daily analysis
Time frame daily
Risk rewards ratio >2.3
Target 843$
Bnb move up and down between two Grey line that you can see on the chart
3 times it dropped but couldn't break the support line and now it is a good time to reach the target ( upper side of grey tunnel )

ETH - Those levels played out perfectly. I had given ETH TA days ago and updated it again and again.
Now: Look how those level played out nicely.
after a weekend and Easter days full of volatility
void level and last low was rejected very clearly and bullish Divergence in CVD.
Price came up above our 4h key level and went above last highs upper blue TL.
Here was a clear Entry for Long: Above blue TL, AVWAP and OBV structure was broken clearly.
to the POC : 5.5 % 🎯 👌
Look at previous ETH TA and more important at that TA about Alts 2 days ago:
Alts TA:
ETH TA:
Follow for more ideas/Signals.💲
Just donate some of your profit to Animal rights or other charity :)✌️

Beautiful TA played out. That was initiation for many Alt LONGsLook at this TA from 2 days ago, then you will understand my Alt LONGs.
Despite BTC D. made higher highs, but Alts moved up too.
7.5 % till now🎯 👌 😎
In Update, I will paste the Alts LONGs ;).
Original TA from 2 days ago:
Follow for more ideas/Signals.💲
Just donate some of your profit to Animal rights or other charity :)✌️

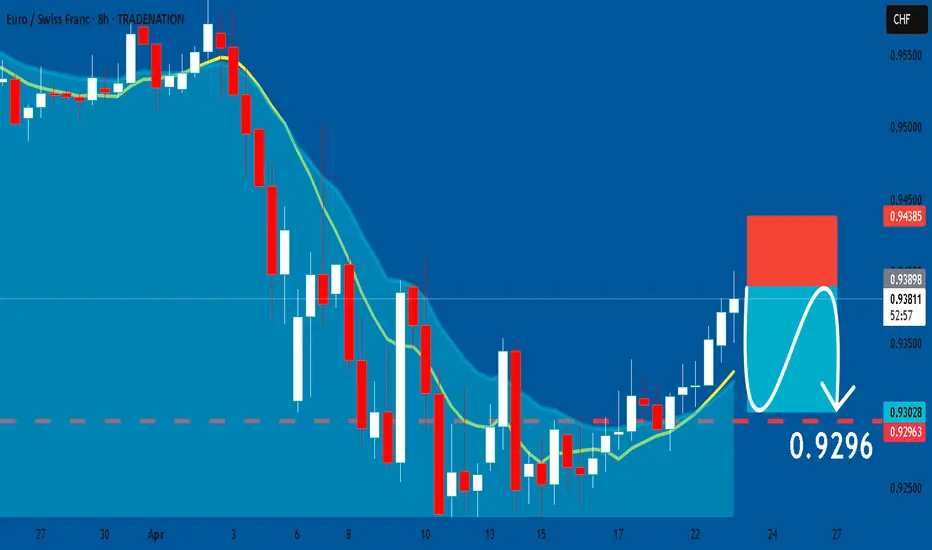
EURCHF: Short Trade with Entry/SL/TP
EURCHF
- Classic bearish formation
- Our team expects pullback
SUGGESTED TRADE:
Swing Trade
Short EURCHF
Entry - 0.9389
Sl - 0.9438
Tp - 0.9296
Our Risk - 1%
Start protection of your profits from lower levels
Disclosure: I am part of Trade Nation's Influencer program and receive a monthly fee for using their TradingView charts in my analysis.
❤️ Please, support our work with like & comment! ❤️
EURNZD What Next? BUY!
My dear subscribers,
This is my opinion on the EURNZD next move:
The instrument tests an important psychological level 1.9047
Bias - Bullish
Technical Indicators: Supper Trend gives a precise Bullish signal, while Pivot Point HL predicts price changes and potential reversals in the market.
Target - 1.9308
My Stop Loss - 1.8907
About Used Indicators:
On the subsequent day, trading above the pivot point is thought to indicate ongoing bullish sentiment, while trading below the pivot point indicates bearish sentiment.
Disclosure: I am part of Trade Nation's Influencer program and receive a monthly fee for using their TradingView charts in my analysis.
———————————
WISH YOU ALL LUCK

GBPCHF Set To Fall! SELL!
My dear friends,
Please, find my technical outlook for GBPCHF below:
The price is coiling around a solid key level - 1.0950
Bias - Bearish
Technical Indicators: Pivot Points Low anticipates a potential price reversal.
Super trend shows a clear sell, giving a perfect indicators' convergence.
Goal - 1.0844
Safe Stop Loss - 1.1013
About Used Indicators:
The pivot point itself is simply the average of the high, low and closing prices from the previous trading day.
Disclosure: I am part of Trade Nation's Influencer program and receive a monthly fee for using their TradingView charts in my analysis.
———————————
WISH YOU ALL LUCK

EURUSD The Target Is UP! BUY!
My dear subscribers,
My technical analysis for EURUSD is below:
The price is coiling around a solid key level - 1.1418
Bias - Bullish
Technical Indicators: Pivot Points High anticipates a potential price reversal.
Super trend shows a clear buy, giving a perfect indicators' convergence.
Goal - 1.1465
About Used Indicators:
By the very nature of the supertrend indicator, it offers firm support and resistance levels for traders to enter and exit trades. Additionally, it also provides signals for setting stop losses
Disclosure: I am part of Trade Nation's Influencer program and receive a monthly fee for using their TradingView charts in my analysis.
———————————
WISH YOU ALL LUCK

$SAGA Long Trade #freesignal
LSE:SAGA Long
Leverage : 3-5x
Entry 1 : 1.415
Entry 2 : 1.32
TP: 1.6177
SL : 1.2288
I want you to use SL and do proper risk management thanks.
like and share with love

BTC - Bullish Control, Confirmed!Hello TradingView Family / Fellow Traders! This is Richard, also known as theSignalyst.
🚀 As per my last two setups (highlighted on the chart), BTC rejected the $72,000 support and pushed higher with strength.
📈 This week, BTC broke above the $90,000 structure, confirming a shift in momentum from bearish to bullish.
🟢 For the bulls to stay in control, a break above the $95,200 resistance is still needed.
📊 In the meantime, as BTC retests the $89,000–$90,000 zone, we’ll be looking for medium-term trend-following longs to catch the next impulsive move.
📚 Reminder:
Always stick to your trading plan — entry, risk management, and trade management are key.
Good luck, and happy trading!
All Strategies Are Good, If Managed Properly!
~Rich

BTC - Two Bullish Scenarios...Hello TradingView Family / Fellow Traders! This is Richard, also known as theSignalyst.
📉 BTC has been overall bearish, trading within the falling channel marked in red.
The $70,000 area is a key confluence zone — it aligns with the lower red trendline, horizontal support, a psychological round number, and a potential demand zone.
📚 According to my trading style:
As #BTC approaches the blue circle zone, I’ll be looking for bullish reversal setups — such as a double bottom pattern, trendline break, and more.
🏹In parallel, for the bulls to take over long-term, and shift the entire trend in their favor, a break above the last major high marked in red at $88,888 is needed!
📚 Reminder:
Always stick to your trading plan — entry, risk management, and trade management are key.
Good luck, and happy trading!
All Strategies Are Good, If Managed Properly!
~Rich

Trading opportunity for KASUSDTBased on technical factors there is a Sell position in :
📊 KASUSDT
🔴 Sell Now
🪫Stop loss 0.11000
🔋Target 0.06767
📏 R/R 2
💸RISK : 1%
We hope it is profitable for you ❤️
Please support our activity with your likes👍 and comments📝

xauusd what is happening?Gold (XAU/USD) Market Overview – April 22, 2025
🧨 Geopolitical & Trade Tensions
Ongoing US-China trade disputes and President Trump’s tariff policies continue to amplify uncertainty.
Market chatter on platforms like X (formerly Twitter) reflects investor anxiety over potential global trade disruptions, increasing gold’s appeal as a safe-haven asset.
💵 US Dollar Dynamics
The US dollar remains weak, partly due to Trump’s continued criticism of Fed Chair Jerome Powell and his calls for rate cuts.
A weaker dollar supports gold by making it more attractive to international investors.
🏦 Institutional & Central Bank Demand
Strong ETF inflows: Over 23 tonnes added in a single session, suggesting large-scale accumulation.
Central banks, particularly China, continue adding gold to reserves—contributing to bullish long-term sentiment.
🧯 Macro Environment
Persistent inflation concerns and dovish central bank policies are reinforcing gold's status as an inflation hedge.
Markets await US retail sales data and Fed Chair Powell’s speech, which could introduce volatility or direction.
📊 Technical Analysis of XAU/USD @ $3,424
📈 Trend & Chart Structure
Gold is trading in a well-defined ascending channel, with a recent breakout above $3,400 confirming bullish structure.
However, the presence of a rising wedge pattern and overbought conditions warns of a potential short-term correction.
🔐 Key Support & Resistance Levels
Type
Level
Notes
Support 1
$3,400
Psychological level & prior breakout point
Support 2
$3,320–$3,325
Fibonacci zone and fair value gap
Support 3
$3,296–$3,284
April 18 low; deeper support
Resistance 1
$3,445
Immediate resistance
Resistance 2
$3,500
All-time high; psychological milestone
Long-term
$3,550–$3,637
Medium-term upside targets
📟 Indicators & Volume Analysis
RSI: >70 on short-term charts → Overbought, suggesting risk of pullback.
MACD: Bullish crossover intact, but declining momentum is a caution flag.
Moving Averages:
Price is well above the 30-EMA ($3,265) and 200-EMA ($3,163) — strongly bullish.
Volume: Recent rally on declining volume = possible divergence, implying weakening buying strength.
📌 Trading Scenarios
✅ Bullish Case
If XAU/USD holds above $3,400 and breaks $3,445, next targets = $3,500 → $3,550 → $3,600.
Entry: Wait for a pullback to $3,400–$3,405 or bullish confirmation (e.g., bullish engulfing candle, rising volume).
Stop Loss: Below $3,390
Rationale: Strong uptrend + safe-haven flows + USD weakness = sustained bullish bias.
🚫 Bearish Case
If price breaks below $3,400 with momentum, correction toward $3,325 or $3,296 is likely.
Entry: Below $3,400 after confirmation (e.g., high-volume bearish candle)
Stop Loss: Above $3,430
Rationale: Overbought RSI + volume divergence → short-term profit-taking or macro catalyst risk.
📈 Volatility Note
Recent daily swings around 2.25% — use tight stop-losses and risk/reward ≥ 1:2.
📅 Key Events to Watch
US Retail Sales Data
Fed Chair Powell’s Speech
US-China trade news
Dollar index (DXY) movement
📅 Medium-Term Outlook (1–3 Months)
Projected move toward $3,600+ remains valid due to:
Global uncertainty
Persistent inflation
Central bank buying
Key swing support: $3,137
Upside resistance: $3,500 → $3,600
⚠️ Risks & Reversals
Risk Factor
Impact on Gold
US-China Trade Deal
↓ Demand (safe-haven outflows)
Strong US Economic Data
↑ Dollar → ↓ Gold
Hawkish Fed Comments
↓ Gold
Continued Overbought Status
Pullback/Cool-off likely
🎯 Conclusion
Gold (XAU/USD) is in a strong long-term uptrend, currently consolidating near $3,424. While bullish fundamentals support a move toward $3,500–$3,600, technical overbought signals and volume divergence suggest caution in the short term.
#xauusd #gold #usd #tariff #tradingview

SUI - HOLD / POTENTIAL LONGAnalyzing SUI/USDT on the 4H chart, I see a clear breakout from a descending wedge — a classic bullish reversal pattern. The price has broken through the resistance line with volume, suggesting early momentum shift.
This zone might be the beginning of a bigger move. I’m personally considering this coin for a mid-term hold, with potential to scale into a long if confirmation continues.

CHFJPY Massive Long! BUY!
My dear subscribers,
My technical analysis for CHFJPY is below:
The price is coiling around a solid key level - 173.75
Bias - Bearish
Technical Indicators: Pivot Points Low anticipates a potential price reversal.
Super trend shows a clear sell, giving a perfect indicators' convergence.
Goal - 174.91
About Used Indicators:
By the very nature of the supertrend indicator, it offers firm support and resistance levels for traders to enter and exit trades. Additionally, it also provides signals for setting stop losses
Disclosure: I am part of Trade Nation's Influencer program and receive a monthly fee for using their TradingView charts in my analysis.
———————————
WISH YOU ALL LUCK

CMCSA Comcast Corporation Options Ahead of EarningsAnalyzing the options chain and the chart patterns of CMCSA Comcast Corporation prior to the earnings report this week,
I would consider purchasing the 37.5usd strike price Calls with
an expiration date of 2025-9-19,
for a premium of approximately $1.35.
If these options prove to be profitable prior to the earnings release, I would sell at least half of them.

EURUSD: Target Is Down! Short!
My dear friends,
Today we will analyse EURUSD together☺️
The market is at an inflection zone and price has now reached an area around 1.14656 where previous reversals or breakouts have occurred.And a price reaction that we are seeing on multiple timeframes here could signal the next move down so we can enter on confirmation, and target the next key level of 1.14432..Stop-loss is recommended beyond the inflection zone.
❤️Sending you lots of Love and Hugs❤️
