GOLD - Smart Money Selling, Retail Chasing Longs📉 Technical Context:
Price has reacted precisely to the 0.618–0.786 Fibonacci retracement zone between 3,386–3,442 USD, aligning with a clear weekly supply zone and imbalance. The current market structure suggests a potential lower high, with the first target around 3,060 USD, and the second near 2,880–2,900 USD demand.
🧠 COT Report (as of April 29, 2025):
Non-Commercials (speculators) cut 18,519 long contracts, signaling waning bullish conviction.
Commercials (hedgers) increased shorts by +9,848 contracts, maintaining a bearish contrarian stance.
📊 Retail Sentiment (MyFxBook):
65% of retail traders are short from 3,062, while 35% are long from 3,184 — ideal environment for a bull trap before reversal.
📅 Seasonality (Market Bulls):
May is historically weak:
10Y: -9.98%
5Y: -12.21%
Strength historically returns in June/July → a correction before continuation is likely.
✅ Conclusion:
Technical structure, macro context, and positioning all align for a high-probability short.
📍 Entry Zone: 3,420–3,440
🔒 Stop: Above ATH (3,500)
🎯 Targets:
TP1: 3,060
TP2: 2,900
Signals

US30: Local Bearish Bias! Short!
My dear friends,
Today we will analyse US30 together☺️
The market is at an inflection zone and price has now reached an area around 41,170 where previous reversals or breakouts have occurred. And a price reaction that we are seeing on multiple timeframes here could signal the next move down so we can enter on confirmation, and target the next key level of 41,039..Stop-loss is recommended beyond the inflection zone.
❤️Sending you lots of Love and Hugs❤️

ETHEREUM: Will Go Up! Long!
My dear friends,
Today we will analyse ETHEREUM together☺️
The price is near a wide key level
and the pair is approaching a significant decision level of 1801$ Therefore, a strong bullish reaction here could determine the next move up.We will watch for a confirmation candle, and then target the next key level of 1810$ Recommend Stop-loss is beyond the current level.
❤️Sending you lots of Love and Hugs❤️

EURAUD Will Go Down From Resistance! Sell!
Take a look at our analysis for EURAUD.
Time Frame: 9h
Current Trend: Bearish
Sentiment: Overbought (based on 7-period RSI)
Forecast: Bearish
The market is testing a major horizontal structure 1.747.
Taking into consideration the structure & trend analysis, I believe that the market will reach 1.713 level soon.
P.S
Overbought describes a period of time where there has been a significant and consistent upward move in price over a period of time without much pullback.
Disclosure: I am part of Trade Nation's Influencer program and receive a monthly fee for using their TradingView charts in my analysis.
Like and subscribe and comment my ideas if you enjoy them!

AUDCAD Will Go Higher! Long!
Please, check our technical outlook for AUDCAD.
Time Frame: 5h
Current Trend: Bullish
Sentiment: Oversold (based on 7-period RSI)
Forecast: Bullish
The market is approaching a key horizontal level 0.894.
Considering the today's price action, probabilities will be high to see a movement to 0.905.
P.S
Please, note that an oversold/overbought condition can last for a long time, and therefore being oversold/overbought doesn't mean a price rally will come soon, or at all.
Disclosure: I am part of Trade Nation's Influencer program and receive a monthly fee for using their TradingView charts in my analysis.
Like and subscribe and comment my ideas if you enjoy them!

AI BTC Prediction Next 24–48 Hours !May 3, 2025, 11:13 pm. BTC/USD. BTC/USD Trading Plan
Timeframe: Next 24–48 Hours
Long Scenario
- Entry: 96,550 (confirmed close above 96,500 with rising volume + RSI > 50).
- SL: 95,700 (below immediate support 95,800).
- TP: 96,800 (below resistance 97,000).
- Trailing Stop: 1.5x ATR (~162 pips) after surpassing 96,800.
- Confirmation: MACD histogram reversal + Bollinger Band breakout above midline.
Short Scenario
- Entry: 95,750 (confirmed close below 95,800 with rising volume + RSI < 40).
- SL: 96,600 (above resistance 96,500).
- TP: 95,200 (above support 95,000).
- Trailing Stop: 1x ATR (~108 pips) after breaking 95,500.
- Confirmation: Supertrend remains bearish + EMA crossover downward.

Ethereum is Nearing The Daily TrendHey Traders, in today's trading session we are monitoring ETH/USDT for a selling opportunity around 2,000 zone, Ethereum is trading a downtrend and currently is in a correction phase in which it is approaching the trend at 2,000 support and resistance area.
Trade safe, Joe.

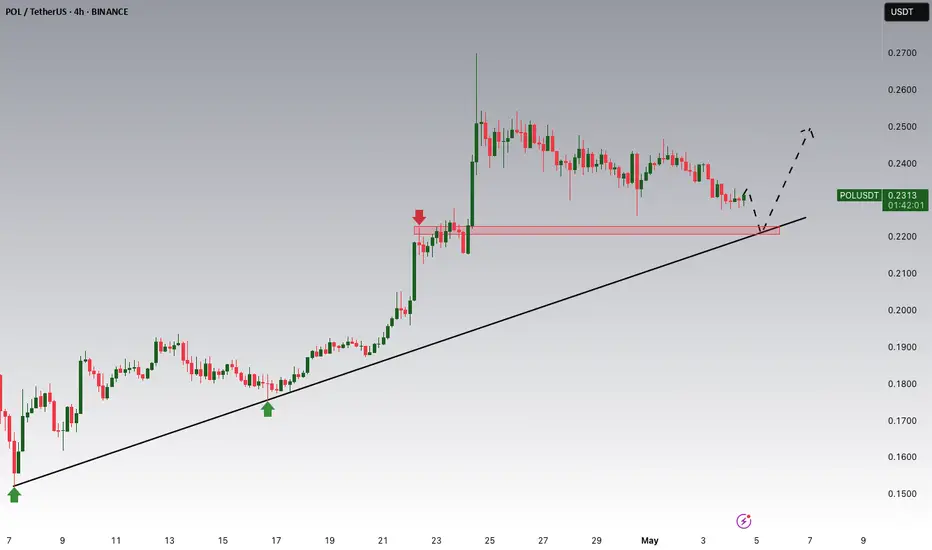
POLUSDT Potential UpsidesHey Traders, in today's trading session we are monitoring POLUSDT for a buying opportunity around 0.2220 zone, POLUSDT is trading in an uptrend and currently is in a correction phase in which it is approaching the trend at 0.2220 support and resistance area.
Trade safe, Joe.
Bitcoin Potential UpsidesHey Traders, in today's trading session we are monitoring Bitcoin for a buying opportunity around 95,000 zone, Bitcoin is trading in an uptrend and currently is in a correction phase in which it is approaching the trend at 95,000 support and resistance area.
Trade safe, Joe.

DXY Will Go Up! Buy!
Here is our detailed technical review for DXY.
Time Frame: 5h
Current Trend: Bullish
Sentiment: Oversold (based on 7-period RSI)
Forecast: Bullish
The market is approaching a significant support area 100.036.
The underlined horizontal cluster clearly indicates a highly probable bullish movement with target 100.899 level.
P.S
The term oversold refers to a condition where an asset has traded lower in price and has the potential for a price bounce.
Overbought refers to market scenarios where the instrument is traded considerably higher than its fair value. Overvaluation is caused by market sentiments when there is positive news.
Disclosure: I am part of Trade Nation's Influencer program and receive a monthly fee for using their TradingView charts in my analysis.
Like and subscribe and comment my ideas if you enjoy them!

USDJPY Will Move Higher! Long!
Take a look at our analysis for USDJPY.
Time Frame: 12h
Current Trend: Bullish
Sentiment: Oversold (based on 7-period RSI)
Forecast: Bullish
The market is on a crucial zone of demand 144.942.
The oversold market condition in a combination with key structure gives us a relatively strong bullish signal with goal 148.284 level.
P.S
We determine oversold/overbought condition with RSI indicator.
When it drops below 30 - the market is considered to be oversold.
When it bounces above 70 - the market is considered to be overbought.
Disclosure: I am part of Trade Nation's Influencer program and receive a monthly fee for using their TradingView charts in my analysis.
Like and subscribe and comment my ideas if you enjoy them!

GBPJPY Signal : 1H / 4H Beautiful buy !!!Hello Traders! 👋
What are your thoughts on GBPJPY ?
GBPJPY
Market price : 192.40
Buy Limit: 191.20 - 191.00
Tp1 : 192.10
Tp2 : 193.10
Tp3 : 194.50
Tp4 : 195.90
Sl : 190.10 ( 100 pip )
Don’t forget to like and share your thoughts in the comments! ❤️
Remember this is a position that was found by me and it is a personal idea not a financial advice, you are responsible for your loss and gain.

Did They Buy the Bottom? EUR/USD Set for Another Reversal!After an explosive bounce from the 1.0800–1.0850 demand zone, EUR/USD is now in a key structural retest around 1.1300. The COT data shows a net increase in long positions by Non-Commercials, but with the Dollar still holding structural strength in its own COT report and an RSI showing bearish divergence, this area may act as a key zone for price discovery.
📊 WHAT THE DATA SAYS:
📉 Price Action: Clear rejection from the 1.1450–1.1550 supply zone. Retest at key structure near 1.1300.
📑 COT (EURO): Net long positions up by +183 (196,388 long vs 120,591 short) = bullish tone.
📑 COT (USD): Still balanced, but Non-Commercials are reducing net longs → potential weakening.
📊 Retail Sentiment (MyFXBook): 70% retail traders are short = contrarian long bias remains.
🌱 Seasonality (May): Historically negative for EUR/USD (–0.0088) = potential downside pressure ahead.
📌 Key Levels:
Resistance: 1.1450 / 1.1550 (Supply Zone)
Support: 1.1300 (Structural retest) — 1.0850 (Strong demand)
📉 BASE SCENARIO: Pullback toward 1.1100–1.1050 before renewed long accumulation.
📈 ALTERNATIVE SCENARIO: Break above 1.1450 could target 1.1600–1.1720 zone.
🔍 Watch out for May's seasonal inversion and extreme speculative positioning — fakeouts may precede real directional moves.
EUR_AUD BEARISH BREAKOUT|SHORT|
✅EUR_AUD was trading along
The rising support but now
It is broken and the breakout
Is confirmed so we are bearish
Biased and we will be expecting
A further bearish move down
On Monday after a potential
Local pullback
SHORT🔥
✅Like and subscribe to never miss a new idea!✅
Disclosure: I am part of Trade Nation's Influencer program and receive a monthly fee for using their TradingView charts in my analysis.

USD-CAD Free Signal! Sell!
Hello,Traders!
USD-CAD is trading in a
Downtrend and the pair is
Consolidating below the
Horizontal resistance
Around 1.3880 so we are
Bearish biased and we can
Enter a short trade on Monday
With the Take Profit of 1.3725
And the Stop Loss of 1.3908
Sell!
Comment and subscribe to help us grow!
Check out other forecasts below too!
Disclosure: I am part of Trade Nation's Influencer program and receive a monthly fee for using their TradingView charts in my analysis.

GBP-USD Local Long! Buy!
Hello,Traders!
GBP-USD is making a local
Correction but the pair will
Soon hit a horizontal support
Level of 1.3204 and as the pair
Is in the uptrend we will be
Expecting a local bullish
Rebound and a move up
Buy!
Comment and subscribe to help us grow!
Check out other forecasts below too!
Disclosure: I am part of Trade Nation's Influencer program and receive a monthly fee for using their TradingView charts in my analysis.

NATGAS SWING SHORT|
✅NATGAS has been growing recently
And Gas seems locally overbought
So as the pair is approaching a
Horizontal resistance of 3.80$
Price decline is to be expected
SHORT🔥
✅Like and subscribe to never miss a new idea!✅
Disclosure: I am part of Trade Nation's Influencer program and receive a monthly fee for using their TradingView charts in my analysis.

NZD_JPY WILL GO UP|LONG|
✅NZD_JPY keeps growing and
The pair made a bullish
Breakout of the falling
Resistance then made a
Local pullback so we are
Bullish biased and we will
Be expecting a further
Bullish continuation
And a move up
LONG🚀
✅Like and subscribe to never miss a new idea!✅
Disclosure: I am part of Trade Nation's Influencer program and receive a monthly fee for using their TradingView charts in my analysis.

AUD-CAD Correction Ahead! Sell!
Hello,Traders!
AUD-CAD keeps going up
But the pair will soon hit
A horizontal resistance level
Around 0.8936 and as the
Pair is locally overbought
We will be expecting a
Pullback and a local
Bearish correction
Sell!
Comment and subscribe to help us grow!
Check out other forecasts below too!
Disclosure: I am part of Trade Nation's Influencer program and receive a monthly fee for using their TradingView charts in my analysis.

BTC - “Bull Market” OR Bearish Retest on HTF? Bitcoins excessive rise for the previous two years brings concern for the mechanics of this market. Moving only up for so long leaves much liquidity in the form of long position stop losses below the current price.
These stop loss orders, or leveraged sell orders, are an explosive chain reaction ready to set off.
Observe these two trendlines and copy them to your charts. These two bearish trendlines (in my view) are why bitcoin has truly been rising so freely.
Moves up in the form of bearish retests are fast and fluid, only after the rejection does price fall aggressively.
I anticipate two scenarios here in the realm of bearish ideas:
Possibility 1 - 30% Probability
96,700 to 34,500
34,500 retrace to 68,500
68,500 to 7,000
Possibility 2 - 70% Probability
96,700 to 43,000
43,000 retrace to 60,000
60,000 to 7,000
Note that both of these possibilities end with 7,000. I’m mapping out two routes that take us there, using confluences with trendlines, volume profiles, liquidity mapping, and common sense.
Be mindful of this possibility. And protect yourself accordingly.

USOIL: Will Go Up! Long!
My dear friends,
Today we will analyse USOIL together☺️
The recent price action suggests a shift in mid-term momentum. A break above the current local range around 58.463 will confirm the new direction upwards with the target being the next key level of 59.265 and a reconvened placement of a stop-loss beyond the range.
❤️Sending you lots of Love and Hugs❤️

NG1!: The Market Is Looking Down! Short!
My dear friends,
Today we will analyse NG1! together☺️
The in-trend continuation seems likely as the current long-term trend appears to be strong, and price is holding below a key level of 3.653 So a bearish continuation seems plausible, targeting the next low. We should enter on confirmation, and place a stop-loss beyond the recent swing level.
❤️Sending you lots of Love and Hugs❤️

NI225: Strong Bearish Sentiment! Short!
My dear friends,
Today we will analyse NI225 together☺️
The market is at an inflection zone and price has now reached an area around 36,830.69 where previous reversals or breakouts have occurred.And a price reaction that we are seeing on multiple timeframes here could signal the next move down so we can enter on confirmation, and target the next key level of 36,249.62..Stop-loss is recommended beyond the inflection zone.
❤️Sending you lots of Love and Hugs❤️
