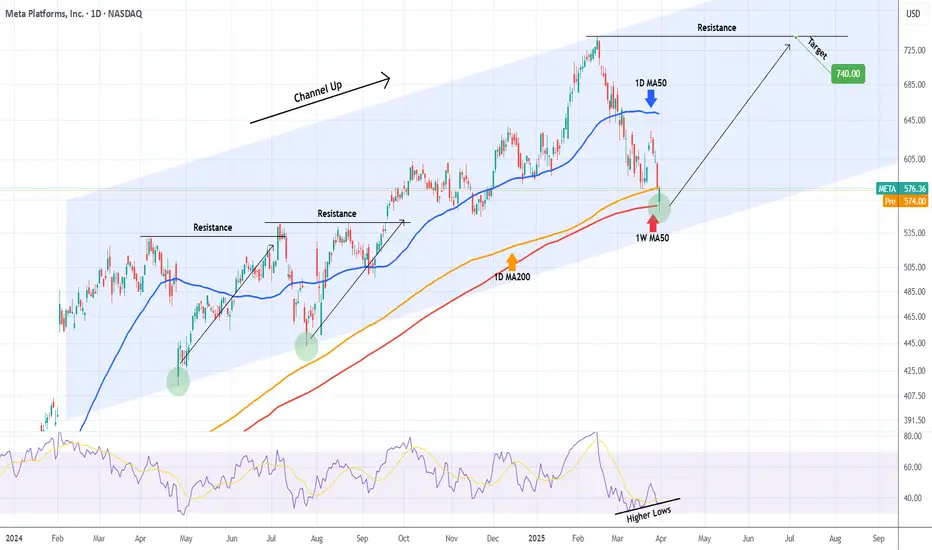
META Can it hold its 1W MA50?Meta Platforms (META) has been trading within a 1-year Channel Up and yesterday it hit its 1W MA50 (red trend-line), breaching the 1D MA200 (orange trend-line) which held the correction last week.
Even though the bottom of the Channel Up is currently $40 lower, holding he 1W MA50 is critical because it has been kept intact since the February 02 2023 bullish break-out.
The first signs are encouraging as the 1D RSI is on Higher Lows, despite the stock's Lower Lows, which is a Bullish Divergence. So as long as this Channel Up bottom Zone holds, we expect META to initiate its new Bullish Leg and test initially its previous Resistance (ATH) as it did on July 05 2024 and August 22 2024. Our Target is $740.
-------------------------------------------------------------------------------
** Please LIKE 👍, FOLLOW ✅, SHARE 🙌 and COMMENT ✍ if you enjoy this idea! Also share your ideas and charts in the comments section below! This is best way to keep it relevant, support us, keep the content here free and allow the idea to reach as many people as possible. **
-------------------------------------------------------------------------------
💸💸💸💸💸💸
👇 👇 👇 👇 👇 👇
Signals
WTI OIL Approaching a potential rejection level.Our last short-term analysis (March 18, see chart below) on WTI Oil (USOIL) hit the $70.00 Target and is currently extending the uptrend:
We believe however that this uptrend may be coming to a temporary end as not only does it approach the 1D MA200 (orange trend-line) that has been intact since February 03, but also the 73.40 Symmetrical Resistance that kick started the -7.70% September 24 2024 rejection.
As you can this this is also where the 1D RSI 67.00 Resistance is, which has also caused 2 rejections.
Based on that, we will wait for a short on the 1D MA200 to target $68.00.
-------------------------------------------------------------------------------
** Please LIKE 👍, FOLLOW ✅, SHARE 🙌 and COMMENT ✍ if you enjoy this idea! Also share your ideas and charts in the comments section below! This is best way to keep it relevant, support us, keep the content here free and allow the idea to reach as many people as possible. **
-------------------------------------------------------------------------------
💸💸💸💸💸💸
👇 👇 👇 👇 👇 👇

EurUsd could continue to the downsideTwo weeks ago, I mentioned that while a new high was possible, the bigger move in EUR/USD should be to the downside.
Indeed, the pair dropped from above 1.0900 and recently found support around the 1.0730 zone.
The recent recovery appears corrective, unfolding in a flag pattern, and I expect another leg down toward 1.0600.
Bearish confirmation comes with a daily close below 1.0750, and my preferred strategy is to sell rallies.
Disclosure: I am part of Trade Nation's Influencer program and receive a monthly fee for using their TradingView charts in my analyses and educational articles.

GBP-AUD Free Signal! Buy!
Hello,Traders!
GBP-AUD is trading in a
Local uptrend and the pair
Made a local correction
Of the horizontal support
Level of 2.0634 so we can
Enter a long trade with the
Take Profit of 2.0724 and
The Stop Loss of 2.0582
Buy!
Comment and subscribe to help us grow!
Check out other forecasts below too!
Disclosure: I am part of Trade Nation's Influencer program and receive a monthly fee for using their TradingView charts in my analysis.

AUD_USD WILL FALL|SHORT|
✅AUD_USD is trading in an
Downtrend and the pair
Made a bearish breakout
Then made a retest and
Is going down now again
So we are bearish biased
And a bearish continuation
Is to be expected
SHORT🔥
✅Like and subscribe to never miss a new idea!✅
Disclosure: I am part of Trade Nation's Influencer program and receive a monthly fee for using their TradingView charts in my analysis.

USD-JPY Bearish Breakout! Sell!
Hello,Traders!
USD-JPY is trading in a
Downtrend and the pair
Broke our of the bearish
Wedge pattern then made
A retest and is going down
Now so we are bearish
Biased and we will be
Expecting a further move down
Sell!
Comment and subscribe to help us grow!
Check out other forecasts below too!
Disclosure: I am part of Trade Nation's Influencer program and receive a monthly fee for using their TradingView charts in my analysis.

USOIL Is Bullish! Long!
Please, check our technical outlook for USOIL.
Time Frame: 8h
Current Trend: Bullish
Sentiment: Oversold (based on 7-period RSI)
Forecast: Bullish
The market is approaching a key horizontal level 71.913.
Considering the today's price action, probabilities will be high to see a movement to 73.911.
P.S
We determine oversold/overbought condition with RSI indicator.
When it drops below 30 - the market is considered to be oversold.
When it bounces above 70 - the market is considered to be overbought.
Disclosure: I am part of Trade Nation's Influencer program and receive a monthly fee for using their TradingView charts in my analysis.
Like and subscribe and comment my ideas if you enjoy them!

EURUSD Is Very Bullish! Buy!
Here is our detailed technical review for EURUSD.
Time Frame: 1D
Current Trend: Bullish
Sentiment: Oversold (based on 7-period RSI)
Forecast: Bullish
The market is approaching a significant support area 1.079.
The underlined horizontal cluster clearly indicates a highly probable bullish movement with target 1.109 level.
P.S
Overbought describes a period of time where there has been a significant and consistent upward move in price over a period of time without much pullback.
Disclosure: I am part of Trade Nation's Influencer program and receive a monthly fee for using their TradingView charts in my analysis.
Like and subscribe and comment my ideas if you enjoy them!

GBPJPY Is Going Down! Short!
Take a look at our analysis for GBPJPY.
Time Frame: 1h
Current Trend: Bearish
Sentiment: Overbought (based on 7-period RSI)
Forecast: Bearish
The market is on a crucial zone of supply 193.030.
The above-mentioned technicals clearly indicate the dominance of sellers on the market. I recommend shorting the instrument, aiming at 192.202 level.
P.S
Please, note that an oversold/overbought condition can last for a long time, and therefore being oversold/overbought doesn't mean a price rally will come soon, or at all.
Disclosure: I am part of Trade Nation's Influencer program and receive a monthly fee for using their TradingView charts in my analysis.
Like and subscribe and comment my ideas if you enjoy them!

NZDCAD Will Fall! Sell!
Please, check our technical outlook for NZDCAD.
Time Frame: 2h
Current Trend: Bearish
Sentiment: Overbought (based on 7-period RSI)
Forecast: Bearish
The price is testing a key resistance 0.816.
Taking into consideration the current market trend & overbought RSI, chances will be high to see a bearish movement to the downside at least to 0.813 level.
P.S
The term oversold refers to a condition where an asset has traded lower in price and has the potential for a price bounce.
Overbought refers to market scenarios where the instrument is traded considerably higher than its fair value. Overvaluation is caused by market sentiments when there is positive news.
Disclosure: I am part of Trade Nation's Influencer program and receive a monthly fee for using their TradingView charts in my analysis.
Like and subscribe and comment my ideas if you enjoy them!

Trading opportunity for GPSUSDTBased on technical factors there is a Buy position in :
📊 GPSUSDT
🔵 Buy Now
🪫Stop loss 0.02200
🔋Target 0.04300
📏 R/R 3,2
💸RISK : 1%
We hope it is profitable for you ❤️
Please support our activity with your likes👍 and comments📝

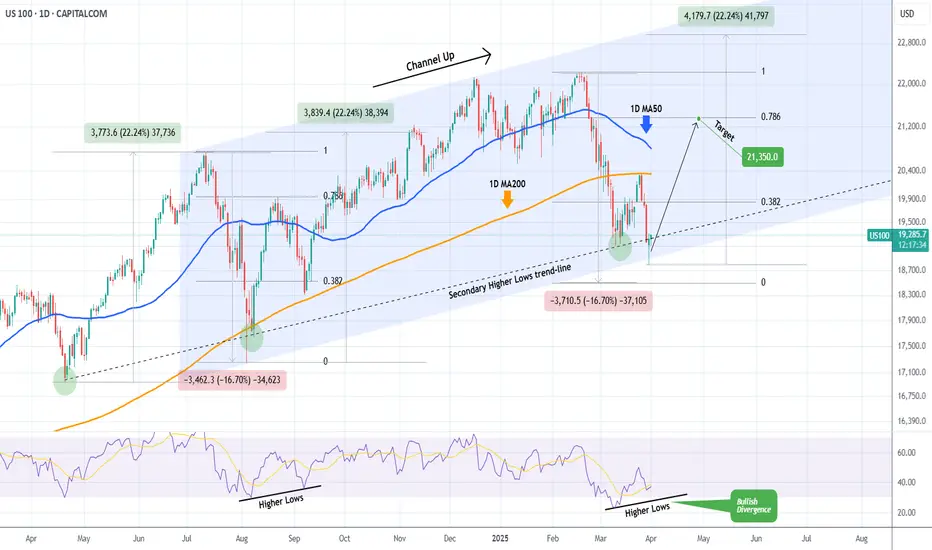
NASDAQ Huge Bullish Divergence points to 21350 inside April.Nasdaq (NDX) has been trading within a Channel Up pattern since the July 11 2024 High. The latest rally that started on March 11 2025 after a brutal 3-week downtrend/ Bearish Leg, got rejected on the 1D MA200 (orange trend-line) as the market digested the disappointing PCE.
Despite this aggressive rejection, the price hit and rebounded yesterday exactly at the bottom of the Channel Up with the previous such contact going back to the August 05 2024 Low. Not to mention that both the March 11 2025 and August 08 2024 Lows were formed exactly on the secondary Higher Lows trend-line.
What's perhaps more critical than any of these though, is that the 1D RSI didn't make a new Low last week and remains above the oversold barrier on a Higher Low trend-line that is a huge technical Bullish Divergence against the price's Lower Lows.
As with the August 22 2024 High, our first short-term Target is on the 0.786 Fibonacci retracement level at 21350.
-------------------------------------------------------------------------------
** Please LIKE 👍, FOLLOW ✅, SHARE 🙌 and COMMENT ✍ if you enjoy this idea! Also share your ideas and charts in the comments section below! This is best way to keep it relevant, support us, keep the content here free and allow the idea to reach as many people as possible. **
-------------------------------------------------------------------------------
💸💸💸💸💸💸
👇 👇 👇 👇 👇 👇
Lingrid | GBPJPY Potential UPWARD CHANNEL Breakout. ShortThe price perfectly fulfilled my last idea . It hit the TP level. The overall
FX:GBPJPY price formed ABC movement, with the C point completed around the 196.000 level then boucned off. Recently, the price broke and closed below the 194.000 level, that has become a resistance zone. The market has since formed a daily inside bar pattern, and a breakout above or below Monday's high and low will likely determine the next move. Currently, the price is testing the lower boundary of a channel that coincides with the support level at 193.000. I think the price may form a range zone at this level before potentially continuing downward and breaking out of the upward channel. My goal is support zone at 192.200
Traders, If you liked this educational post🎓, give it a boost 🚀 and drop a comment 📣

XRPUSD starting the parabolic rally to $6.000Ripple (XRPUSD) has been trading within a 5-year Channel Up since the March 2020 COVID flash crash. That COVID bottom initiated the first Bullish Leg of XRP, which was the previous Cycle's Bull run.
XRP has started the second Bullish Leg after the July 2024 Channel Up bottom and since basically December, the market has been under heavy volatility, entering a consolidation period similar to December - March 2021.
That was XRP's last accumulation phase before the 2021 Cycle Top. The 1W RSI patterns between the two Bullish Leg fractals are also similar, indicating that even though the current Bullish Leg has been more aggressive since November 2024, it is being harmonized now inside the parabolic growth Channel.
We expect a symmetrical +1668% rise in total for this Bullish Leg, similar to 2021, with our Target being marginally lower at $6.000, expecting it within July - October 2025.
-------------------------------------------------------------------------------
** Please LIKE 👍, FOLLOW ✅, SHARE 🙌 and COMMENT ✍ if you enjoy this idea! Also share your ideas and charts in the comments section below! This is best way to keep it relevant, support us, keep the content here free and allow the idea to reach as many people as possible. **
-------------------------------------------------------------------------------
💸💸💸💸💸💸
👇 👇 👇 👇 👇 👇

Lingrid | XRPUSDT daily Head and Shoulders PatternThe price of BINANCE:XRPUSDT is currently making lower lows and lower closes. The market has declined from the resistance zone around 2.50, breaking through previous support levels and making a shift in the market structure. When we zoom out, we can see the formation of a significant head and shoulders pattern on the daily timeframe, which suggests that the price may drop below the 1.50 support level. I think this pattern will play out, pushing towards lower support levels if the price ramains below the resistance and trendline. I expect that XRP will retest the at least support level at 2.00 and further lower levels, unless unexpected news causes a surge in price. My goal is support zone around 1.90
Traders, If you liked this educational post🎓, give it a boost 🚀 and drop a comment 📣

4 consecutive days of increase, GOLD support from TrumpIn the Asian session, spot OANDA:XAUUSD continued to rise, surpassing $3,145/ounce, up more than $24 on the day.
The global trade war has caused concerns in the market, continuing to push gold prices to new highs. Gold prices rose 8% in March and have increased for three consecutive months this year.
Gold prices have increased more than 18% this year, following a 27% increase last year, thanks to a favorable monetary policy environment, strong central bank buying and demand for exchange-traded funds (ETFs).
Trump: Tariff details could be announced soon (Bloomberg)
US President Trump said on Monday local time that details of the tariffs could be announced either Tuesday night (April 1) or April 2.
Trump also said the US would be “very friendly” to other countries and that tariffs could be significantly reduced in some cases. Trump then talked about other issues before returning to the issue of tariffs, adding: “The tariff plan is already in place.”
White House spokeswoman Karoline Leavitt said on Monday that US President Trump will announce a plan for reciprocal tariffs "country by country" in the White House Rose Garden on April 2 and that no tariff exemptions are currently being considered.
In the latest escalation in the trade war, Trump is set to impose broad “reciprocal” tariffs on all U.S. trading partners on Wednesday, a day he has called “Liberation Day.” Trump also plans to impose a 25 percent tariff on all non-U.S.-made cars this week.
Asked about the reciprocal tariffs and which countries would be affected, Leavitt declined to provide details. Asked whether lower tariffs would be applied to products used by U.S. farmers, Leavitt said “there are no exemptions at this time.”
Trump also said on Sunday that he would impose secondary tariffs of 25% to 50% on buyers of Russian oil if he finds Russia intends to obstruct US efforts to end the war in Ukraine.
Technical Outlook Analysis OANDA:XAUUSD
4 days of soaring, gold is heading for its 4th consecutive strong day of gains as it breaks the target at the 0.618% Fibonacci extension of $3,139, followed by the target at the 0.786% Fibonacci extension of $3,177.
With the current technical conditions, there is no resistance or signal for a significant technical correction.
With the medium-term trend being highlighted by the price channel and a blue price channel as the short-term trend. As long as gold remains above the EMA21, it will remain technically bullish in the long-term.
Meanwhile, the Relative Strength Index (RSI) is operating in the overbought zone but is not giving any signal of a possible downside correction.
For the day, the technical outlook for gold prices remains bullish, and any current downside correction should only be considered as a short-term correction or a buying opportunity.
With that, the notable positions for the uptrend will be listed as follows.
Support: 3,128 – 3,113 USD
Resistance: 3,177 USD
SELL XAUUSD PRICE 3157 - 3155⚡️
↠↠ Stoploss 3161
→Take Profit 1 3149
↨
→Take Profit 2 3143
BUY XAUUSD PRICE 3085 - 3087⚡️
↠↠ Stoploss 3081
→Take Profit 1 3093
↨
→Take Profit 2 3099

GBPAUD Trending Higher – Bullish Continuation Toward 2.07770OANDA:GBPAUD is currently trading within an ascending channel, maintaining a bullish structure. The price has broken above a key resistance zone which has now flipped to support, aligning with a potential bullish continuation. The recent retest of this level held successfully, indicating strong buyer interest and reinforcing the bullish outlook.
With momentum favoring the upside, the price could move toward the 2.07770 level, which aligns with the upper boundary of the channel. However, a failure to hold this level could indicate a potential shift in momentum.
Traders should monitor for bullish confirmation signals, such as bullish engulfing candles, strong wicks rejecting the support zone, or increased buying volume, before considering long positions.
Let me know your thoughts or any additional insights you might have! 🚀

DXY Bounces Back: I’m Staying BullishAfter breaking below the 104 support and hitting a low of 103.75, TVC:DXY staged a strong recovery, reclaiming support and signaling a potential false breakout.
The overnight retest of 104 established a higher low, suggesting further upside potential.
As long as 104 holds, I remain bullish and will look to sell EUR/USD and GBP/USD.

Lingrid | GOLD breaks Records REACHING New All-Time HighOANDA:XAUUSD market gapped up and continued to rise, reaching a new all-time high. It has already approached the resistance zone I highlighted in the weekly forecast and is above the 3100 level, which could serve as an entry zone due to the range and upward trendline below. As the monthly candle is set to print today, I believe the price may trade sideways around the current levels. However, if the price makes a correction toward support and rejects it, we should look for a buying signal in the market. My goal is resistance zone around 3150
Traders, If you liked this educational post🎓, give it a boost 🚀 and drop a comment 📣

Gold- Way, way too deviated from the MEAN!!!As I’ve mentioned many times in my analyses, my trading approach focuses on identifying the next big move (500 to 1,000 pips) rather than chasing small gains of 30-50 pips, which often feels more like staying busy than truly making money.
In this post, I’ll explain why I believe the next major move in Gold is downward rather than upward.
I’ll take a slightly different approach than usual, focusing on the bigger picture and using a simple 20-period moving average (MA) to smooth price action.
Looking at the posted chart, since the beginning of the recent bull market—highlighted in the chart at the 1,600 zone back in November 2022—Gold has been in a strong uptrend. A key observation is that the 20-period moving average has been forming higher lows.
After the second higher low in October 2023, the trend became even more aggressive, with only two notable higher lows since (looking on MA)—one in July 2024 and another in January 2025.
However, even during these sharp bullish legs, the market has consistently reversed to the mean—with the mean being the 20-period moving average.
At the time of writing, Gold is trading around 3,110, which is significantly deviated from the mean, currently around 2,990.
Conclusion:
Based on this pattern, we could expect either a deep retracement or at least a period of consolidation to allow the moving average time to catch up with the price.
Of course, shorting into such a strong bull run carries high risk, especially without a clear stop-loss level. However, even if Gold spikes to 3,150 or even 3,170, I strongly believe that the price will eventually drop and touch the 20-period moving average.
Disclosure: I am part of Trade Nation's Influencer program and receive a monthly fee for using their TradingView charts in my analyses and educational articles.

GOLD surges above $3,100 as April 2 approachesThe international OANDA:XAUUSD has jumped above 3,100 USD for the first time in this trading day, as concerns about US President Donald Trump's tariff policy and its possible economic consequences, along with geopolitical uncertainties, have prompted a new round of safe-haven investment.
As of press time, spot OANDA:XAUUSD was up 0.86% at $3,111/oz, having earlier hit an all-time high of $3,111.55, surpassing the all-time high set last Friday.
Trump signed a proclamation last week imposing a 25% tariff on imported cars, and markets are bracing for so-called “reciprocal tariffs” that the White House is expected to announce on Wednesday.
Gold has hit a record high and is up more than 18% this year, cementing its status as a hedge against economic and geopolitical uncertainty.
Earlier this month, gold prices broke through the psychological $3,000 mark for the first time, a milestone that reflects growing market concerns about economic uncertainty, geopolitical tensions and inflation that will continue to drive gold higher.
Since taking office, Trump has pushed through a series of new tariffs to protect U.S. industry and reduce the trade deficit, including a 25% tariff on imported cars and parts and an additional 10% tariff on all imports from China. He plans to announce a new round of reciprocal tariffs on April 2.
In addition to trade tensions, strong central bank demand for gold and inflows into exchange-traded funds (ETFs) will continue to support the incredible rally in gold prices this year.
In short, until there is a resolution to this back-and-forth tariff war, the tariff issue will continue to push prices higher in the near term.
Technical Outlook Analysis OANDA:XAUUSD
On the daily chart, gold has achieved a key bullish target at the confluence of the 0.50% Fibonacci extension with the upper edge of the price channel. Once gold breaks this level (3,113 USD), it will be eligible for further upside with the next target around 3,139 USD in the short term, which is the price point of the 0.618% Fibonacci extension.
In the meantime, the steep RSI remains active in the 80-100 area but shows no signs of weakening or correction, so in terms of momentum, the bullish momentum remains very strong.
As long as gold remains within the channel, it has a medium-term bullish outlook, otherwise the channel will become a short-term bullish trend channel.
During the day, the bullish outlook for gold will be highlighted by the following technical levels.
Support: 3,086 – 3,057 – 3,113 USD
Resistance: 3,139 USD
SELL XAUUSD PRICE 3140 - 3138⚡️
↠↠ Stoploss 3144
→Take Profit 1 3132
↨
→Take Profit 2 3126
BUY XAUUSD PRICE 3085 - 3087⚡️
↠↠ Stoploss 3081
→Take Profit 1 3093
↨
→Take Profit 2 3099

GOLD MARKET ANALYSIS AND COMMENTARY - [March 31 - April 04]This week, the international OANDA:XAUUSD increased sharply from 3,003 USD/oz to 3,087 USD/oz and closed this week at 3,085 USD/oz.
The reason for the sharp increase in gold prices is that US President Donald Trump decided to impose a 25% tax on imported cars into the US. This seems to go against Mr. Trump's previous statement about "easing" tariffs, causing investors to worry that US partner countries will retaliate, making the global trade war more intense.
Some countries, such as the UK and Japan, have taken some steps to appease and actively negotiate to avoid US tariffs, while many other countries have announced their readiness to retaliate against US tariffs. Therefore, many experts believe that the tariff policy announced by Mr. Trump on April 2 will be very unpredictable.
If Mr. Trump still decides to impose tariffs on many countries, the gold price next week may continue to increase sharply, far exceeding 3,100 USD/oz. However, if Mr. Trump narrows the scale of tariffs as announced and does not impose additional industry-specific tariffs on lumber, semiconductors, and pharmaceuticals, the gold price next week is at risk of facing strong profit-taking pressure, especially when the gold price is already deep in the overbought zone.
In addition to the Trump administration's tax policy, investors also need to pay close attention to the US non-farm payrolls (NFP) report to be released next weekend, because this index will directly impact the Fed's interest rate policy.
🕹SOME DATA THAT MAY AFFECT GOLD PRICES NEXT WEEK:
The most notable economic news in the coming week will be the US implementation of global trade tariffs on Wednesday, along with the March non-farm payrolls report due Friday morning. Experts warn that both events could increase the appeal of gold as a safe-haven asset. In addition, a number of other important US economic data will be released, including the ISM manufacturing PMI and JOLTS job vacancies on Tuesday, the ADP employment report on Wednesday, along with the ISM services PMI and weekly jobless claims on Thursday.
📌Technically, short-term perspective on the H1 chart, gold price next week may continue to surpass the 3100 round resistance level, approaching the Fibonacci 261.8 level around the price of 3,123 USD/oz. The current support level is established around the 3057 level, if next week gold price trades below this level, gold price is at risk of falling to around the 3,000 USD/oz round resistance level.
Notable technical levels are listed below.
Support: 3,057 – 3,051USD
Resistance: 3,100 – 3,113USD
SELL XAUUSD PRICE 3133 - 3131⚡️
↠↠ Stoploss 3137
BUY XAUUSD PRICE 2999 - 3001⚡️
↠↠ Stoploss 2995

AUD/USD 1-hour downtrend - Will 0.6200 Trigger a Reversal?The AUD/USD pair has been trending downward on the 1-hour chart, maintaining strong bearish momentum. In its latest move lower, it formed a significant 1-hour Fair Value Gap (FVG), aligning closely with the 0.786 Fibonacci retracement level.
Given this confluence, there is a possibility that AUD/USD could revisit this level to reject and continuing its decline. However, if bearish pressure persists, the pair may extend its drop toward the key 4-hour support at 0.6200.
A potential bullish engulfing candle at this 0.6200 support level could signal a shift in market structure, indicating a possible change of character to the upside. However, it is still uncertain if we will revisit this 4-hour support.
