AUD/USD 1-hour downtrend - Will 0.6200 Trigger a Reversal?The AUD/USD pair has been trending downward on the 1-hour chart, maintaining strong bearish momentum. In its latest move lower, it formed a significant 1-hour Fair Value Gap (FVG), aligning closely with the 0.786 Fibonacci retracement level.
Given this confluence, there is a possibility that AUD/USD could revisit this level to reject and continuing its decline. However, if bearish pressure persists, the pair may extend its drop toward the key 4-hour support at 0.6200.
A potential bullish engulfing candle at this 0.6200 support level could signal a shift in market structure, indicating a possible change of character to the upside. However, it is still uncertain if we will revisit this 4-hour support.
Signals

ETHEREUM BULLISH BIAS|LONG|
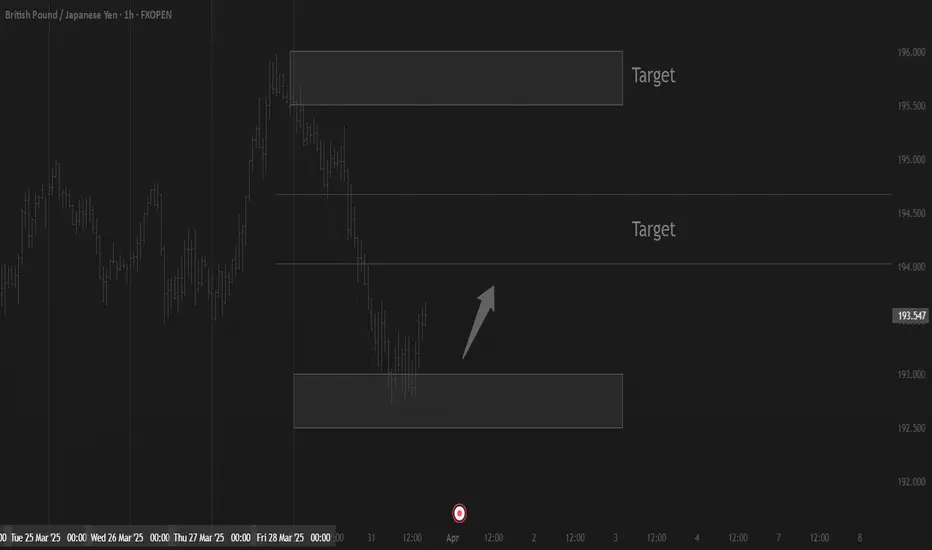
✅ETHEREUM fell again to retest the support of 1760$
But it is a strong key level
So I think that there is a high chance
That we will see a further bullish
Move up given that we are already
Seeing a bullish move up
LONG🚀
✅Like and subscribe to never miss a new idea!✅
Disclosure: I am part of Trade Nation's Influencer program and receive a monthly fee for using their TradingView charts in my analysis.

USD_CHF SHORT SIGNAL|
✅USD_CHF is going up now
But a strong resistance level is ahead at 0.8860
Thus I am expecting a pullback
Which means we can enter a
Short trade with the TP of 0.8835
And the SL of 0.8866 but its is a
Risky setup so we recommend to use
A small lot size
SHORT🔥
✅Like and subscribe to never miss a new idea!✅
Disclosure: I am part of Trade Nation's Influencer program and receive a monthly fee for using their TradingView charts in my analysis.

BTC DOMINANCE
Disclaimer 👉 This is my personal analysis for educational purposes , Buy/Sell/Trade at your own risk. I am not a financial Advisor

EUR_JPY GROWTH AHEAD|LONG|
✅EUR_JPY has retested a key support level of 160.600
And as the pair is already making a bullish rebound
A move up to retest the supply level above at 163.000 is likely
LONG🚀
✅Like and subscribe to never miss a new idea!✅
Disclosure: I am part of Trade Nation's Influencer program and receive a monthly fee for using their TradingView charts in my analysis.

NZDJPY Approaching Key Resistance — Potential Sell SetupOANDA:NZDJPY is approaching a key resistance zone, a level where sellers have consistently stepped in, leading to notable bearish reversals in the past. This area is marked by strong selling pressure, increasing the likelihood of a bearish move if sellers regain control.
The current price action suggests that if the pair confirms resistance through signals like bearish engulfing candles, long upper wicks, or increased selling volume, we could see a downward move toward 86.100, which represents a logical target based on previous price behavior and market structure.
However, if the price breaks above this zone and sustains, the bearish outlook may be invalidated, opening the door for further upside.
Just my take on support and resistance zones—not financial advice. Always confirm your setups and trade with solid risk management.
Best of luck!

Trading balanceThe price is currently in the resistance zone and has prospects of entering the balance zone. If the balance zone is overcome, the price is able to reach the target near the opposite resistance zone.
S&P500 during TRUMP's 2018 vs 2025 TRADE WAR.The S&P500 index (SPX) has started off the year in disappointing fashion as since mid-February the market has corrected by over -10% and of course almost all of it is attributed to the trade tariffs imposed by President Trump. As you know, this is not the first time Trump goes into a Trade War. The 1st has started in January 2018 when the first tariff announcements were made against China.
We can say that Trump's 2nd Trade War officially started on March 03 2025, with tariff implementations against Mexico, Canada and China. As you can see, the build up to both Trade Wars has been identical both in structural price count and in 1W RSI terms.
By the week of February 05 2018, the index has dropped by a little over -11%, hit the 1W MA50 (blue trend-line) and the 0.236 Fibonacci retracement level and rebounded, while the 1W RSI formed a Lower Low. We can claim that this are roughly the levels we are now. That drop started a Megaphone pattern, which ran through all of 2018. The ultimate bottom for this Megaphone Trade War pattern came in December 24 2018 on the 1W MA200 (orange trend-line).
Right now, the 1W RSI is almost on Lower Lows while crossing below its 1W MA50 and what remains to be seen is if it will hit its 0.236 Fib to form the bottom of the Megaphone or will rebound now.
Do you think Trump's 2nd Trade War will keep the market highly volatile within a Megaphone or will plunge it even more?
-------------------------------------------------------------------------------
** Please LIKE 👍, FOLLOW ✅, SHARE 🙌 and COMMENT ✍ if you enjoy this idea! Also share your ideas and charts in the comments section below! This is best way to keep it relevant, support us, keep the content here free and allow the idea to reach as many people as possible. **
-------------------------------------------------------------------------------
💸💸💸💸💸💸
👇 👇 👇 👇 👇 👇

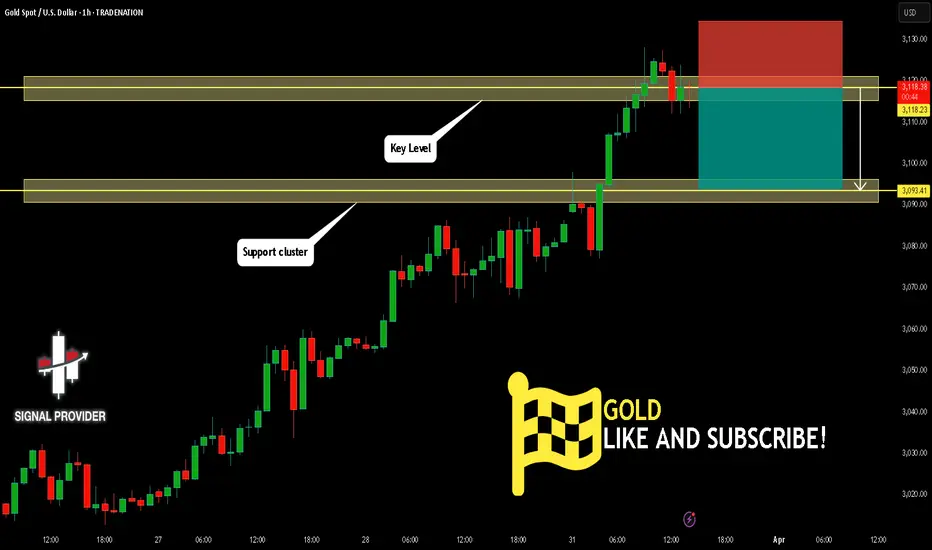
GOLD Will Go Down From Resistance! Short!
Here is our detailed technical review for GOLD.
Time Frame: 1h
Current Trend: Bearish
Sentiment: Overbought (based on 7-period RSI)
Forecast: Bearish
The market is trading around a solid horizontal structure 3,118.23.
The above observations make me that the market will inevitably achieve 3,093.41 level.
P.S
We determine oversold/overbought condition with RSI indicator.
When it drops below 30 - the market is considered to be oversold.
When it bounces above 70 - the market is considered to be overbought.
Disclosure: I am part of Trade Nation's Influencer program and receive a monthly fee for using their TradingView charts in my analysis.
Like and subscribe and comment my ideas if you enjoy them!
USDCAD Will Go Higher! Long!
Take a look at our analysis for USDCAD.
Time Frame: 7h
Current Trend: Bullish
Sentiment: Oversold (based on 7-period RSI)
Forecast: Bullish
The market is testing a major horizontal structure 1.434.
Taking into consideration the structure & trend analysis, I believe that the market will reach 1.444 level soon.
P.S
Overbought describes a period of time where there has been a significant and consistent upward move in price over a period of time without much pullback.
Disclosure: I am part of Trade Nation's Influencer program and receive a monthly fee for using their TradingView charts in my analysis.
Like and subscribe and comment my ideas if you enjoy them!

GBPUSD Will Go Up! Buy!
Please, check our technical outlook for GBPUSD.
Time Frame: 9h
Current Trend: Bullish
Sentiment: Oversold (based on 7-period RSI)
Forecast: Bullish
The market is approaching a key horizontal level 1.294.
Considering the today's price action, probabilities will be high to see a movement to 1.305.
P.S
Please, note that an oversold/overbought condition can last for a long time, and therefore being oversold/overbought doesn't mean a price rally will come soon, or at all.
Disclosure: I am part of Trade Nation's Influencer program and receive a monthly fee for using their TradingView charts in my analysis.
Like and subscribe and comment my ideas if you enjoy them!

CADJPY Will Move Lower! Sell!
Here is our detailed technical review for CADJPY.
Time Frame: 4h
Current Trend: Bearish
Sentiment: Overbought (based on 7-period RSI)
Forecast: Bearish
The market is approaching a significant resistance area 104.000.
Due to the fact that we see a positive bearish reaction from the underlined area, I strongly believe that sellers will manage to push the price all the way down to 102.916 level.
P.S
The term oversold refers to a condition where an asset has traded lower in price and has the potential for a price bounce.
Overbought refers to market scenarios where the instrument is traded considerably higher than its fair value. Overvaluation is caused by market sentiments when there is positive news.
Disclosure: I am part of Trade Nation's Influencer program and receive a monthly fee for using their TradingView charts in my analysis.
Like and subscribe and comment my ideas if you enjoy them!

BITCOIN Is Going Down! Sell!
Here is our detailed technical review for BITCOIN.
Time Frame: 4h
Current Trend: Bearish
Sentiment: Overbought (based on 7-period RSI)
Forecast: Bearish
The market is trading around a solid horizontal structure 83,714.88.
The above observations make me that the market will inevitably achieve 81,433.62 level.
P.S
Please, note that an oversold/overbought condition can last for a long time, and therefore being oversold/overbought doesn't mean a price rally will come soon, or at all.
Disclosure: I am part of Trade Nation's Influencer program and receive a monthly fee for using their TradingView charts in my analysis.
Like and subscribe and comment my ideas if you enjoy them!

EURUSD 4H Bearish Cross starting the peak formation.The EURUSD pair posted a strong rebound last week, which is along the lines of our long-term bearish structure estimate, similar to the September 2024 Top.
The 4H MA50/100 Bearish Cross that was formed on Thursday, simply confirms that the pattern goes according to plan as on September 06 2024, the price got rejected after its completion and then rebounded to test Resistance 1 before the ultimate market peak.
We still expect a similar development, with our ultimate long-term Target being 1.03650, just above Support 1.
-------------------------------------------------------------------------------
** Please LIKE 👍, FOLLOW ✅, SHARE 🙌 and COMMENT ✍ if you enjoy this idea! Also share your ideas and charts in the comments section below! This is best way to keep it relevant, support us, keep the content here free and allow the idea to reach as many people as possible. **
-------------------------------------------------------------------------------
Disclosure: I am part of Trade Nation's Influencer program and receive a monthly fee for using their TradingView charts in my analysis.
💸💸💸💸💸💸
👇 👇 👇 👇 👇 👇

Lingrid | EURUSD ABC pullback Completed. Possible SHORTOANDA:EURUSD market formed an ABC pullback and tested the area above Friday's high. The price action remains within the previous week's range, indicating a lack of overall trend in the market. However, if the price rejects the resistance zone, I believe it may drop further, potentially forming another ABC move toward the 1.06000 support level. Since the price has cleared zone below the 1.07700 level, it may retest this area, despite the previous false breakout. I anticipate that if the price does not close above the 1.08500 resistance zone, it will likely move toward the previous week's low. My goal is support zone around 1.07610
Traders, If you liked this educational post🎓, give it a boost 🚀 and drop a comment 📣

XAUUSD Time to start selling?Gold (XAUUSD) finally hit our 3 month $3000 target that we've been pursuing since the very first week of this year (January 06, see chart below) and in later stages upgraded to $3100:
Now the price has reached the top of the 1.5-year Channel Up, forming a similar 1D MACD peak formation while completing the +22.50% rise that the previous two major Bullish Legs had. As you can see, the pattern makes its Higher High on the 2nd MACD Bearish Cross and in 2 out of 3 Bearish Legs it retraced all the way to the 0.5 Fibonacci level, while on the remaining it the correction was contained to just above the 0.382 Fib.
On all cases the price came close to the 1D MA100 (green trend-line) before bottoming. As a result, even though some more Trump announcements may cause a momentary push upwards, we technically think that it is a solid level to turn bearish now with a fair 2900 Target on the 0.382 Fibonacci where by the end of April it should come close to the 1D MA100.
-------------------------------------------------------------------------------
** Please LIKE 👍, FOLLOW ✅, SHARE 🙌 and COMMENT ✍ if you enjoy this idea! Also share your ideas and charts in the comments section below! This is best way to keep it relevant, support us, keep the content here free and allow the idea to reach as many people as possible. **
-------------------------------------------------------------------------------
Disclosure: I am part of Trade Nation's Influencer program and receive a monthly fee for using their TradingView charts in my analysis.
💸💸💸💸💸💸
👇 👇 👇 👇 👇 👇

Lingrid | BTCUSD continues to Consolidate. Potenial LongBINANCE:BTCUSDT market tested the previous week's high but then pulled back from the resistance zone around 89,000. On the daily timeframe, the last candle is a doji, indicating a loss of selling pressure. Additionally, it reached the low of the last two weeks, and below this level, there is liquidity waiting to be tapped. Given that the overall market is moving sideways after sell offs, I believe the price may bounce off the PWLs and the psychological level at 80,000 towards the 85,000. Overall, I expect the monthly candle to close as a doji as well. My goal is resistance zone around 84,000
Traders, If you liked this educational post🎓, give it a boost 🚀 and drop a comment 📣

BITCOIN This is why it will make new ATH this year.The simplest explanation is perhaps sometimes the best. In this context, this is a simple yet powerful Bitcoin (BTCUSD) chart, showing why the Bull Cycle hasn't peaked yet and why a new All Time High (ATH) is coming by the end of 2025.
So, this is the 12M time-frame, essentially each BTC candle represents 1 whole year (12 months). If you are familiar with BTC's 4-year Cycles, which we've been discussing regularly and in-depth on this channel, then it makes perfect sense to see the market peak, then decline for 1 year and then spend the remaining 3 making a Bull Cycle that will ultimately peak on the 4th year.
Practically each Cycle so far had 1 year of Bear Cycle and 3 years of Bull Cycle with the 3rd one always making a new All Time High (ATH) towards the end.
1 red candle followed by 3 green ones. Simplistic yet delivering a powerful message that since we are currently on Year 3 of the Bull Cycle, there are far more greater probabilities to end this 12M (1 year) candle in green as well and with a new ATH.
So what do you think? Ae we getting this fat green 2025 yearly candle or this time will be different? Feel free to let us know in the comments section below!
-------------------------------------------------------------------------------
** Please LIKE 👍, FOLLOW ✅, SHARE 🙌 and COMMENT ✍ if you enjoy this idea! Also share your ideas and charts in the comments section below! This is best way to keep it relevant, support us, keep the content here free and allow the idea to reach as many people as possible. **
-------------------------------------------------------------------------------
💸💸💸💸💸💸
👇 👇 👇 👇 👇 👇

Gold- Target and new ATH reached. Now what?In my analysis yesterday, I mentioned that Gold would likely reach a new all-time high (ATH), but for that to happen, it was crucial for bulls to hold strong at the 3025-3030 support zone.
Indeed, Gold made a new ATH, reaching my target zone of 3080 overnight. I closed my buy trade with a profit of 550 pips.
Now, the key question is: What’s next?
In my opinion, there’s a strong possibility that Gold will continue its upward movement and test the 3100 level. However, at the current price of 3075, entering a buy trade is not justified from a risk perspective.
For now, I’m staying out of the market. If a retracement occurs, I’ll be watching the 3050 zone closely—most importantly, I’ll assess how the market reacts at that level before making any decisions.
Disclosure: I am part of Trade Nation's Influencer program and receive a monthly fee for using their TradingView charts in my analyses and educational articles.

WHY GBPUSD BULLISH ?? DETAILED TECHNICAL AND FUNDAMENTALSThe GBP/USD currency pair is currently trading around 1.2950, exhibiting a bullish pennant pattern—a continuation signal that often precedes further upward movement. This pattern forms after a strong price surge, followed by a consolidation phase marked by converging trendlines. A breakout above the pennant's upper boundary could propel the pair toward the target price of 1.3100, indicating a potential gain of 150 pips.
Fundamentally, the British pound has demonstrated resilience, bolstered by the UK's robust economic performance and the Bank of England's measured approach to interest rate adjustments. Recent data indicates that the UK economy has maintained steady growth, with inflation rates aligning closely with the central bank's targets. Conversely, the US dollar has experienced fluctuations due to mixed economic indicators and evolving monetary policy expectations from the Federal Reserve. These dynamics contribute to the supportive environment for the pound against the dollar.
Technical analysis reinforces the bullish outlook for GBP/USD. The pair has been trading above key moving averages, with oscillators indicating strong upward momentum. The formation of the bullish pennant suggests a continuation of the prevailing uptrend. Key resistance levels to monitor include 1.3000 and 1.3040, with a sustained break above these points potentially paving the way toward the 1.3100 target. Additionally, the Relative Strength Index (RSI) remains in bullish territory, suggesting that the current uptrend has room to continue.
Traders should monitor key resistance levels closely, as a confirmed breakout could present a lucrative opportunity to capitalize on the anticipated movement. Implementing robust risk management strategies, such as setting appropriate stop-loss orders, is essential to navigate potential market volatility. Staying informed about upcoming economic data releases and central bank communications will also be crucial in effectively capitalizing on this trading opportunity.

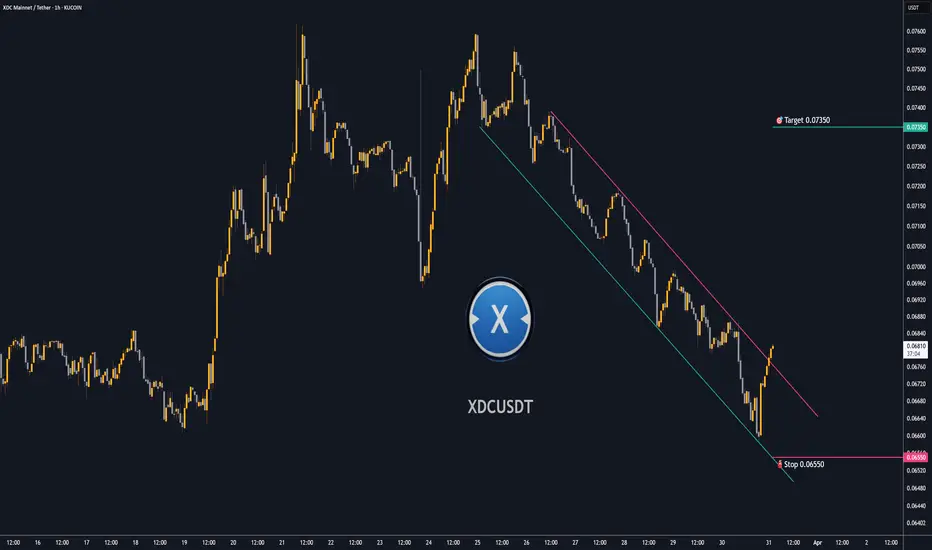
Trading opportunity for XDCUSDTBased on technical factors there is a Buy position in :
📊 XDCUSDT
🔵 Buy Now
🪫Stop loss 0.06550
🔋Target 0.07350
📏 R/R 2
💸RISK : 1%
We hope it is profitable for you ❤️
Please support our activity with your likes👍 and comments📝
#ETHUSDT is showing a reversal pattern📊 BYBIT:ETHUSDT.P is showing a reversal pattern — we expect the uptrend to continue if the breakout level holds!
🕒 Timeframe: 4H
➡️ BYBIT:ETHUSDT.P has formed a potential Double Bottom (Bottom 1 and Bottom 2) around $1,785–$1,809, indicating a possible trend reversal.
➡️ The key trading range (POC — Point of Control) is at $1,881.71, making it a major resistance level.
➡️ The price is also bouncing off the support zone, which aligns with the previous consolidation area.
➡️ Volume is increasing during the bounce, confirming buyers’ interest.
⚡️ Considering a potential long entry
⚡️ Maximum target based on the pattern — $2,522
📍 A breakout and hold above $1,849.71 will confirm the bullish scenario and attract more long liquidity.
📢 If the price drops below $1,785, the setup will be invalidated — high chance of a continued downtrend.
📢 The rise of BYBIT:ETHUSDT.P is possible due to reactions to the strong support zone and the forming Double Bottom pattern.
🕒 Timeframe: 1H
➡️ BYBIT:ETHUSDT.P has formed a Falling Wedge , which is a bullish pattern.
➡️ A second bottom ( Bottom 2 ) has formed, confirming a potential reversal.
➡️ The upper boundary of the wedge has already been broken, accompanied by a spike in volume.
➡️ A strong consolidation zone exists around $1,808–$1,820 — a retest could confirm a long entry.
⚡️ Holding above the wedge breakout is a signal for further upside.
📢 If the price falls back below $1,800 and buying momentum weakens — the scenario should be reconsidered.
📉 LONG BYBIT:ETHUSDT.P from $1851.0
🛡 Stop loss: $1835.00
🕒 Timeframe: 1H
🎯 Targets (TP):
💎 TP 1: $1860.00
💎 TP 2: $1871.00
💎 TP 3: $1882.00
💎 TP 4 (long-term target): $1890.00
🚀 BYBIT:ETHUSDT.P is maintaining a potential reversal pattern — we expect upward movement if volume confirms!

EUR-GBP Short From Resistance! Sell!
Hello,Traders!
EUR-GBP keeps growing
But the horizontal resistance
Is ahead around 0.8385
So after the retest will be
Expecting a local bearish
Correction to the downside
Sell!
Comment and subscribe to help us grow!
Check out other forecasts below too!
Disclosure: I am part of Trade Nation's Influencer program and receive a monthly fee for using their TradingView charts in my analysis.
