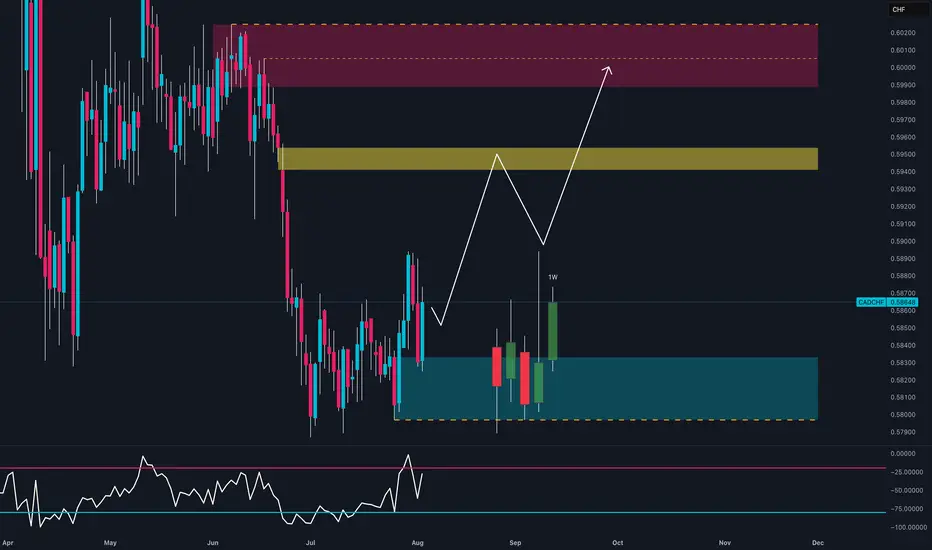
Everyone’s Short on CAD… But This Is Why I’m Going Long📊 CAD/CHF – August 4th, 2025 | Tactical Long Bias
🔹 Technical Outlook
The daily chart shows:
Strong bullish reaction within a weekly demand zone (0.5800–0.5830), confirmed by multiple lower wicks → growing buying pressure.
Weekly RSI bouncing out of oversold → potential mid-term reversal signal.
Structure may be shifting with a first target at 0.5950 (intermediate zone) and second target at 0.6000–0.6030 (major supply).
Recent bullish engulfing broke out of inside candle sequence → active technical trigger.
🧠 Commitment of Traders (COT) – July 29
Non-Commercials:
CAD: Aggressive increase in shorts (+3,888) and reduction in longs (-2,222) → heavily bearish speculative positioning.
CHF: Increase in longs (+936) and decrease in shorts (-1,095) → net bullish sentiment on CHF.
📌 However, CAD’s overstretched short positioning may lead to technical short-covering, especially if CHF starts to lose momentum.
📈 Seasonality – August
CHF: Range-bound or weak in August across all timeframes (20y, 15y, 10y).
CAD: Mild seasonal strength in August, especially on the 2y and 5y outlook.
➡️ Seasonal bias supports a tactical long on CAD/CHF during the first half of August.
✅ Trading Outlook
📌 Tactical Bias: LONG
🎯 First Target: 0.5950 → mid-level reaction zone.
🛑 Invalidation: below 0.5800 (demand breakdown).
🧠 Confluences: demand zone + RSI reversal + extreme COT positioning + seasonal support.
Signals
Lingrid | ETHUSDT Short-Term Move: Buying Opportunity at SupportThe price perfectly fulfilled my last idea . BINANCE:ETHUSDT is attempting a bounce after dipping into the lower boundary of its channel near the $3,400 support level. Price action has followed a descending structure with lower highs inside a broad downward channel. As long as the $3,400 zone holds, a rebound toward the mid-range resistance at $3,630 remains viable. Current positioning inside the "BUYING area" suggests momentum may flip bullish if a reversal structure forms.
📉 Key Levels
Buy trigger: Break above $3,630
Buy zone: $3,250 – $3,400
Target: $3,630 – $3,720
Invalidation: Break below $3,250
💡 Risks
Momentum still favors sellers from the recent sell-off
Failure to reclaim mid-range resistance could cap upside
Broader trend remains within a bearish channel structure
If this idea resonates with you or you have your own opinion, traders, hit the comments. I’m excited to read your thoughts!

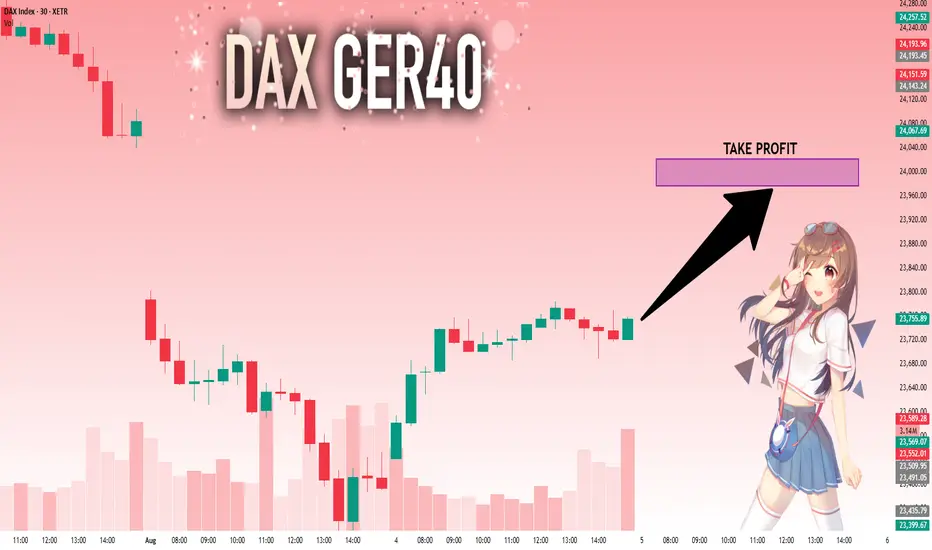
DAX: Bulls Are Winning! Long!
My dear friends,
Today we will analyse DAX together☺️
The market is at an inflection zone and price has now reached an area around 23,755.89 where previous reversals or breakouts have occurred.And a price reaction that we are seeing on multiple timeframes here could signal the next move up so we can enter on confirmation, and target the next key level of 23,976.72.Stop-loss is recommended beyond the inflection zone.
❤️Sending you lots of Love and Hugs❤️
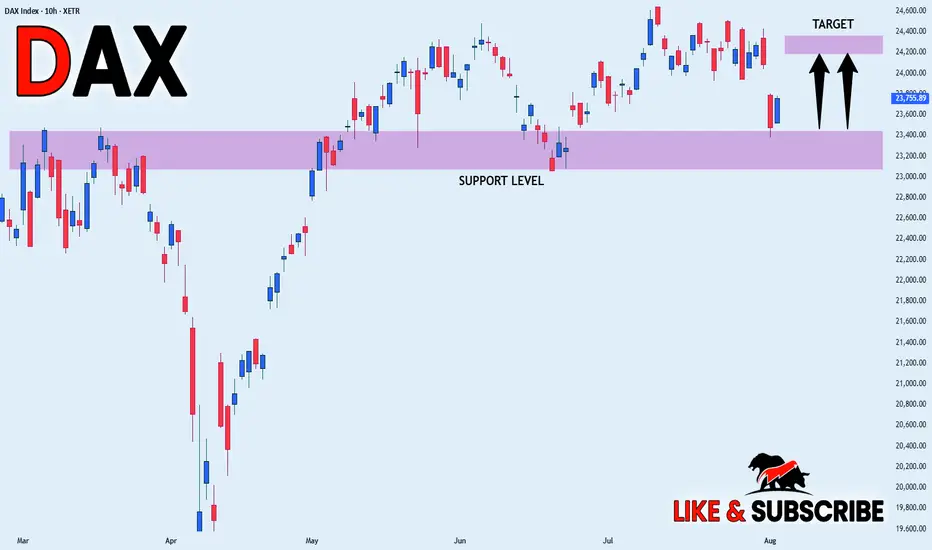
DAX WILL GROW|LONG|
✅DAX is trading in an
Uptrend and the index made
A bullish rebound from the
Horizontal support of 23,400
Which reinforces our bullish
Bias and we will be expecting
A further bullish move up
LONG🚀
✅Like and subscribe to never miss a new idea!✅
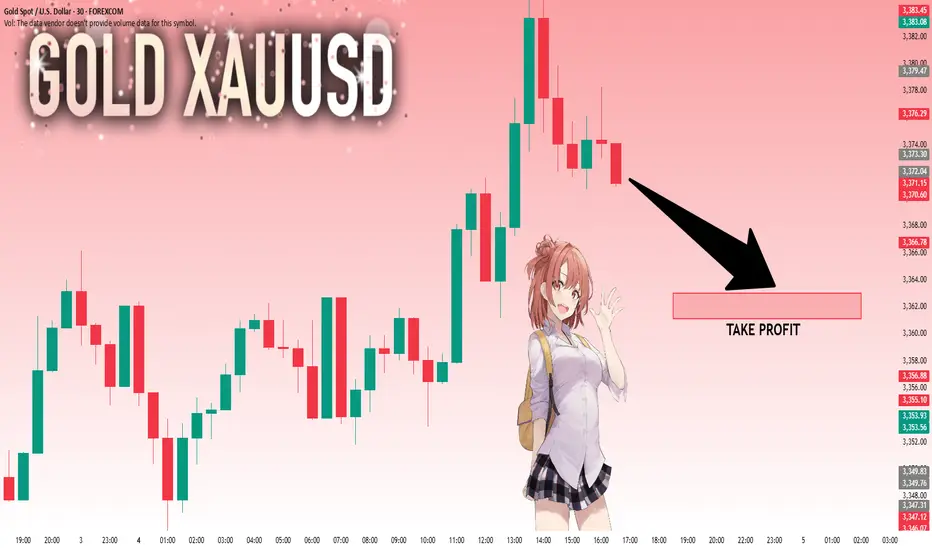
GOLD: Next Move Is Down! Short!
My dear friends,
Today we will analyse GOLD together☺️
The price is near a wide key level
and the pair is approaching a significant decision level of 3,372.04 Therefore, a strong bearish reaction here could determine the next move down.We will watch for a confirmation candle, and then target the next key level of 3,363.00..Recommend Stop-loss is beyond the current level.
❤️Sending you lots of Love and Hugs❤️
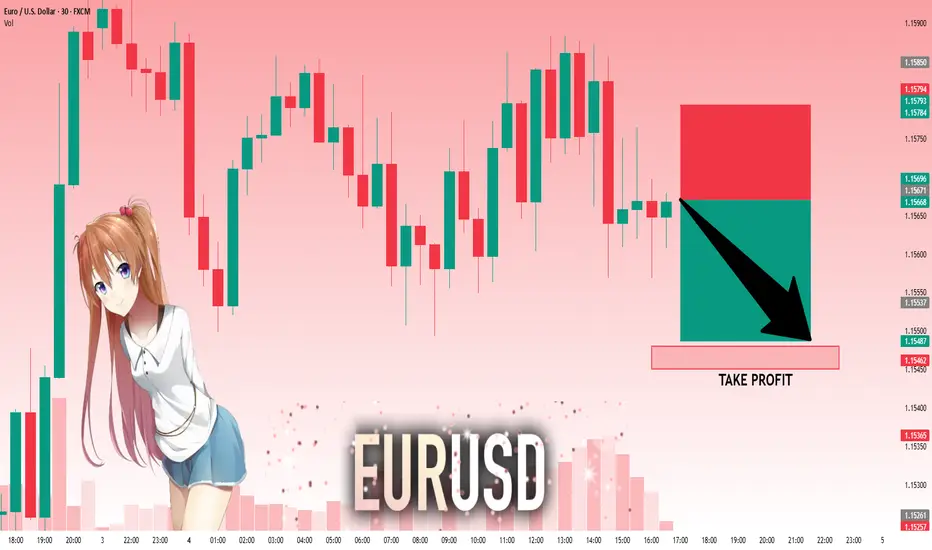
EURUSD: Target Is Down! Short!
My dear friends,
Today we will analyse EURUSD together☺️
The recent price action suggests a shift in mid-term momentum. A break below the current local range around 1.15671 will confirm the new direction downwards with the target being the next key level of 1.15480.and a reconvened placement of a stop-loss beyond the range.
❤️Sending you lots of Love and Hugs❤️
NATGAS Risky Long! Buy!
Hello,Traders!
NATGAS keeps falling down
In a strong downtrend
And Gas is locally oversold
So after the price hits the
Horizontal support of 2.860$
We will be expecting a
Local bullish correction
Buy!
Comment and subscribe to help us grow!
Check out other forecasts below too!
Disclosure: I am part of Trade Nation's Influencer program and receive a monthly fee for using their TradingView charts in my analysis.

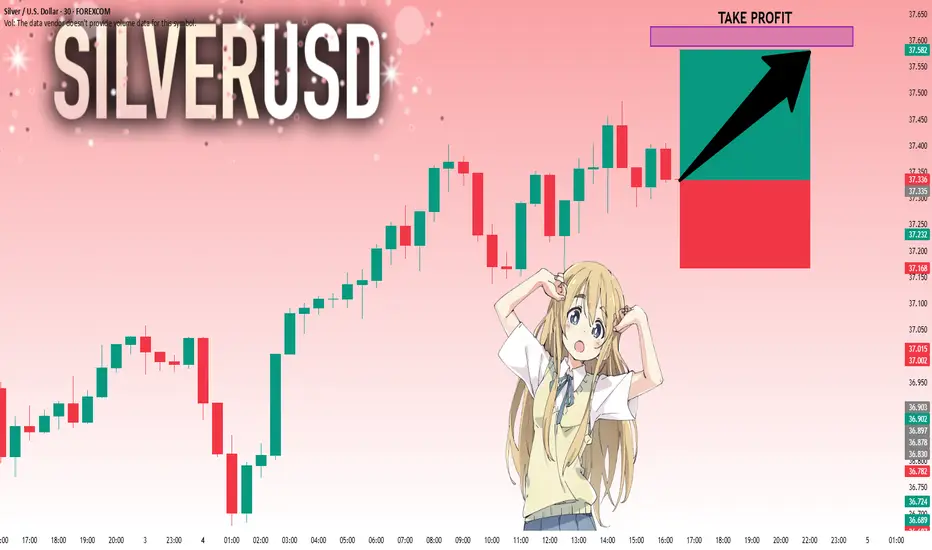
SILVER: Move Up Expected! Long!
My dear friends,
Today we will analyse SILVER together☺️
The in-trend continuation seems likely as the current long-term trend appears to be strong, and price is holding below a key level of 37.330 So a bearish continuation seems plausible, targeting the next low. We should enter on confirmation, and place a stop-loss beyond the recent swing level.
❤️Sending you lots of Love and Hugs❤️
EUR_JPY SUPPORT AHEA|LONG|
✅EUR_JPY is going down now
But a strong support level is ahead at 169.757
Thus I am expecting a rebound
And a move up towards the target of 170.400
LONG🚀
✅Like and subscribe to never miss a new idea!✅
Disclosure: I am part of Trade Nation's Influencer program and receive a monthly fee for using their TradingView charts in my analysis.

EUR-CHF Resistance Ahead! Sell!
Hello,Traders!
EUR-CHF went up sharply
And the pair is locally
Overbought so after it
Hits the horizontal resistance
Above at 0.9367 we will be
Expecting a local bearish correction
Sell!
Comment and subscribe to help us grow!
Check out other forecasts below too!
Disclosure: I am part of Trade Nation's Influencer program and receive a monthly fee for using their TradingView charts in my analysis.

After data shock, GOLD has bullish conditions againOANDA:XAUUSD rose more than 2% on Friday, hitting a one-week high, as weaker-than-expected U.S. non-farm payrolls data boosted hopes of a Federal Reserve rate cut and the announcement of new tariffs boosted safe-haven demand.
On the economic data front
Gold prices rose more than 2% in U.S. trading on Friday (Aug. 1), hitting a one-week high, as weaker-than-expected U.S. non-farm payrolls data fueled hopes of a Federal Reserve rate cut and safe-haven demand was boosted by the announcement of new tariffs.
The U.S. Department of Labor's Bureau of Labor Statistics reported that nonfarm payrolls increased by just 73,000 jobs in July, well below market expectations of 110,000. June's data was revised down to just 14,000, indicating a significant slowdown in job growth. The unemployment rate rose to 4.2%, indicating a cooling labor market.
The jobs data was weaker than expected, but slightly higher than the market's lowest forecast. This increases the likelihood of a rate cut by the Fed later this year. As a non-yielding asset, gold typically performs better in a low-interest-rate environment.
According to CME Group's FedWatch tool, market participants now expect the Federal Reserve to cut rates twice before the end of the year, starting in September. Earlier this week, the Fed held rates steady at 4.25%-4.50%. Chairman Powell said it was too early to determine whether a rate cut would be forthcoming in September, citing inflation and employment data.
On the trade front
Trump has imposed a new round of tariffs on exports from dozens of trading partners, including Canada, Brazil, India and Taiwan, causing a global market crash.
Countries are scrambling to negotiate a better deal. In times of economic and geopolitical uncertainty, safe-haven gold is in high demand.
So far in 2025, gold prices have risen more than $400, hitting a record high of $3,167.57/oz on April 3, driven by safe-haven demand and central bank buying.
Weak jobs data also sent the dollar lower against major currencies, further supporting gold prices as a weaker greenback makes gold more attractive to investors holding other currencies.
Investors' Attention Turns to September FOMC Meeting
Markets are now focused on the September Federal Open Market Committee (FOMC) meeting. Facing the dual pressures of volatile inflation, slowing employment and escalating global trade tensions, the Fed will have to balance its inflation target with economic growth.
Markets are betting on the Fed to begin a new round of easing, and gold, as a hedge against currency devaluation and economic uncertainty, is expected to continue to benefit.
Gold prices have risen more than 30% year-to-date, reflecting the market’s preference for safe-haven assets. If weak U.S. economic data continues in the coming weeks, or if new geopolitical conflicts emerge, gold prices are expected to continue their upward trend, challenging new highs for the year.
Summary, Commentary
Weak employment, new tariffs and a slumping stock market have all contributed to a strong recovery in gold prices. With the possibility of the US Federal Reserve cutting interest rates in September increasing significantly, gold market sentiment has warmed and risk aversion has returned.
Investors will need to keep a close eye on inflation data, Fed officials’ speeches, and whether Trump continues to stoke trade tensions, which could lead to greater volatility in the gold market.
Against the backdrop of the unexpected non-farm payrolls report and moderate inflation, the market has essentially “locked in” the possibility of a rate cut in September, but whether the cut will be 25 or 50 basis points, and whether there will be further rate cuts in the future, will depend on the interaction between the Fed members’ verbal guidance and market expectations.
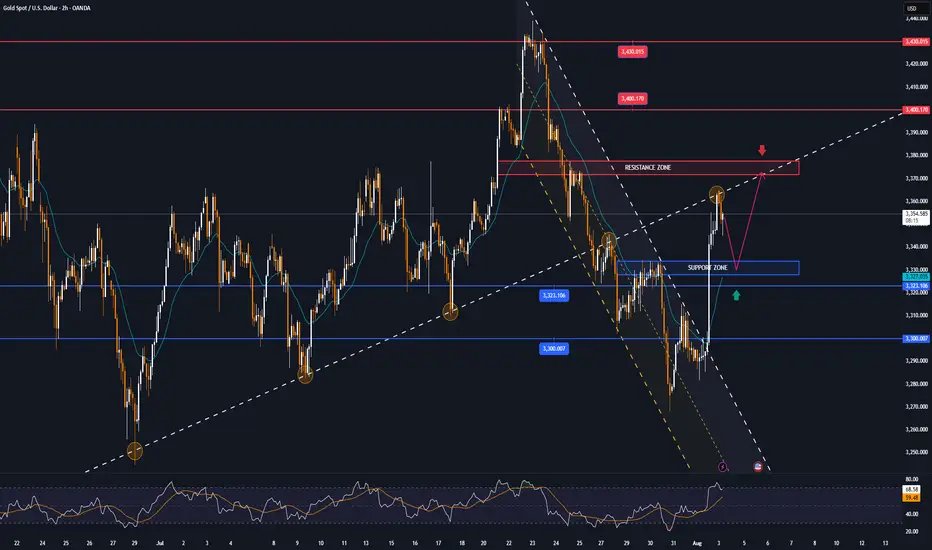
Technical Outlook Analysis OANDA:XAUUSD
On the daily chart, affected by the sudden weak data that shocked the market, gold broke most of the technical structure that was leaning towards the downside. Price action was pushed above the EMA21, while the short-term downtrend channel was also broken above and the Relative Strength Index crossed above 50.
These are the initial conditions for a short-term uptrend. But to confirm an uptrend and a new uptrend in the near term, gold needs to continue to break above the 0.236% Fibonacci retracement level (3,371 USD) first, then the target will be around 3,400 USD in the short term.
If gold breaks above $3,400 again, traders should set a new target of $3,430 in the short term, rather than $3,450 which is the all-time high.
Motivationally, the RSI has not reached oversold territory to provide pure reversal support, but it has been pushed by the market shock after the NFP data release, so this rally may not be sustainable in a purely motivational way either.
Overall, gold is now more bullish after a rally on Friday, opening up initial conditions for expectations of a new uptrend. And the notable points will be listed as follows.
Support: 3,323 – 3,310 – 3,300 USD
Resistance: 3,371 – 3,400 – 3,430 USD
SELL XAUUSD PRICE 3376 - 3374⚡️
↠↠ Stop Loss 3380
→Take Profit 1 3368
↨
→Take Profit 2 3362
BUY XAUUSD PRICE 3327 - 3329⚡️
↠↠ Stop Loss 3323
→Take Profit 1 3335
↨
→Take Profit 2 3341
SILVER Is Going Down! Sell!
Please, check our technical outlook for SILVER.
Time Frame: 1h
Current Trend: Bearish
Sentiment: Overbought (based on 7-period RSI)
Forecast: Bearish
The market is trading around a solid horizontal structure 3,722.4.
The above observations make me that the market will inevitably achieve 3,685.7 level.
P.S
Please, note that an oversold/overbought condition can last for a long time, and therefore being oversold/overbought doesn't mean a price rally will come soon, or at all.
Disclosure: I am part of Trade Nation's Influencer program and receive a monthly fee for using their TradingView charts in my analysis.
Like and subscribe and comment my ideas if you enjoy them!

USDJPY Will Grow! Buy!
Here is our detailed technical review for USDJPY.
Time Frame: 12h
Current Trend: Bullish
Sentiment: Oversold (based on 7-period RSI)
Forecast: Bullish
The market is testing a major horizontal structure 147.215.
Taking into consideration the structure & trend analysis, I believe that the market will reach 150.314 level soon.
P.S
The term oversold refers to a condition where an asset has traded lower in price and has the potential for a price bounce.
Overbought refers to market scenarios where the instrument is traded considerably higher than its fair value. Overvaluation is caused by market sentiments when there is positive news.
Disclosure: I am part of Trade Nation's Influencer program and receive a monthly fee for using their TradingView charts in my analysis.
Like and subscribe and comment my ideas if you enjoy them!

GBPUSD Will Go Higher From Support! Long!
Take a look at our analysis for GBPUSD.
Time Frame: 1h
Current Trend: Bullish
Sentiment: Oversold (based on 7-period RSI)
Forecast: Bullish
The market is approaching a key horizontal level 1.328.
Considering the today's price action, probabilities will be high to see a movement to 1.336.
P.S
We determine oversold/overbought condition with RSI indicator.
When it drops below 30 - the market is considered to be oversold.
When it bounces above 70 - the market is considered to be overbought.
Disclosure: I am part of Trade Nation's Influencer program and receive a monthly fee for using their TradingView charts in my analysis.
Like and subscribe and comment my ideas if you enjoy them!

EURJPY Will Go Down From Resistance! Short!
Please, check our technical outlook for EURJPY.
Time Frame: 12h
Current Trend: Bearish
Sentiment: Overbought (based on 7-period RSI)
Forecast: Bearish
The market is approaching a significant resistance area 170.468.
Due to the fact that we see a positive bearish reaction from the underlined area, I strongly believe that sellers will manage to push the price all the way down to 168.585 level.
P.S
Overbought describes a period of time where there has been a significant and consistent upward move in price over a period of time without much pullback.
Disclosure: I am part of Trade Nation's Influencer program and receive a monthly fee for using their TradingView charts in my analysis.
Like and subscribe and comment my ideas if you enjoy them!

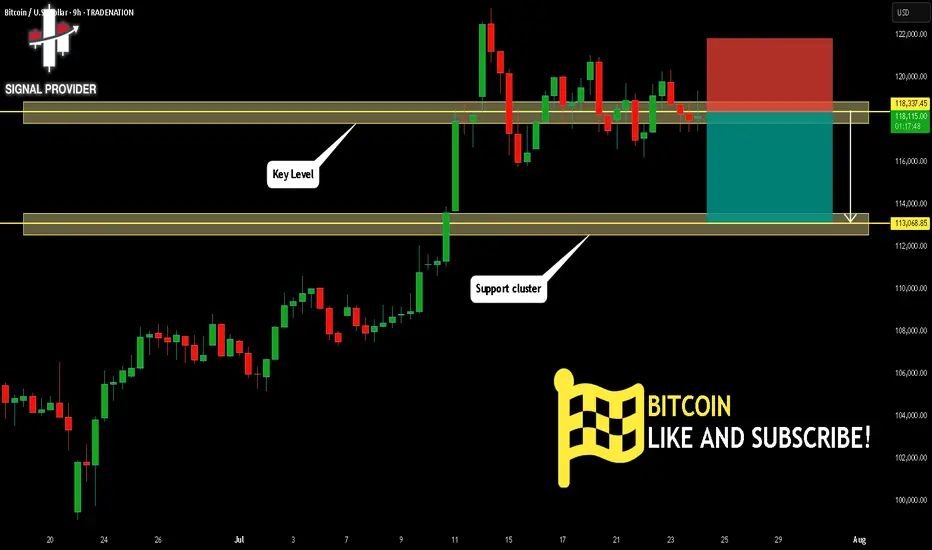
BITCOIN Will Fall! Short!
Take a look at our analysis for BITCOIN.
Time Frame: 9h
Current Trend: Bearish
Sentiment: Overbought (based on 7-period RSI)
Forecast: Bearish
The market is approaching a key horizontal level 118,337.45.
Considering the today's price action, probabilities will be high to see a movement to 113,068.85.
P.S
We determine oversold/overbought condition with RSI indicator.
When it drops below 30 - the market is considered to be oversold.
When it bounces above 70 - the market is considered to be overbought.
Disclosure: I am part of Trade Nation's Influencer program and receive a monthly fee for using their TradingView charts in my analysis.
Like and subscribe and comment my ideas if you enjoy them!
GBPJPY Is Very Bearish! Sell!
Please, check our technical outlook for GBPJPY.
Time Frame: 45m
Current Trend: Bearish
Sentiment: Overbought (based on 7-period RSI)
Forecast: Bearish
The market is approaching a significant resistance area 198.994.
Due to the fact that we see a positive bearish reaction from the underlined area, I strongly believe that sellers will manage to push the price all the way down to 198.786 level.
P.S
Overbought describes a period of time where there has been a significant and consistent upward move in price over a period of time without much pullback.
Disclosure: I am part of Trade Nation's Influencer program and receive a monthly fee for using their TradingView charts in my analysis.
Like and subscribe and comment my ideas if you enjoy them!

AUDJPY Will Go Lower! Sell!
Take a look at our analysis for AUDJPY.
Time Frame: 9h
Current Trend: Bearish
Sentiment: Overbought (based on 7-period RSI)
Forecast: Bearish
The price is testing a key resistance 96.734.
Taking into consideration the current market trend & overbought RSI, chances will be high to see a bearish movement to the downside at least to 96.102 level.
P.S
Overbought describes a period of time where there has been a significant and consistent upward move in price over a period of time without much pullback.
Disclosure: I am part of Trade Nation's Influencer program and receive a monthly fee for using their TradingView charts in my analysis.
Like and subscribe and comment my ideas if you enjoy them!

USDCHF Will Go Down From Resistance! Short!
Take a look at our analysis for USDCHF.
Time Frame: 9h
Current Trend: Bearish
Sentiment: Overbought (based on 7-period RSI)
Forecast: Bearish
The market is approaching a key horizontal level 0.813.
Considering the today's price action, probabilities will be high to see a movement to 0.806.
P.S
We determine oversold/overbought condition with RSI indicator.
When it drops below 30 - the market is considered to be oversold.
When it bounces above 70 - the market is considered to be overbought.
Disclosure: I am part of Trade Nation's Influencer program and receive a monthly fee for using their TradingView charts in my analysis.
Like and subscribe and comment my ideas if you enjoy them!

GOLD Will Go Higher From Support! Buy!
Here is our detailed technical review for GOLD.
Time Frame: 12h
Current Trend: Bullish
Sentiment: Oversold (based on 7-period RSI)
Forecast: Bullish
The market is testing a major horizontal structure 3,311.57.
Taking into consideration the structure & trend analysis, I believe that the market will reach 3,369.04 level soon.
P.S
The term oversold refers to a condition where an asset has traded lower in price and has the potential for a price bounce.
Overbought refers to market scenarios where the instrument is traded considerably higher than its fair value. Overvaluation is caused by market sentiments when there is positive news.
Disclosure: I am part of Trade Nation's Influencer program and receive a monthly fee for using their TradingView charts in my analysis.
Like and subscribe and comment my ideas if you enjoy them!

USOIL Is Bearish! Short!
Please, check our technical outlook for USOIL.
Time Frame: 9h
Current Trend: Bearish
Sentiment: Overbought (based on 7-period RSI)
Forecast: Bearish
The market is approaching a significant resistance area 69.178.
Due to the fact that we see a positive bearish reaction from the underlined area, I strongly believe that sellers will manage to push the price all the way down to 66.684 level.
P.S
The term oversold refers to a condition where an asset has traded lower in price and has the potential for a price bounce.
Overbought refers to market scenarios where the instrument is traded considerably higher than its fair value. Overvaluation is caused by market sentiments when there is positive news.
Disclosure: I am part of Trade Nation's Influencer program and receive a monthly fee for using their TradingView charts in my analysis.
Like and subscribe and comment my ideas if you enjoy them!

Gold on the edge: Will 3,270 break as Fed pressure builds?Hello traders, what’s your view on XAUUSD?
Yesterday, gold remained under pressure as a series of fresh U.S. economic data reinforced expectations that the Federal Reserve will keep interest rates higher for longer. As a result, U.S. Treasury yields surged, the dollar strengthened, and gold came under renewed selling pressure. Currently, XAUUSD is trading around 3,288 USD, down 0.04% on the day.
From a technical standpoint, gold is clearly trading within a well-defined downward-sloping channel, confirming the dominance of bearish momentum. Moreover, both the EMA34 and EMA89 are acting as dynamic resistance levels, repeatedly rejecting any short-term recovery attempts—highlighting the strength of the current downtrend.
If a pullback occurs before the next leg lower, the confluence of resistance and the EMA zone will be crucial to watch. It could offer ideal conditions for potential short setups in line with the trend.
Looking ahead, the next key support lies at 3,270 USD. A break below this level could open the door for a deeper move toward the 32XX area.
What do you think? Will gold continue to drop further?
Good luck and trade safe!

Gold Trading Strategy XAUUSD August 4, 2025Gold Trading Strategy XAUUSD August 4, 2025:
Gold prices rose more than 2% last Friday, hitting a one-week high, as weaker-than-expected US non-farm payrolls data boosted hopes for a Federal Reserve rate cut and the announcement of new tariffs fueled safe-haven demand for gold.
Fundamental news: The non-farm payrolls report showed only 73,000 jobs added in July, well below market expectations of 110,000. The unemployment rate rose to 4.2%, indicating a cooling labor market.
Technical Analysis: Gold prices are rising strongly after a strong candle in the 3285 - 3300 area as previously predicted. The bullish pattern on the H1 frame has shown that the buyers are returning very strongly. Currently, the price is showing signs of sideway at the 336x area, our strategy today will be to wait for trading at the support zones of the gold price. Important price zones today: 3315 - 3320 and 3330 - 3335.
Today's trading trend: BUY.
Recommended orders:
Plan 1: BUY XAUUSD zone 3330 - 3332
SL 3327
TP 3335 - 3345 - 3355 - 3370.
Plan 2: BUY XAUUSD zone 3318 - 3320
SL 3315
TP 3323 - 3333 - 3343 - 3363.
Plan 3: SELL XAUUSD zone 3370 - 3372
SL 3375
TP 3367 - 3357 - 3347 - 3337 (small volume).
Wishing you a safe, smooth and profitable trading week.💗💗💗💗💗
