Hellena | SPX500 (4H): LONG to resistance area of 5682.Colleagues, I think that the deep downward movement is over and at the moment I expect an upward movement in a five-wave impulse. At the moment I expect a correction in wave “2” to the area of 5100, after which I expect the development of wave “3” at least to the resistance area of 5682.
There are two possible ways to enter the position:
1) Market entry
2) Pending Limit Orders.
Manage your capital correctly and competently! Only enter trades based on reliable patterns!
Signals

NZDJPY DETAILED ANALYSIS TECHNICAL AND FUNDAMENTALS NZDJPY is currently trading near 85.80, forming a textbook falling wedge pattern on the daily chart. This structure typically signals a bullish reversal, and price action is nearing the apex, suggesting an imminent breakout. A confirmed breakout above the upper trendline could initiate a strong bullish wave, with a medium-term target set at 95.000.
Fundamentally, the New Zealand dollar is supported by expectations of stable monetary policy from the Reserve Bank of New Zealand, while the Japanese yen faces pressure due to the Bank of Japan's continued dovish stance. This divergence in monetary policies favors NZD strength against JPY, aligning with the bullish technical setup.
Technical indicators, including the Relative Strength Index (RSI) and Moving Average Convergence Divergence (MACD), are showing signs of bullish momentum. A decisive close above the wedge's resistance line would confirm the breakout, potentially attracting further buying interest and accelerating the move toward the 95.000 target.
In summary, NZDJPY is poised for a bullish breakout from the falling wedge pattern, supported by both technical and fundamental factors. Traders should monitor for a confirmed breakout and consider positioning accordingly to capitalize on the anticipated upward movement.

GBP_AUD LOCAL LONG|
✅GBP_AUD went down to retest
A horizontal support of 2.0680
Which makes me locally bullish biased
And I think that a move up
From the level is to be expected
Towards the target above at 2.0840
LONG🚀
✅Like and subscribe to never miss a new idea!✅
Disclosure: I am part of Trade Nation's Influencer program and receive a monthly fee for using their TradingView charts in my analysis.

Lingrid | TONUSDT pullback Approaching Psychological LevelThe price perfectly fulfilled my last idea . It reached the target. OKX:TONUSDT is pulling back after testing the upper resistance area near 3.40. Price is now moving toward a key support zone around 3.00, where the downward trend-line intersects horizontal structure. If bulls defend this level, the chart suggests a possible bounce back toward 3.25. The bullish scenario remains active as long as the trend-line holds.
📈 Key Levels
Buy zone: 3.03 – 3.06
Buy trigger: bounce from trend-line support
Target: 3.25
Sell trigger: break below 3.03
💡 Risks
Loss of 3.03 could lead to a drop toward the 2.78 support.
If the bounce lacks volume, recovery may be weak.
Watch for fakeouts near the trend-line—confirmation is key.
Traders, if you liked this idea or if you have your own opinion about it, write in the comments. I will be glad 👩💻

Gold Trapped? Everyone’s Long… But Price is Going Down!Gold (XAU/USD) is showing signs of exhaustion after its explosive rally that pushed it beyond $3,400. We are now witnessing a pullback phase, with price directly testing a key demand zone between $3,050 and $2,980. From a technical standpoint, this is the last major defense before a potential drop toward the $2,832 area.
The current bearish pressure is supported by a powerful blend of macro, positioning, and behavioral factors:
COT Report – Gold: Non-commercials (speculators) are aggressively closing long positions and opening shorts, which signals a breakdown in the short-term bullish narrative. On the other hand, commercials (hedgers), also known as the "smart money", are steadily increasing their long exposure, hinting at a potential accumulation zone forming.
COT Report – USD Index: Speculative funds are stacking long positions on the dollar, which continues to add downside pressure on gold. As long as this persists, any upside attempt on XAU/USD will likely face headwinds.
Seasonality: May tends to be historically bullish for gold, but June is seasonally weak. The strongest seasonal window opens between July and August, suggesting the possibility of a deeper pullback before the next bullish wave.
Retail Sentiment: Over 75% of retail traders are long on XAU/USD, typically a contrarian signal. This sets the stage for a classic stop-hunt scenario, where price flushes lower to trigger retail stop-losses before a potential reversal.
📌 Conclusion: In true Bridgewater fashion, we’re seeing a divergence between positioning and price action. In the short term, gold remains vulnerable to a move toward $2,832. However, if that zone holds, it could provide a compelling opportunity to accumulate for a potential summer swing rally toward all-time highs.

GOLD drops sharply to $43, important support areaOANDA:XAUUSD encountered a sudden sell-off in early Asian trading on Thursday (May 1). The current price of gold is around $3,245/ounce, down sharply by $43 on the day and at a key technical position.
OANDA:XAUUSD fell for a third consecutive day as signs that trade talks between the United States and China may be progressing reduced demand for safe-haven assets, Bloomberg reported on Thursday. China Central Television said the United States has been in touch with China through various channels.
Bloomberg noted that concerns about the global trade outlook were also eased by news that the Trump administration was close to announcing the first of a series of deals that would reduce planned tariffs on several countries.
OANDA:XAUUSD have risen about 25% this year, largely as investors flocked to the safe-haven asset as U.S. President Donald Trump’s rapidly shifting trade policies have roiled markets and stoked fears of a global economic slowdown.
However, inflows into gold ETFs, central bank buying and strong speculative demand from China will also provide fundamental support for gold prices.
Looking ahead, Friday’s US non-farm payrolls report could reveal the initial impact of Trump’s trade policies on the economy.
Technical Outlook Analysis OANDA:XAUUSD
On the daily chart, gold is trading at a crucial support area for long-term bullish expectations with support from Ema21 converging with the 0.50% Fibonacci retracement. If gold is sold below $3,228, it could continue to decline further with a target of around $3,163 in the short term, the price point of the 0.618% Fibonacci retracement.
On the other hand, the Relative Strength Index (RSI) is also approaching the 50 level after a period of correction, which in this case acts as the nearest support.
It can be said that with the current position, gold has the most support with EMA21 converging with Fibonacci retracement 0.50% in terms of trend, and RSI approaching 50 is support in terms of momentum.
During the day, the current position still shows that gold has the potential to increase in price and the notable positions will also be listed as follows.
Support: 3,245 - 3,228 USD
Resistance: 3,267 - 3,292 USD
SELL XAUUSD PRICE 3295 - 3293⚡️
↠↠ Stop Loss 3299
→Take Profit 1 3287
↨
→Take Profit 2 3281
BUY XAUUSD PRICE 3195 - 3197⚡️
↠↠ Stop Loss 3191
→Take Profit 1 3203
↨
→Take Profit 2 3209

EURUSD – Bear Flag Before Further Drop?Like most of the market, EURUSD reacted strongly on April 22–23 with a sharp move down. Since then, price has entered a consolidation phase — and thIS pause has now taken the shape of a bear flag, a classic continuation pattern that often leads to further correction once confirmed.
📉 Key levels to watch:
1.1350 – Initial trigger for the flag break
1.1300 – Confirmation of bearish momentum
Target: 1.1100
Invalidation: A return above 1.1500 would negate the pattern and call for reassessment.
Disclosure: I am part of Trade Nation's Influencer program and receive a monthly fee for using their TradingView charts in my analyses and educational articles.

GBPUSD Analysis – Classic Spike, But Bearish Bias HoldsTwo days ago, TRADENATION:GBPUSD did what it often does – spiked above the previous high with no solid fundamental reason, likely just to hunt stops.
This return into the resistance zone might look bullish on the surface, but the bigger picture remains unchanged.
Has the market really resumed its up move, or was this just a trap?
Despite the upward push, the overall outlook stays bearish. A drop towards the 1.3000 zone is still highly probable – but we need confirmation.
Why the bearish scenario remains valid:
• The spike occurred without strong fundamental backing.
• Price hasn't broken the strong 1.35 resistance.
• Key support for a breakdown lies at 1.3330–1.3350 – a clear break here is the signal for downside continuation.
Trading Plan:
Wait for a break below 1.3330–1.3350, and then look for short setups on lower timeframes.
Invalidation comes only if the pair pushes and sustains above 1.3500, in which case the bearish thesis is off the table.
Disclosure: I am part of Trade Nation's Influencer program and receive a monthly fee for using their TradingView charts in my analyses and educational articles.

No Bottom Yet: Gold’s Technical Targets Point LowerSince Monday, I’ve been saying that Gold hasn’t finished correcting, and the price action is now confirming that view. The drop continued with breaks below two key levels: the 3300 figure and the 3270 support, which was the recent low.
After some sideways action (a bit of a limbo), we finally got the clean breakdown. At the time of writing, price sits at 3248, having just bounced slightly from the 3240 support, which aligns with mid-April’s ATH.
Now comes the big question: Is Gold done correcting?
In my opinion, not yet – and here’s why:
Technical reasons for further downside:
1. The break below 3270 is significant and opens the door to deeper correction.
2. We now have two measured targets:
📉 Measured range target: ~1000 pips → puts price below 3200.
📉 First leg down: ~2500 pips → could push price closer to the 3000 zone.
Trading Plan:
The strategy remains unchanged: sell the rallies. As long as price stays below 3270-3290 zone, downside continuation is the base case.
A move towards at least 3200 looks very probable – and deeper levels can't be ruled out.
Don’t rush to call a bottom – let the market show when the correction is really done. Until then, the bias stays bearish. 🚀
P.S: Expect great volatility to remain
Disclosure: I am part of Trade Nation's Influencer program and receive a monthly fee for using their TradingView charts in my analyses and educational articles.

Evening Star Pattern on XAGUSD – Downtrend Ahead?Last week, XAGUSD managed to break above the 33.15 resistance level, making a local high at 33.70.
However, the price quickly reversed and formed an Evening Star candlestick pattern, signaling selling pressure.
At the time of writing, the price is hovering around 33.00 – a key pivot point for the next move.
The bias leans toward a downside continuation:
- A clear break below 33.00 opens the way for a further drop toward 32.00,
- With a potential final target at 31.00.
Disclosure: I am part of Trade Nation's Influencer program and receive a monthly fee for using their TradingView charts in my analyses and educational articles.

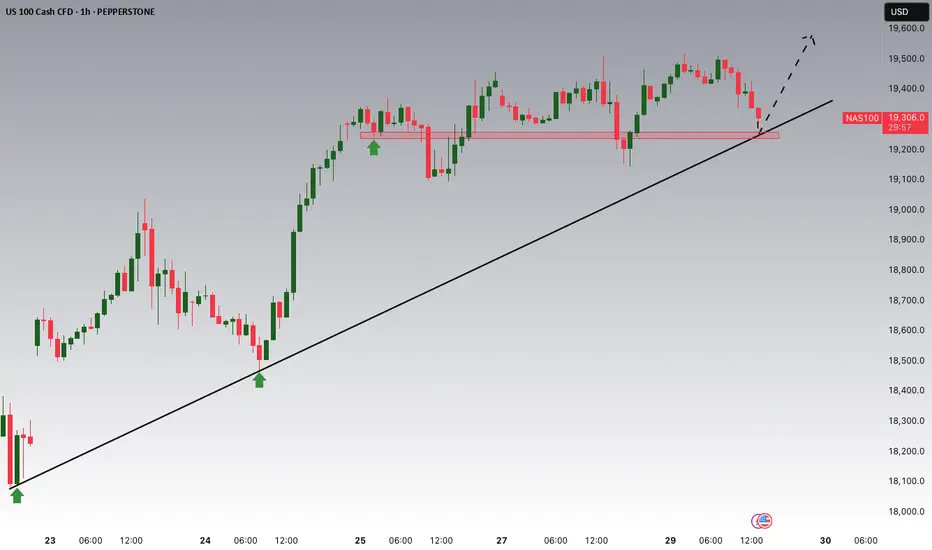
NASDAQ Potential UpsidesHey Traders, in today's trading session we are monitoring NAS100 for a buying opportunity around 19250 zone, NASDAQ is trading in an uptrend and currently is in a correction phase in which it is approaching the trend at 19250 support and resistance area.
Trade safe, Joe.
GOLD RISKY LONG|
✅GOLD will soon retest a key support level of 3260$
So I think that the pair will make a rebound
And go up to retest the supply level above at 3323$
LONG🚀
✅Like and subscribe to never miss a new idea!✅
Disclosure: I am part of Trade Nation's Influencer program and receive a monthly fee for using their TradingView charts in my analysis.

EUR-CAD Bearish Breakout! Sell!
Hello,Traders!
EUR-CAD made a bearish
Breakout of the key horizontal
Level of 1.5700 and the
Breakout is confirmed
So we are bearish biased
And we will be expecting
A further bearish move down
Sell!
Comment and subscribe to help us grow!
Check out other forecasts below too!
Disclosure: I am part of Trade Nation's Influencer program and receive a monthly fee for using their TradingView charts in my analysis.

USD-CAD Will Keep Falling! Sell!
Hello,Traders!
USD-CAD is trading in a
Downtrend and the pair made
A retest of the horizontal
Resistance of 1.3868 from where
We are already seeing a bearish
Move down so we will be
Expecting a further
Bearish move down
Sell!
Comment and subscribe to help us grow!
Check out other forecasts below too!
Disclosure: I am part of Trade Nation's Influencer program and receive a monthly fee for using their TradingView charts in my analysis.

DAX: Target Is Down! Short!
My dear friends,
Today we will analyse DAX together☺️
The market is at an inflection zone and price has now reached an area around 22,461.17 where previous reversals or breakouts have occurred.And a price reaction that we are seeing on multiple timeframes here could signal the next move down so we can enter on confirmation, and target the next key level of 22,275.67..Stop-loss is recommended beyond the inflection zone.
❤️Sending you lots of Love and Hugs❤️

GOLD: Move Up Expected! Long!
My dear friends,
Today we will analyse GOLD together☺️
The price is near a wide key level
and the pair is approaching a significant decision level of 3,300.87 Therefore, a strong bullish reaction here could determine the next move up.We will watch for a confirmation candle, and then target the next key level of 3,322.41.Recommend Stop-loss is beyond the current level.
❤️Sending you lots of Love and Hugs❤️

EURUSD: Local Bearish Bias! Short!
My dear friends,
Today we will analyse EURUSD together☺️
The recent price action suggests a shift in mid-term momentum. A break below the current local range around 1.13366 will confirm the new direction downwards with the target being the next key level of 1.13144.and a reconvened placement of a stop-loss beyond the range.
❤️Sending you lots of Love and Hugs❤️

SILVER: Strong Growth Ahead! Long!
My dear friends,
Today we will analyse GOLD together☺️
The in-trend continuation seems likely as the current long-term trend appears to be strong, and price is holding above a key level of 32.688 So a bullish continuation seems plausible, targeting the next high. We should enter on confirmation, and place a stop-loss beyond the recent swing level.
❤️Sending you lots of Love and Hugs❤️

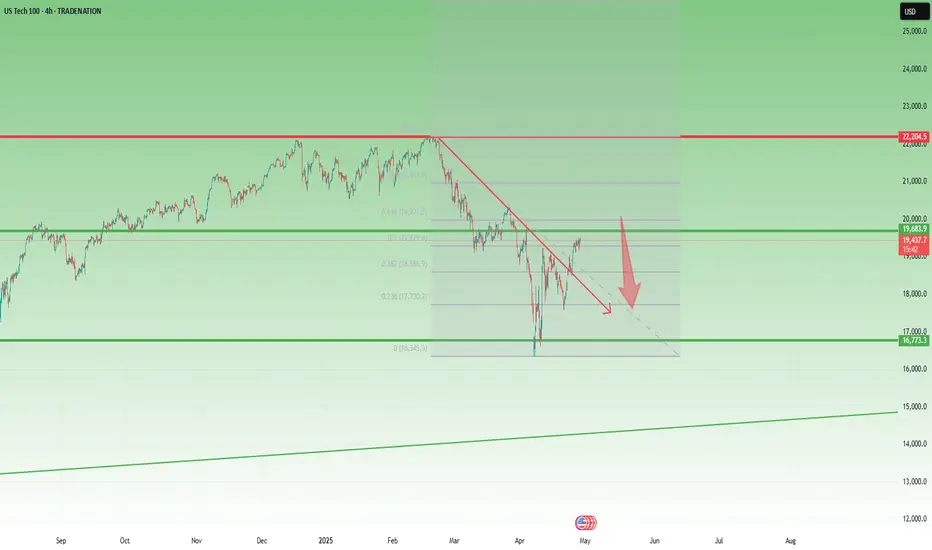
NASDAQ Recovery Looks Fragile Below 20,500After the steep drop to 16,300, NAS100 started to recover, forming a higher low and managing to break back above the falling trendline drawn from the all-time high (ATH).
While these are positive developments, in my opinion, the trend is likely to reverse to the downside soon.
Technically, the index is now entering a heavy resistance zone, marked by:
• The golden sell zone between the 50% and 61.8% Fibonacci retracement,
• Psychological resistance at 20,000,
• Major horizontal resistance around 20,500.
As long as the price remains below 20,500, I favor short trades, targeting a potential drop to at least 18,000
Disclosure: I am part of Trade Nation's Influencer program and receive a monthly fee for using their TradingView charts in my analyses and educational articles.
SOLANA's massive 1W MA200 rebound hints to enormous rally ahead.Solana (SOLUSD) made a very strong rebound on its 1W MA200 (orange trend-line) on the very first week of April. Now that the month is about to close, it has already completed three straight green 1W candles and is aiming for the critical 1W MA50 (blue trend-line) test.
If broken, we expect it to turn into a long-term Support again and target the Higher Highs of the Wedge at $350. After all, the 1W MA200 rebound also made contact on the 2-year Higher Lows trend-line of the Bull Cycle, so technically it is a massive Bottom cluster. The 1W RSI also broke above its MA last week, confirmed the buying pressure.
Given that the recent 3-month correction was -67.23%, identical to the last correction (May 2021) of the previous Cycle, we expect one final rally to the 2.0 Fibonacci extension at $900, if the Higher Highs trend-line breaks.
-------------------------------------------------------------------------------
** Please LIKE 👍, FOLLOW ✅, SHARE 🙌 and COMMENT ✍ if you enjoy this idea! Also share your ideas and charts in the comments section below! This is best way to keep it relevant, support us, keep the content here free and allow the idea to reach as many people as possible. **
-------------------------------------------------------------------------------
💸💸💸💸💸💸
👇 👇 👇 👇 👇 👇

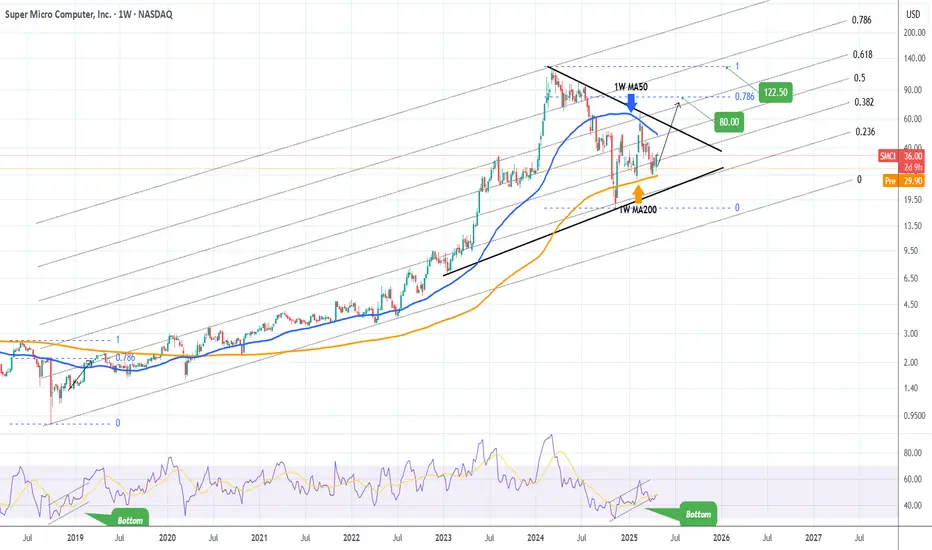
SMCI Is it still a buy following the Q3 revenue and profit cut?Super Micro Computer Inc (SMCI) cut its third-quarter revenue and profit expectations due to delays in customer spending, amplifying worries of a pullback in AI-linked investments and pushing its shares down -16% pre-market.
It has been 6 months since we issued a major buy signal on SMCI (November 07 2024, see chart below):
Even tough our $122.50 long-term Target still stands, we have to move it later on the time-line until the economic outlook shows the positive signs of 2024 again.
Until then, we have a more medium-term Target of $80.00, which is on the 0.786 Fibonacci retracement level, the same level the price hit in March 2019, following the first U.S. - China Trade War in 2018.
As you can see, the recovery patterns in terms of 1W RSI between the two fractals are almost identical.
Right now the stock is basically consolidating within the 1W MA50 (blue trend-line) and 1W MA200 (orange trend-line), waiting for the next round of expansion news for the market, to break above the Triangle.
-------------------------------------------------------------------------------
** Please LIKE 👍, FOLLOW ✅, SHARE 🙌 and COMMENT ✍ if you enjoy this idea! Also share your ideas and charts in the comments section below! This is best way to keep it relevant, support us, keep the content here free and allow the idea to reach as many people as possible. **
-------------------------------------------------------------------------------
💸💸💸💸💸💸
👇 👇 👇 👇 👇 👇
DOW JONES Are you willing to bet against a 15 year pattern?Dow Jones (DJI) will close the month today with a massive rebound 1M candle after almost touching its 1M MA50 (blue trend-line). Since the October 2010 break above the 1M MA50, after the market recovered from the 2008 Housing Crisis, the 1M MA50 has been the ultimate long-term Buy Entry as it has always signaled rallies that ranged from +58% to +67%.
The 1M MA50 has also kept the index mostly within the 0.382 - 0.786 Fibonacci range (blue zone) of the multi-year Channel Up. Given also that the 1W RSI also reached in April its ultimate Buy Zone (green), we view this as the best long-term Buy Signal the index handed to us since the September 2022 bottom of the Inflation Crisis.
Since the Bullish Legs that followed have been fairly consistent on average, we expect another 58% rise minimum. Assuming a 'bad-case' scenario of being contained within the 0.786 Fib, then a 56000 long-term Target seems more than fair.
Are you willing to go against this pattern?
-------------------------------------------------------------------------------
** Please LIKE 👍, FOLLOW ✅, SHARE 🙌 and COMMENT ✍ if you enjoy this idea! Also share your ideas and charts in the comments section below! This is best way to keep it relevant, support us, keep the content here free and allow the idea to reach as many people as possible. **
-------------------------------------------------------------------------------
💸💸💸💸💸💸
👇 👇 👇 👇 👇 👇

GOLD Is Going Up! Long!
Take a look at our analysis for GOLD.
Time Frame: 2h
Current Trend: Bullish
Sentiment: Oversold (based on 7-period RSI)
Forecast: Bullish
The market is on a crucial zone of demand 3,278.91.
The oversold market condition in a combination with key structure gives us a relatively strong bullish signal with goal 3,328.53 level.
P.S
We determine oversold/overbought condition with RSI indicator.
When it drops below 30 - the market is considered to be oversold.
When it bounces above 70 - the market is considered to be overbought.
Disclosure: I am part of Trade Nation's Influencer program and receive a monthly fee for using their TradingView charts in my analysis.
Like and subscribe and comment my ideas if you enjoy them!
