SILVER: Strong Bearish Sentiment! Short!
My dear friends,
Today we will analyse SILVER together☺️
The recent price action suggests a shift in mid-term momentum. A break below the current local range around 33.293 will confirm the new direction downwards with the target being the next key level of 33.052.and a reconvened placement of a stop-loss beyond the range.
❤️Sending you lots of Love and Hugs❤️
Signals

YFI/USDTIn this analysis, I’m tracking the recent downtrend on the US30 daily chart. Based on the current pattern and technical indicators (like RSI divergence and a bounce off a key support zone), I expect a potential reversal or at least a short-term correction. Entry signal is marked based on my Smart Bot strategy.

EURUSD: Bulls Are Winning! Long!
My dear friends,
Today we will analyse EURUSD together☺️
The in-trend continuation seems likely as the current long-term trend appears to be strong, and price is holding above a key level of 1.13750 So a bullish continuation seems plausible, targeting the next high. We should enter on confirmation, and place a stop-loss beyond the recent swing level.
❤️Sending you lots of Love and Hugs❤️

GBPUSD SHORT TRADE?GBPUSD Grab liquidity from buyside and close below range this shows the power of bears in the market and also dxy show strength so go short with sl above high

DXY Will Go Higher! Buy!
Please, check our technical outlook for DXY.
Time Frame: 9h
Current Trend: Bullish
Sentiment: Oversold (based on 7-period RSI)
Forecast: Bullish
The market is approaching a key horizontal level 99.288.
Considering the today's price action, probabilities will be high to see a movement to 100.788.
P.S
We determine oversold/overbought condition with RSI indicator.
When it drops below 30 - the market is considered to be oversold.
When it bounces above 70 - the market is considered to be overbought.
Disclosure: I am part of Trade Nation's Influencer program and receive a monthly fee for using their TradingView charts in my analysis.
Like and subscribe and comment my ideas if you enjoy them!

USOIL Will Go Down! Sell!
Here is our detailed technical review for USOIL.
Time Frame: 8h
Current Trend: Bearish
Sentiment: Overbought (based on 7-period RSI)
Forecast: Bearish
The market is approaching a significant resistance area 61.191.
Due to the fact that we see a positive bearish reaction from the underlined area, I strongly believe that sellers will manage to push the price all the way down to 56.009 level.
P.S
Overbought describes a period of time where there has been a significant and consistent upward move in price over a period of time without much pullback.
Disclosure: I am part of Trade Nation's Influencer program and receive a monthly fee for using their TradingView charts in my analysis.
Like and subscribe and comment my ideas if you enjoy them!

AUDUSD Will Move Lower! Short!
Take a look at our analysis for AUDUSD.
Time Frame: 1D
Current Trend: Bearish
Sentiment: Overbought (based on 7-period RSI)
Forecast: Bearish
The market is on a crucial zone of supply 0.641.
The above-mentioned technicals clearly indicate the dominance of sellers on the market. I recommend shorting the instrument, aiming at 0.629 level.
P.S
Please, note that an oversold/overbought condition can last for a long time, and therefore being oversold/overbought doesn't mean a price rally will come soon, or at all.
Disclosure: I am part of Trade Nation's Influencer program and receive a monthly fee for using their TradingView charts in my analysis.
Like and subscribe and comment my ideas if you enjoy them!

GBPAUD Is Bullish! Long!
Please, check our technical outlook for GBPAUD.
Time Frame: 1D
Current Trend: Bullish
Sentiment: Oversold (based on 7-period RSI)
Forecast: Bullish
The price is testing a key support 2.089.
Current market trend & oversold RSI makes me think that buyers will push the price. I will anticipate a bullish movement at least to 2.151 level.
P.S
The term oversold refers to a condition where an asset has traded lower in price and has the potential for a price bounce.
Overbought refers to market scenarios where the instrument is traded considerably higher than its fair value. Overvaluation is caused by market sentiments when there is positive news.
Disclosure: I am part of Trade Nation's Influencer program and receive a monthly fee for using their TradingView charts in my analysis.
Like and subscribe and comment my ideas if you enjoy them!

BITCOIN Why is this rally surprising you?Bitcoin (BTCUSD) has completed 3 straight green weeks, with an impressive last 1W candle closing and started the new one right where it left. This rise shouldn't be surprising to most as it has fulfilled all the conditions that initiated all major rallies since the November 2022 Bear market bottom.
The first week of April rebounded strongly on the 1W MA50 (blue trend-line), which as mentioned numerous times on our channel, has been this Bull Cycle's main Support and kickstarted the Q4 2023 and Q4 2024 rallies.
At the same time, the 1W RSI broke last week above its MA, which has been the final confirmation of those Bullish Legs. With the 1W Bollinger Bands (BB) still ranged, the top trend-line is expected to rise aggressively as BTC's uptrend accelerates, something that resembles October 2023 and October 2024.
Throughout this Bull Cycle, those rallies have lasted around the same time, the longest being 14 weeks. As a result, the latest the current Bullish Leg tops should be on the week of July 14 2025 and a +92% rise as February - March 2024 should deliver a test of the Higher Highs trend-line around $140000.
Do you think that's the most probable scenario? Feel free to let us know in the comments section below!
-------------------------------------------------------------------------------
** Please LIKE 👍, FOLLOW ✅, SHARE 🙌 and COMMENT ✍ if you enjoy this idea! Also share your ideas and charts in the comments section below! This is best way to keep it relevant, support us, keep the content here free and allow the idea to reach as many people as possible. **
-------------------------------------------------------------------------------
💸💸💸💸💸💸
👇 👇 👇 👇 👇 👇

NZDCAD Will Go Lower From Resistance! Short!
Here is our detailed technical review for NZDCAD.
Time Frame: 2h
Current Trend: Bearish
Sentiment: Overbought (based on 7-period RSI)
Forecast: Bearish
The market is trading around a solid horizontal structure 0.827.
The above observations make me that the market will inevitably achieve 0.824 level.
P.S
We determine oversold/overbought condition with RSI indicator.
When it drops below 30 - the market is considered to be oversold.
When it bounces above 70 - the market is considered to be overbought.
Disclosure: I am part of Trade Nation's Influencer program and receive a monthly fee for using their TradingView charts in my analysis.
Like and subscribe and comment my ideas if you enjoy them!

GBPJPY DETAILED TECHNICAL AND FUNDAMENTALSGBPJPY is currently trading around the 191.00 zone, and price action is forming a classic bullish flag pattern on the 4H chart. This follows a strong impulse leg, suggesting a potential continuation to the upside. The consolidation is tight and healthy, showing market participants are preparing for a breakout. My upside target stands at 193.000, which aligns with the descending trendline resistance.
From a fundamental perspective, the British Pound remains supported by recent hawkish signals from the Bank of England, which is facing persistent inflation pressures. Meanwhile, the Japanese Yen continues to weaken across the board due to the Bank of Japan’s ultra-loose monetary stance and its defense of yield curve control, which makes it less attractive in a high-interest environment.
Technically, this setup aligns with key momentum indicators and market structure. If price breaks above the flag pattern with volume confirmation, we can expect buyers to take control, pushing price toward the 193.000 resistance zone. This level also coincides with a key liquidity area where prior sellers may be trapped.
Overall, GBPJPY continues to offer a solid bullish bias in the short term. The pair is fundamentally and technically aligned for a push higher. Breakout traders should monitor closely as the price approaches the upper trendline of the flag. This is one of the most watched JPY pairs right now—momentum is building.

CADCHF BULLISH OR BEARISH DETAILED ANALYSISCADCHF is currently trading around 0.59 and is showing a strong bullish wave setup on the 8H chart. Price has bounced cleanly from a key demand zone, with a visible bullish engulfing structure, suggesting buyers are stepping in aggressively. My target for this setup is 0.61, aligning with a previous major resistance level seen on the chart.
Fundamentally, CAD is supported by firm oil prices and hawkish sentiment from the Bank of Canada, while CHF has been under mild pressure due to reduced demand for safe-haven assets amid improving global sentiment. This macro backdrop favors CAD strength in the near term, adding fuel to the bullish technicals.
If the current momentum sustains, we could see a smooth continuation toward 0.61, with a favorable risk-reward ratio. As always, trade management and patience are key, especially as the pair approaches resistance. I remain bullish on CADCHF in the short term, based on both structure and fundamentals.

EURGBP Technical Setup: 1:3 R:R Opportunity on RetestAfter the drop to 0.8250 — a level not touched since 2022 — EURGBP rebounded to 0.8450 before starting another decline.
However, the 0.8250 support held firm once again, a higher low follow, and EURGBP eventually broke above 0.8450, confirming a double bottom pattern.
Price acceleration quickly took the pair above 0.8700, and now EURGBP is undergoing a normal correction.
The broken neckline at 0.8450 now acts as clear support.
Traders could look to buy near the 0.8450 retest, using a tight stop below the neckline, and aiming for at least a 1:3 risk-reward ratio.
Disclosure: I am part of Trade Nation's Influencer program and receive a monthly fee for using their TradingView charts in my analyses and educational articles.

Lingrid | GBPCAD bullish BREAKOUT with Short-Term PullbackThe price has perfectly followed my previous analysis . Recently, the FX:GBPCAD price broke and closed above the previous week's high and the psychological level at 1.85000. Following this significant breakout, the market is pulling back toward the support level, trendline, and triangle pattern. If the market remains above this support zone, the chance of continuation is high. I expect the price to reject this level and rebound, following with continuation toward the next resistance zone. This price action demonstrates classic market behavior following a key breakout, where a retest of former resistance as new support often provides an optimal entry point for traders aligned with the prevailing trend direction. My goal is resistance zone around 1.86510
Traders, if you liked this idea or if you have your own opinion about it, write in the comments. I will be glad 👩💻

Next Move PossibleAs of April 29, 2025, the XAU/USD (gold) market remains highly volatile, influenced by geopolitical tensions, economic uncertainty, and central bank policies. Here’s an overview of the current outlook and potential next moves for gold prices:
📈 Current Market Overview
• Record Highs: Gold prices recently reached a record high of nearly $3,500 per ounce, driven by concerns over U.S.-China trade tensions, inflation, and geopolitical instability. 
• Recent Pullback: Following the peak, gold experienced a slight retreat, trading around $3,350 per ounce. This pullback is attributed to easing trade tensions and reassurances from U.S. President Trump regarding Federal Reserve Chair Jerome Powell. 
🔮 Forecast and Key Levels
• Short-Term Support Levels: Analysts have identified key support levels at $3,145, $2,955, and $2,790, based on historical highs and Fibonacci retracement levels. 
• Resistance and Profit-Taking: The $3,500 region is seen as a potential profit-taking point if gold mounts a recovery. 
• Long-Term Outlook: JP Morgan forecasts that gold prices will surpass $4,000 per ounce by Q2 2026, driven by heightened recession risks amid escalating U.S. tariffs and a prolonged U.S.-China trade conflict. Goldman Sachs also revised its 2025 year-end gold price forecast to $3,700/oz, noting that in extreme scenarios, gold could approach $4,500/oz. 
⚠️ Risks and Considerations
• Potential Decline: Morningstar analyst Jon Mills predicts a 38% decline in gold prices over the next five years, potentially falling to $1,820 per ounce, due to increased gold production and waning interest from central banks and investors. 
• Market Volatility: Gold’s status as a safe-haven asset makes it susceptible to sharp price swings in response to economic data releases, central bank decisions, and geopolitical developments.
For more updates follow my profile and share your thoughts.

Lingrid | SOLUSDT Consolidation After KEY Resistance BreakThe price perfectly fulfilled my previous idea . BINANCE:SOLUSDT market has effectively bounced off the support level and continues moving higher. The price has established a significant swap zone around the 135.00 level, where it has repeatedly found resistance or support in previous tests.
Recently, the market broke and closed above the 140.00 resistance zone, and following this breakout, the market has entered a consolidation phase, suggesting it may continue moving sideways in the near term. However, if the price pulls back toward the established swap zone, we can anticipate continuation of the current bullish trend. This consolidation pattern following a resistance break often signals strengthening market conviction before the next meaningful advance. My goal is resistance zone around 165.00
Traders, if you liked this idea or if you have your own opinion about it, write in the comments. I will be glad 👩💻

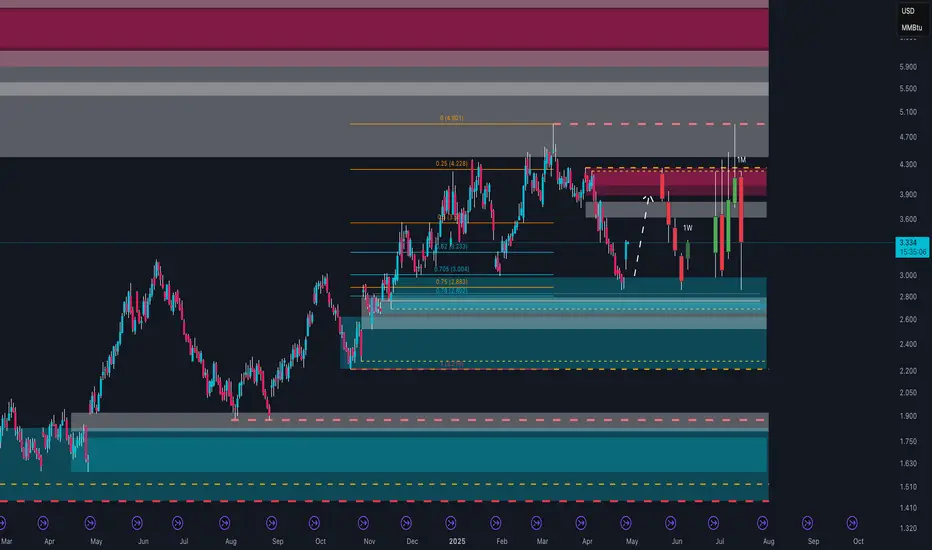
Natural Gas Ready to Explode?In recent months, Natural Gas (NG1!) has shown significant volatility, but now there are clear signals suggesting a major directional move could be imminent.
On the weekly technical chart, price has bounced from a strong demand zone between 2.50 and 2.70 USD/MMBtu, an area historically defended by institutional players. Currently, it is trading above 3.30 USD, consolidating in preparation for the next move. Key resistance zones to watch are between 3.90 and 4.20 USD, a region of high volume confluence and institutional supply.
Retail sentiment is extremely interesting: over 75% of retail traders are currently long. Historically, an excess of retail longs often leads to either corrections or accumulation/distribution phases, as large players tend to act against the majority.
Looking at the COT Report, the data supports the bullish thesis: non-commercials (speculative funds) remain net short, while commercials (physical operators) are increasing their long positions, indicating expectations of higher real demand in the medium term. This is a historically bullish signal, although it may not materialize immediately: commercials often start accumulating well before price movements occur.
Finally, seasonality favors the bulls: historically, from late April through mid-June, Natural Gas tends to perform positively, fueled by storage accumulation ahead of summer and the following winter season.
Strategically, a consolidation phase above 2.90–3.00 USD could serve as a base for larger moves towards 3.90 and eventually 4.90 USD, with the bullish scenario invalidated only below the 2.80 USD area.
AUD_USD GROWTH AHEAD|LONG|
✅AUD_USD is trading in an
Uptrend and the pair is
Consolidating above the
Horizontal support level
Around 0.6371 and we are
Already seeing a bullish
Rebound from the level
So we are bullish biased
And we will be expecting
The pair to go further
Up this week
LONG🚀
✅Like and subscribe to never miss a new idea!✅
Disclosure: I am part of Trade Nation's Influencer program and receive a monthly fee for using their TradingView charts in my analysis.

GOLD accumulate as the market lacks major fundamental impactSpot OANDA:XAUUSD moved significantly in early morning trading on Tuesday (April 29) and is currently trading at $3,315/oz, down 0.87% on the day at the time of writing.
OANDA:XAUUSD reversed losses on Monday and rebounded, having earlier dipped to around $3,268. The US Dollar (Dxy) fell broadly on Monday, supporting gold as investors cautiously awaited more news on US trade policy and braced for a week of in-depth economic data that could provide early indications of whether US President Trump’s trade war is having an impact.
The U.S. Dollar Index TVC:DXY fell 0.7% on Monday to close at 98.91, its lowest close in four trading days. The DXY has fallen 4.89% in April and is set to post its biggest monthly decline since July last year as Trump has shaken confidence in the reliability of U.S. assets.
A majority of economists polled by Reuters see a high risk of a global recession this year, with many saying that U.S. President Donald Trump’s tariffs have hurt business confidence. Bessant said on Monday that major U.S. trading partners have made “very good” proposals to avoid U.S. tariffs and one of the first deals to be signed would likely be with India.
Fed officials, including Chairman Jerome Powell, have said they are ready to cut rates if risks to economic growth become clear. But most officials appear to want to determine the impact of Trump’s tariffs on real economic indicators like inflation and employment before taking action.
This week, the US will also release first-quarter GDP data and the Fed's preferred inflation measure, core PCE, while Europe will also release preliminary GDP and inflation data.
Investors are also awaiting the US April jobs report on Friday, which is expected to show that employment is still growing, albeit at a much slower pace than a month ago.
Investors will also pay attention to the US JOLT jobs data for March and the second round of US-Japan tariff talks, due out today.
Technical Outlook Analysis OANDA:XAUUSD
On the daily chart, gold continues to move sideways as there is no fundamental impact big enough to break the structure to create a short-term trend. But in terms of position, gold is currently likely to decline as the RSI is pointing down quite far from 50, 50 in this case acts as the nearest target support indicating that there is still room for downside ahead in the short term.
However, in the overall picture, gold is still trending up mainly due to supporting factors such as the trending price channel as the main trend, the main support from EMA21 and as long as gold is above EMA21, in/above the price channel, it is still in the main uptrend, the declines should only be considered as short-term corrections or a buying opportunity.
During the day, gold is expected to accumulate with the main uptrend, the notable positions will be listed as follows.
Support: 3,292 – 3,267 – 3,245 USD
Resistance: 3,371 USD
SELL XAUUSD PRICE 3382 - 3380⚡️
↠↠ Stop Loss 3386
→Take Profit 1 3374
↨
→Take Profit 2 3368
BUY XAUUSD PRICE 3287 - 3289⚡️
↠↠ Stop Loss 3283
→Take Profit 1 3295
↨
→Take Profit 2 3301

XAUUSD: Massive Volatility, Weak Support at 3270!Last week was extremely volatile for Gold, with incredible swings that caught many traders off-guard. After reaching a new all-time high at 3500, the price dropped by more than 2000 pips in less than 24 hours!
After this crash, the market settled somewhat, and towards the end of the week, Gold established a strong ceiling around 3370 – exactly as we discussed in last week's analysis.
The key question now: Is the correction over or is there more downside coming?
At the same time, we can clearly observe a floor around 3270, a level that Gold is testing again at the time of writing.
Here’s why I believe the correction is not over yet:
- Price action remains vulnerable below 3370 resistance.
- The support at 3270 looks fragile, with pressure building for a break.
- Market volatility is still extremely high, favoring continuation moves.
Trading Plan:
I am looking to sell rallies above 3300, aiming for a target around 3200.
Due to the recent wild volatility, I will adjust my stop losses accordingly, allowing enough room for noise without exposing the position to unnecessary risk.
Disclosure: I am part of Trade Nation's Influencer program and receive a monthly fee for using their TradingView charts in my analyses and educational articles.

GBP_CAD BULLISH BREAKOUT|LONG|
✅GBP_CA D made a bullish
Breakout of the falling
Resistance and the breakout
Is confirmed so we are bullish
Biased and after a potential
Pullback we will be expecting
A further bullish move up
LONG🚀
✅Like and subscribe to never miss a new idea!✅
Disclosure: I am part of Trade Nation's Influencer program and receive a monthly fee for using their TradingView charts in my analysis.

GBP-NZD Resistance Ahead! Sell!
Hello,Traders!
GBP-NZD went up sharply
From the support cluster
Below just as I predicted
But now the pair is about
To retest a horizontal resistance
Around 2.2620 from where
A local bearish correction
Will be expected
Sell!
Comment and subscribe to help us grow!
Check out other forecasts below too!
Disclosure: I am part of Trade Nation's Influencer program and receive a monthly fee for using their TradingView charts in my analysis.

AUD-USD Will Keep Growing! Buy!
Hello,Traders!
AUD-USD started the trading
Week with a strong bullish
Move up from the horizontal
Support of 0.6371 while trading
In an uptrend so we are bullish
Biased mid-term and we will
Be expecting a further bullish
Continuation, but its best to
Wait and see how the price
Interacts with the local
Key level of 0.6439 as
We might see a local
Pullback from this supply
Area giving us a better
Entry price for the long
Buy!
Comment and subscribe to help us grow!
Check out other forecasts below too!
Disclosure: I am part of Trade Nation's Influencer program and receive a monthly fee for using their TradingView charts in my analysis.
