Lingrid | GOLD Weekly OUTLOOK: Poised for BULLISH ReversalOANDA:XAUUSD market has retraced approximately 50% of the previous month's range and is approaching the critical golden zone at the 61.8% Fibonacci retracement level. After experiencing such strong bullish momentum, we've now witnessed two consecutive red weeks, suggesting a potential reversal point.
Price is currently testing the previous resistance zone, which has now established itself as support—a classic market structure confirmation. The formation of equal weekly lows beneath current price levels represents significant liquidity that could fuel an upward move.
Furthermore, the price action appears to be completing an ABC pullback pattern, which typically precedes trend continuation. This bullish outlook is further reinforced by the emergence of a falling wedge pattern, a technical formation that frequently resolves to the upside.
Overall, I expect prices to move higher in the coming week, potentially catalyzed by the upcoming Federal Funds Rate decision, which could provide the fundamental backdrop for the next leg up in gold's price trajectory.
Traders, if you liked this idea or if you have your own opinion about it, write in the comments. I will be glad 👩💻
Signalsprovider

Gold Bear Flag in Play – More Downside Ahead?Last week was a strong one for Gold bears, with price dropping sharply and reaching a low near the 3200 mark.
A normal recovery followed, but the bounce is now facing pressure below the 3270 level – a former support that has now turned into resistance.
Current price action is forming a bear flag, a classic continuation pattern. If we get a break back below 3250, this could trigger a new leg down, targeting the 3170 support zone.
My outlook remains bearish, and I’m continuing to sell rallies into resistance, expecting this bear flag to resolve to the downside.
Disclosure: I am part of Trade Nation's Influencer program and receive a monthly fee for using their TradingView charts in my analyses and educational articles.

Ethereum is Nearing The Daily TrendHey Traders, in today's trading session we are monitoring ETH/USDT for a selling opportunity around 2,000 zone, Ethereum is trading a downtrend and currently is in a correction phase in which it is approaching the trend at 2,000 support and resistance area.
Trade safe, Joe.

FARTCOIN Breakout and Potential RetraceHey Traders, in today's trading session we are monitoring FARTCOIN for a selling opportunity around 1.1650 zone, FARTCOIN was trading in an uptrend and successfully managed to break it out. Currently is in a correction phase in which it is approaching the retrace area at 1.1650 support and resistance zone.
Trade safe, Joe.

Bitcoin Potential UpsidesHey Traders, in today's trading session we are monitoring Bitcoin for a buying opportunity around 95,000 zone, Bitcoin is trading in an uptrend and currently is in a correction phase in which it is approaching the trend at 95,000 support and resistance area.
Trade safe, Joe.

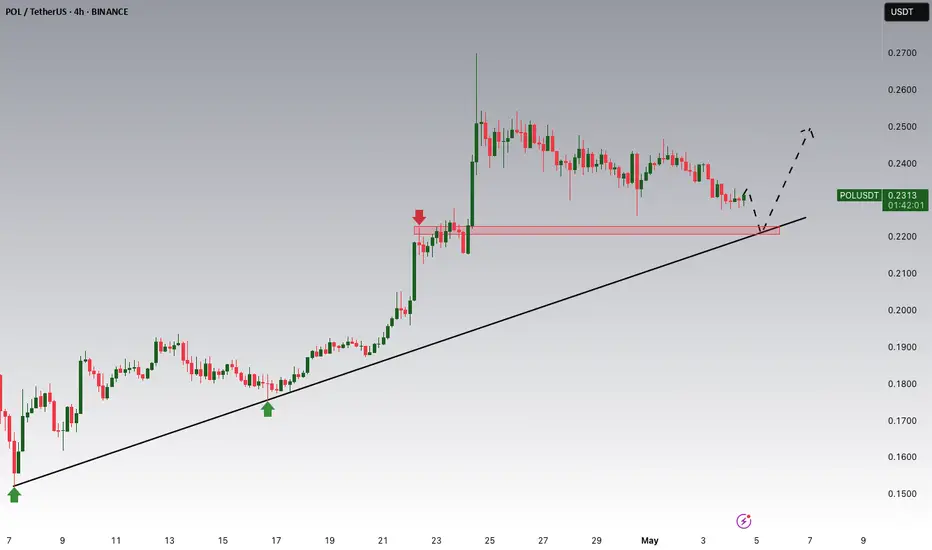
POLUSDT Potential UpsidesHey Traders, in today's trading session we are monitoring POLUSDT for a buying opportunity around 0.2220 zone, POLUSDT is trading in an uptrend and currently is in a correction phase in which it is approaching the trend at 0.2220 support and resistance area.
Trade safe, Joe.
Lingrid | ARBUSDT potential BREAKOUT. Long from SUPPORT zoneThe price perfectly fulfilled my previous idea . BINANCE:ARBUSDT is moving inside a clean upward channel, currently pulling back toward the 0.3175 support and trend-line after rejecting from the 0.3627 resistance. If buyers step in around trend-line support, the bullish structure could continue, pushing price back toward the top of the range.
📈 Key Levels
Buy zone: 0.3175 – 0.3200
Buy trigger: bounce from trend-line
Target: 0.3627
Sell trigger: break and hold below 0.3175
💡 Risks
Flag breakdown or failure at support may push price lower.
Loss of trend-line = structure invalidation.
Market-wide pullbacks could pressure ARB even with strong setup.
Traders, if you liked this idea or if you have your own opinion about it, write in the comments. I will be glad 👩💻

GBPUSD Potential DownsidesHey Traders, in today's trading session we are monitoring GBPUSD for a selling opportunity around 1.33300 zone, GBPUSD is trading in a downtrend and currently is in a correction phase in which it is approaching the trend at 1.33300 support and resistance area.
Trade safe, Joe.

Ripple potential UpsidesHey Traders, in today's trading session we are monitoring XRPUSDT for a buying opportunity around 2.13 zone, XRPUSDT is trading in an uptrend and currently is in a correction phase in which it is approaching the trend at 2.13 support and resistance area.
Trade safe, Joe.

Stromm | GOLD Bullish Continuation in PlayIt’s good to see Gold OANDA:XAUUSD getting the attention it deserves again. But honestly, the performance it’s putting in right now is just insane.
If you zoom into the 4-hour chart, you’ll spot a clear Demand Continuation Pattern:
Rally → Base → Rally.
In simple terms: strong move up, sideways consolidation, strong move up again.
The first rally pushed Gold up 9.77% within a few days, followed by a sideways base, and then another 9.6% rally straight into the $3,500 mark.
With commodities like Gold, you really feel how powerful psychological levels are — $3,000, $3,500, $4,000 — all massive magnet zones where large investors naturally look to take profits.
Now, after tagging $3,500, we’ve pulled back.
If this Demand Continuation structure holds, here's how I see it playing out:
Inside the current base, there’s a 4-hour order block, and it’s the one I’m watching most closely.
Ideally, we get a push up into the 4h Balance Price Range between $3,336–$3,347, followed by a rejection that sweeps the Previous Weekly Low, tagging that 4h order block for a proper retest.
From there, a move toward the 8h Balance Price Range would be good.
Now, two possibilities:
Best case for bears: After retesting that 4h zone, we fall further — possibly targeting $3,050.
Sneaky scenario: We fake a drop to trigger stop-losses, push back up toward $3,510, then properly roll over.
On the monthly chart, it gets even more interesting:
Given the massive rejection off $3,500, I wouldn’t rule out a much deeper retracement toward $2,500–$2,000 before Gold makes another serious attempt at $4,000.
That would perfectly fit into a larger Elliott Wave structure, completing a Wave 3 or setting up a Wave 5 push later.
(And yes — catching a Wave 3 top is brutal — especially when it is an all-time high)
Unless geopolitical events massively change the landscape, it feels like $3,500 is a strong local top — for now.
But if the world starts burning again?
Gold might have other plans.

Lingrid | GOLD trendline BREAKOUT: Short-Term BEARISH MoveOANDA:XAUUSD made a strong bullish run, but after reaching the top near 3500, the price entered a sideways range and recently broke below the upward trend-line. Now it’s retesting the 3,283–3,300 zone, which may act as resistance. If price fails here, we could see a drop back to the 3,150 support area. Bulls will need a solid recovery above 3,300 to regain control.
📈 Key Levels
Sell zone: 3,283 – 3,300
Sell trigger: rejection from retest area
Target: 3,150
Buy trigger: strong breakout and hold above 3,300
💡 Risks
Gold is sensitive to US macro data this week (FOMC, NFP, PCE).
Retest of the trend-line might trigger volatility and fakeouts.
Break above 3,300 could invalidate the bearish scenario.
Traders, if you liked this idea or if you have your own opinion about it, write in the comments. I will be glad 👩💻

Lingrid | EURAUD sideways MOVEMENT. Double bottomThe price perfectly fulfilled my previous idea . FX:EURAUD is trading near a major support zone around 1.7590, where the price just formed a double bottom pattern. After rejecting the upward trend-line, the pair is attempting to stabilize. If buyers hold this level, a move toward the 1.7750 resistance could follow. The overall structure shows potential for a short-term bounce.
📈 Key Levels
Buy zone: 1.7590 – 1.7600
Buy trigger: confirmation of double bottom bounce
Target: 1.7750
Sell trigger: break and close below 1.7590
💡 Risks
Rejection from 1.7750 may keep the pair stuck in a wide range.
AUD strength from commodities or China news can pressure the pair.
Wait for breakout or bounce confirmation — false moves likely around lows.
Traders, if you liked this idea or if you have your own opinion about it, write in the comments. I will be glad 👩💻

Lingrid | ETHUSDT Trend Continuation Pattern. Potential LongBINANCE:ETHUSDT is consolidating inside an upward channel, holding just above the 1,757 support and the upward trend-line. After reaching a higher high near the channel top, price pulled back but remains within structure. If the trend-line holds, a rebound toward the 1,990 resistance looks likely. The bullish setup remains valid while price trades above the trend-line.
📈 Key Levels
Buy zone: 1,750 – 1,760
Buy trigger: bounce from trend-line
Target: 1,990
Sell trigger: break below 1,750
💡 Risks
If ETH loses trend-line support, momentum could flip to bearish.
Volatility from BTC or macro events may trigger false moves.
Watch for breakout above consolidation highs for early confirmation.
Traders, if you liked this idea or if you have your own opinion about it, write in the comments. I will be glad 👩💻

GBPJPY: Consolidation Phase Targeting the Main TrendHey Traders, in today's trading session we are monitoring GBPJPY for a buying opportunity around 189.600 zone, GBPJPY is trading in an uptrend and currently is in a correction phase in which it is approaching the trend at 189.600 support and resistance area.
Trade safe, Joe.

RIOT Platforms Options Ahead of EarningsIf you haven`t bought RIOT before the previous earnings:
Now analyzing the options chain and the chart patterns of RIOT Platforms to the earnings report this week,
I would consider purchasing the 12usd strike price Calls with
an expiration date of 2026-3-20,
for a premium of approximately $1.35.
If these options prove to be profitable prior to the earnings release, I would sell at least half of them.
Disclosure: I am part of Trade Nation's Influencer program and receive a monthly fee for using their TradingView charts in my analysis.

EURUSD is Trading Under the Pressure of a Strong DollarHey traders, in today's trading session we are monitoring EURUSD for a selling opportunity around 1.13500 zone, EURUSD is trading in a downtrend and currently is in a correction phase in which it is approaching the trend at 1.13500 support and resistance area.
Trade safe, Joe.

USDCHF Potential UpsidesHey Traders, in today's trading session we are monitoring USDCHF for a buying opportunity around 0.82700 zone, USDCHF is trading in an uptrend and currently is in a correction phase in which it is approaching the trend at 0.82700 support and resistance area.
Trade safe, Joe.

Lingrid | TONUSDT pullback Approaching Psychological LevelThe price perfectly fulfilled my last idea . It reached the target. OKX:TONUSDT is pulling back after testing the upper resistance area near 3.40. Price is now moving toward a key support zone around 3.00, where the downward trend-line intersects horizontal structure. If bulls defend this level, the chart suggests a possible bounce back toward 3.25. The bullish scenario remains active as long as the trend-line holds.
📈 Key Levels
Buy zone: 3.03 – 3.06
Buy trigger: bounce from trend-line support
Target: 3.25
Sell trigger: break below 3.03
💡 Risks
Loss of 3.03 could lead to a drop toward the 2.78 support.
If the bounce lacks volume, recovery may be weak.
Watch for fakeouts near the trend-line—confirmation is key.
Traders, if you liked this idea or if you have your own opinion about it, write in the comments. I will be glad 👩💻

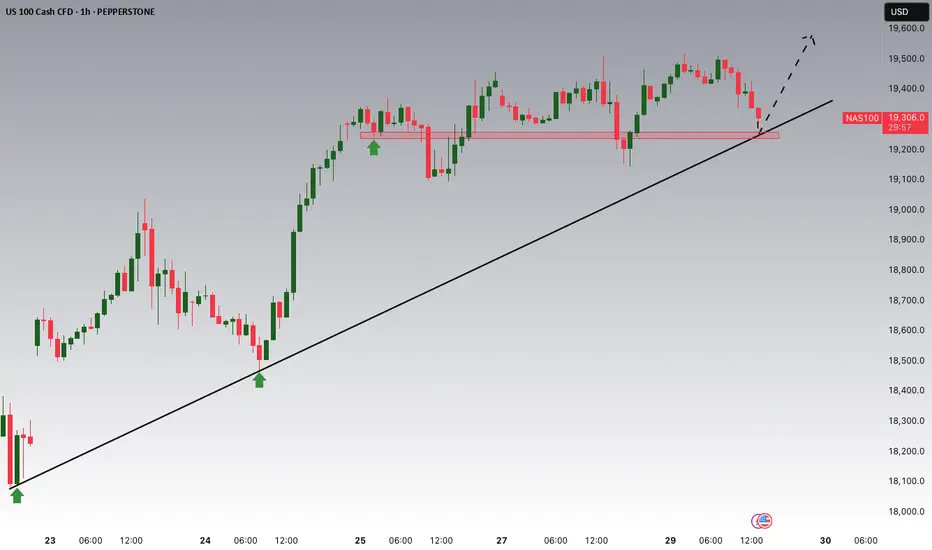
NASDAQ Potential UpsidesHey Traders, in today's trading session we are monitoring NAS100 for a buying opportunity around 19250 zone, NASDAQ is trading in an uptrend and currently is in a correction phase in which it is approaching the trend at 19250 support and resistance area.
Trade safe, Joe.
Lingrid | AUDCHF trend Continuation Pattern. Long The price perfectly fulfilled my last idea . It hit the target zone. FX:AUDCHF is holding above the upward trend-line, forming a series of higher lows after the recent flag pattern correction. The price is consolidating above support at 0.5265 and may soon bounce from this area to resume its bullish leg. As long as buyers protect the trend-line, the structure stays bullish with eyes on the 0.5337 resistance.
📈 Key Levels
Buy zone: 0.5265 – 0.5270
Buy trigger: bounce from trend-line
Target: 0.5337
Sell trigger: break below 0.5265
💡 Risks
Break below the trend-line could shift the short-term bias to bearish.
Watch for false breaks or low-volume bounces — confirmation is key.
Volatility may increase around CHF news or cross-pair flows.
Traders, if you liked this idea or if you have your own opinion about it, write in the comments. I will be glad 👩💻

Lingrid | DOGEUSDT Potential LONG on Pullback to SWAP ZoneThe price perfectly fulfilled my last idea . It reached the target. After a strong rally and fake breakout above the resistance near 0.1915, BINANCE:DOGEUSDT is now pulling back and trading inside a sideways range. Price is heading toward the 0.1700–0.1710 support area, which aligns with the upward trend-line. If bulls hold this zone, a rebound toward 0.1850 looks likely. As long as price stays above the trend-line, bullish structure remains valid.
📈 Key Levels
Buy zone: 0.1700 – 0.1710
Buy trigger: bounce from trend-line
Target: 0.1850
Sell trigger: break below 0.1700
💡 Risks
If price breaks below 0.1700, it may open the way toward deeper support.
Sudden spikes in Bitcoin or market-wide sentiment shifts can shake the setup.
Lower timeframe volatility near trend-line could trap early entries.
Traders, if you liked this idea or if you have your own opinion about it, write in the comments. I will be glad 👩💻

DXY Ready to Pop – Watch That 100 Break!After breaking below the key psychological level at 100 and making a low just under 98, the Dollar Index ( TVC:DXY ) has entered a consolidation phase.
Over the past three weeks, price has developed an inverted head and shoulders pattern, with the neckline perfectly aligning with the horizontal resistance at 100 — a strong zone of confluence from both a technical and psychological standpoint.
Despite the current hesitation under resistance, the structure suggests bullish potential. I believe we are approaching a breakout above 100, and once that happens, an acceleration to the upside is likely to follow.
🎯 Target: 102
🔒 Invalidation: A break below 98 would cancel the bullish bias.
As long as the price stays above the 98 area, I remain bullish and expect the dollar to strengthen.
🚀 The breakout hasn’t happened yet — but the pressure is building.

Lingrid | GBPCAD bullish BREAKOUT with Short-Term PullbackThe price has perfectly followed my previous analysis . Recently, the FX:GBPCAD price broke and closed above the previous week's high and the psychological level at 1.85000. Following this significant breakout, the market is pulling back toward the support level, trendline, and triangle pattern. If the market remains above this support zone, the chance of continuation is high. I expect the price to reject this level and rebound, following with continuation toward the next resistance zone. This price action demonstrates classic market behavior following a key breakout, where a retest of former resistance as new support often provides an optimal entry point for traders aligned with the prevailing trend direction. My goal is resistance zone around 1.86510
Traders, if you liked this idea or if you have your own opinion about it, write in the comments. I will be glad 👩💻
