Bitcoin - Bulls vs Bears: 88k or 100k?Bitcoin has broken through the 4H imbalance zone that also acted as an old resistance area. The break came through a clear displacement candle, which showed strong intent from the market. That same move left behind a new gap just under the previous resistance. Although price already retested that area once, it didn’t fully fill the gap, so we could see one more retest to complete the 50% line before the market chooses direction.
Consolidation Structure
The range before the breakout was clean, with multiple rejections from the resistance zone. That zone was front-run several times, then finally broken with conviction. Now, price is hovering just under that broken level, and the new gap created by the displacement candle is still fresh and technically unfilled.
Below current price, there’s a large inefficiency sitting between 88.2k and 90k. This zone stands out because it’s not only a clean 4H imbalance, but it also aligns with the golden pocket retracement from the last major leg up. That type of confluence usually attracts liquidity, especially if price gets rejected from the gap above and starts moving lower.
Bullish/Bearish Scenarios
The bullish scenario would play out if price manages to reclaim the gap zone, pushes back above the resistance cleanly, and treats the gap as support. That would be a classic structure flip, where the previous resistance becomes a new base, and the gap gets inverted into a continuation zone. If we see that, the next upside targets would sit around the 96k to 97k area, where more liquidity is likely resting.
On the other hand, if price moves into the gap and gets rejected again, that confirms sellers are still active at that level. In that case, I’d expect the market to push down and start filling the inefficiencies below. The 88.2k to 90k area becomes the primary draw. It’s packed with confluence from the 4H imbalance and the golden pocket, and it also lines up with previous demand zones. If price reaches into that area, it could trigger a strong reaction and potentially form the next higher low.
Price Target and Expectations
If we see rejection from the current gap, the target shifts to the 88.2k to 90k zone. That’s where I’ll be watching for bullish signs, since it’s the type of level where buyers often step in. A clean reaction there could be the start of a new leg higher. But if the market doesn’t get that low, and instead pushes up through the resistance, then the bullish breakout scenario is active, and we’d be aiming higher toward the 96k range or even the 100k.
Current Stance
Right now, I’m in reactive mode. The trade will depend on what happens at the gap zone. If we get another rejection from it, I’ll look for a move into the golden pocket below. If we reclaim the gap and break resistance, I’ll be looking to enter on confirmation of the flip. No trade from the middle, only once price gives clear direction from either key level.
Conclusion
This is a clean two-scenario setup. Either price fills the remaining gap and flips resistance, triggering the bullish continuation, or we reject from that area again and drop into the 88.2k to 90k range for a deeper liquidity grab. Both are valid, and both offer high-probability trades once price confirms the path.
___________________________________
Thanks for your support!
If you found this idea helpful or learned something new, drop a like 👍 and leave a comment, I’d love to hear your thoughts! 🚀
Make sure to follow me for more price action insights, free indicators, and trading strategies. Let’s grow and trade smarter together! 📈
Smartmoneyconcept

USD_CAD WILL GO DOWN|SHORT|
✅USD_CAD is consolidating
Beneath the horizontal resistance
Of 1.3862 so we are bearish
Biased and we will be expecting
A further bearish move down
This trading week
SHORT🔥
✅Like and subscribe to never miss a new idea!✅
Disclosure: I am part of Trade Nation's Influencer program and receive a monthly fee for using their TradingView charts in my analysis.

EUR-AUD Strong Breakout! Sell!
Hello,Traders!
EUR-AUD made a bearish
Breakout of the rising support
Line and the breakout is
Confirmed so we will be
Expecting a further bearish
Move down on Monday
Sell!
Comment and subscribe to help us grow!
Check out other forecasts below too!
Disclosure: I am part of Trade Nation's Influencer program and receive a monthly fee for using their TradingView charts in my analysis.

DAX Correction Ahead! Sell!
Hello,Traders!
DAX is trading in a strong
Uptrend but the index is
Locally overbought so after
The retest we will be expecting
A local pullback and a
Bearish correction
Sell!
Comment and subscribe to help us grow!
Check out other forecasts below too!
Disclosure: I am part of Trade Nation's Influencer program and receive a monthly fee for using their TradingView charts in my analysis.

BITCOIN Support Ahead! Buy!
Hello,Traders!
BITCOIN is trading in an
Uptrend but is making a
Local bearish correction
However, a horizontal
Support level is ahead
Around 92,191$ so after
The retest we will be expecting
A local bullish rebound
And a move up
Buy!
Comment and subscribe to help us grow!
Check out other forecasts below too!
Disclosure: I am part of Trade Nation's Influencer program and receive a monthly fee for using their TradingView charts in my analysis.

GBP_NZD LONG SIGNAL|
✅GBP_NZD is going down
To retest a horizontal support
Level of 2.2200 so after the
Retest we can enter a long
Trade with the TP of 2.2459
And the SL of 2.2132
LONG🚀
✅Like and subscribe to never miss a new idea!✅
Disclosure: I am part of Trade Nation's Influencer program and receive a monthly fee for using their TradingView charts in my analysis.

USDJPY Technical Outlook: SMC and Wyckoff Analysis 5 May 2025As of May 5, 2025, the USDJPY pair is trading around ¥144.30, reflecting a 0.40% decrease from the previous session. This movement follows the Bank of Japan's decision to maintain interest rates while revising growth forecasts downward, leading to a depreciation of the yen.
Technical Analysis:
Support and Resistance Levels: The pair is approaching a significant support zone near ¥143.00. A break below this level could expose the next support at ¥141.00, while resistance is observed around ¥148.00.
Relative Strength Index (RSI): The RSI is nearing oversold territory, suggesting potential for a short-term rebound.
Smart Money Concepts:
Order Blocks: A bullish order block is identified between ¥142.50 and ¥143.00, indicating potential institutional buying interest.
Liquidity Pools: Liquidity above the recent highs near ¥148.00 may attract price action if bullish momentum resumes.
Wyckoff Method Perspective:
Accumulation Phase: The recent price action suggests a possible accumulation phase, with the pair trading within a range between ¥140.00 and ¥146.00.
Spring Test: A false breakout below ¥143.00 could serve as a spring, leading to potentially high buying volume.
Fundamental Factors:
Bank of Japan (BOJ) Policy: The BOJ's decision to keep rates unchanged, despite lowering growth forecasts, has contributed to yen weakness.
Federal Reserve Outlook: Market participants are closely watching the ISM Services PMI later today and the upcoming FOMC meeting for signals on US monetary policy, which could impact USDJPY dynamics.
Conclusion:
The USDJPY pair is at a critical juncture, with technical indicators pointing to potential support near ¥143.00. Traders should monitor price action around this level for signs of accumulation or further downside. Fundamental developments, particularly central bank policies, will play a crucial role in determining the pair's direction in the near term.

GBP-AUD Bearish Breakout! Sell!
Hello,Traders!
GBP-AUD made a bearish
Breakout of the key horizontal
Level of 2.0730 and the breakout
Is confirmed so we are
Bearish biased and we will
Be expecting a further
Move down on Monday
Sell!
Comment and subscribe to help us grow!
Check out other forecasts below too!
Disclosure: I am part of Trade Nation's Influencer program and receive a monthly fee for using their TradingView charts in my analysis.

AUD-JPY Risky Short! Sell!
Hello,Traders!
AUD-JPY went up and hit
A horizontal supply area
Around 93.597 from where
We are already seeing a local
Bearish pullback so we are
Bearish biased and we will
Be expecting a local
Bearish correction
Buy!
Comment and subscribe to help us grow!
Check out other forecasts below too!
Disclosure: I am part of Trade Nation's Influencer program and receive a monthly fee for using their TradingView charts in my analysis.

GBP_USD POTENTIAL LONG|
✅GBP_USD fell again to retest the support of 1.3200
But it is a strong key level
So I think that there is a high chance
We will see a bullish rebound and a move up
LONG🚀
✅Like and subscribe to never miss a new idea!✅
Disclosure: I am part of Trade Nation's Influencer program and receive a monthly fee for using their TradingView charts in my analysis.

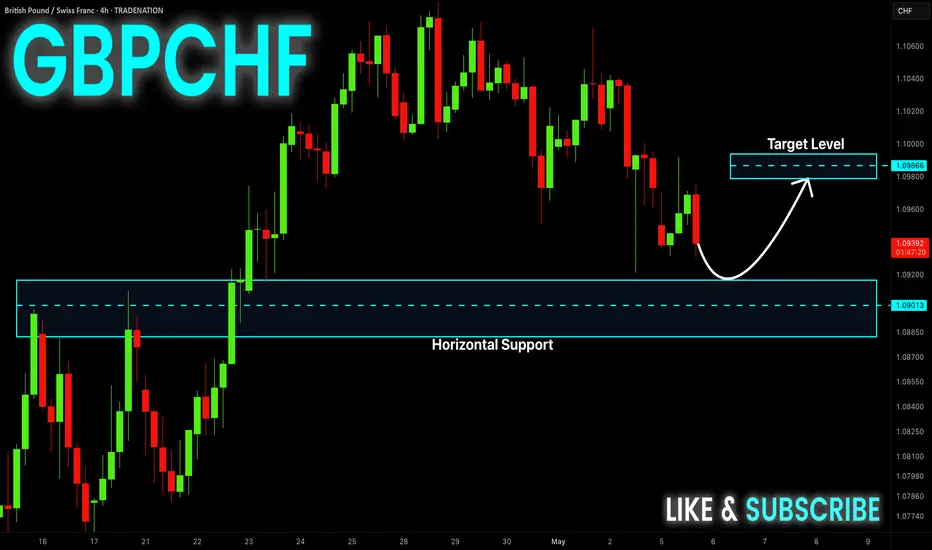
GBP-CHF Local Long! Buy!
Hello,Traders!
GBP-CHF is going down
Now but the pair is close
To the horizontal support
Level of 1.0901 already so
After the retest we will be
Expecting a local bullish rebound
Buy!
Comment and subscribe to help us grow!
Check out other forecasts below too!
Disclosure: I am part of Trade Nation's Influencer program and receive a monthly fee for using their TradingView charts in my analysis.
GBP-USD Local Long! Buy!
Hello,Traders!
GBP-USD is making a local
Correction but the pair will
Soon hit a horizontal support
Level of 1.3204 and as the pair
Is in the uptrend we will be
Expecting a local bullish
Rebound and a move up
Buy!
Comment and subscribe to help us grow!
Check out other forecasts below too!
Disclosure: I am part of Trade Nation's Influencer program and receive a monthly fee for using their TradingView charts in my analysis.

EUR_AUD BEARISH BREAKOUT|SHORT|
✅EUR_AUD was trading along
The rising support but now
It is broken and the breakout
Is confirmed so we are bearish
Biased and we will be expecting
A further bearish move down
On Monday after a potential
Local pullback
SHORT🔥
✅Like and subscribe to never miss a new idea!✅
Disclosure: I am part of Trade Nation's Influencer program and receive a monthly fee for using their TradingView charts in my analysis.

NATGAS SWING SHORT|
✅NATGAS has been growing recently
And Gas seems locally overbought
So as the pair is approaching a
Horizontal resistance of 3.80$
Price decline is to be expected
SHORT🔥
✅Like and subscribe to never miss a new idea!✅
Disclosure: I am part of Trade Nation's Influencer program and receive a monthly fee for using their TradingView charts in my analysis.

NZD_JPY WILL GO UP|LONG|
✅NZD_JPY keeps growing and
The pair made a bullish
Breakout of the falling
Resistance then made a
Local pullback so we are
Bullish biased and we will
Be expecting a further
Bullish continuation
And a move up
LONG🚀
✅Like and subscribe to never miss a new idea!✅
Disclosure: I am part of Trade Nation's Influencer program and receive a monthly fee for using their TradingView charts in my analysis.

AUD-CAD Correction Ahead! Sell!
Hello,Traders!
AUD-CAD keeps going up
But the pair will soon hit
A horizontal resistance level
Around 0.8936 and as the
Pair is locally overbought
We will be expecting a
Pullback and a local
Bearish correction
Sell!
Comment and subscribe to help us grow!
Check out other forecasts below too!
Disclosure: I am part of Trade Nation's Influencer program and receive a monthly fee for using their TradingView charts in my analysis.

US100 – Bullish Continuation Setting Up Inside the ChannelUS100 remains firmly bullish, showing consistent strength after breaking out from the prior consolidation range in mid-April. Price action has been moving cleanly within a well-defined ascending channel, supported by strong impulsive moves followed by shallow retracements. Each pullback so far has been relatively controlled, and buyers have been stepping in aggressively from clearly defined zones, which aligns with the current risk-on sentiment across tech-heavy indices.
Consolidation Structure
We’ve now had two solid retests of prior fair value gaps (FVGs), both of which acted as demand zones and helped fuel continuation. The first pullback dropped into a previously formed imbalance, consolidated briefly, and then launched a strong bullish leg. The second did the same, creating a layered structure of bullish continuation through efficient retracements. Each of these reactions confirms that price is respecting areas where institutional orders may have been left behind, which adds confluence to the trend’s strength.
Currently, price is working on forming a third FVG within the upper half of the channel. This is developing just below recent highs and has not yet been retested, which makes it a key area of interest. If the market pulls back into that imbalance with proper structure, it could offer the next high-probability opportunity to join the trend.
Bullish Scenario
If price retraces into this newly forming FVG and holds, especially with a wick or lower timeframe rejection candle inside the zone, it could mark the start of the next impulse. The overall trend remains intact as long as we stay within the channel and each FVG continues to serve as valid support. Given the strength of the previous bounces and the orderly nature of this structure, any retest into this new FVG would likely lead to another push into fresh highs and a move toward the upper boundary of the channel.
Bearish Scenario
On the flip side, if price fails to respect this new FVG and breaks below with momentum, especially if the channel support fails at the same time, it would be a sign that buyers are losing control. In that case, we’d want to see how price interacts with the last confirmed FVG below before making any bearish assumptions. A deeper pullback into that area could still provide another long opportunity if structure holds, but any sharp momentum break through both imbalances would put the bullish trend on pause and shift focus to downside levels.
Price Target and Expectations
Assuming the bullish structure continues to play out, the next projected move would be a clean rally toward the top of the channel. There’s enough space left between current levels and the upper trendline to justify an entry on the next pullback, provided it lands inside the newly created FVG. The setup is fairly straightforward, let price come back into the imbalance, confirm with lower timeframe strength, and ride the continuation leg.
Current Stance
There’s no need to chase price here. The best scenario is waiting for a patient retest of the fresh FVG forming now. If it pulls back cleanly, holds the zone, and gives confirmation, that would be the entry. Momentum, structure, and market context are all aligned for continuation, but the trade needs to be built off a level that shows actual commitment from buyers.
Conclusion
US100 is holding its bullish structure well, forming clean legs within an ascending channel, and repeatedly respecting fair value gaps as demand zones. With a new imbalance forming beneath the most recent high, the setup is shaping up for another continuation play if price rotates back and holds. It’s a wait-and-see moment for now, but if the FVG gets tagged and buyers show up, this could be the next leg higher in an already strong trend.
___________________________________
Thanks for your support!
If you found this idea helpful or learned something new, drop a like 👍 and leave a comment, I’d love to hear your thoughts! 🚀
Make sure to follow me for more price action insights, free indicators, and trading strategies. Let’s grow and trade smarter together! 📈

NATGAS Resistance Ahead! Sell!
Hello,Traders!
NATGAS is growing sharply
But the price is nearing a
Strong horizontal resistance
Around 3.80$ so after the
Retest on Monday we will be
Expecting a local bearish
Correction as Gas is already
Locally overbought
Sell!
Comment and subscribe to help us grow!
Check out other forecasts below too!
Disclosure: I am part of Trade Nation's Influencer program and receive a monthly fee for using their TradingView charts in my analysis.

GOLD WILL GO DOWN|SHORT|
✅GOLD is going down now
After a breakout a retest
A and a pullback from the
Key horizontal level
Of 3280$ so we are bearish
Biased and we will be expecting
A further bearish move down
SHORT🔥
✅Like and subscribe to never miss a new idea!✅
Disclosure: I am part of Trade Nation's Influencer program and receive a monthly fee for using their TradingView charts in my analysis.

AUD_CAD RESISTANCE AHEAD|SHORT|
✅AUD_CAD has been growing recently
And the pair seems locally overbought
So as the pair is approaching a horizontal resistance of 0.8950
Price decline is to be expected
SHORT🔥
✅Like and subscribe to never miss a new idea!✅
Disclosure: I am part of Trade Nation's Influencer program and receive a monthly fee for using their TradingView charts in my analysis.

NZD-JPY Swing Bullish Breakout! Buy!
Hello,Traders!
NZD-JPY is trading in an
Uptrend and the pair made
A bullish breakout of the
Falling resistance and the
Breakout is confirmed so
We are bullish biased and
We will be expecting a
Further bullish continuation
Buy!
Comment and subscribe to help us grow!
Check out other forecasts below too!
Disclosure: I am part of Trade Nation's Influencer program and receive a monthly fee for using their TradingView charts in my analysis.

GBP_AUD BEARISH BREAKOUT|SHORT|
✅GBP_AUD made a bearish
Breakout so we are bearish
Biased and we will be expecting
A local pullback and then a
Further bearish move down
SHORT🔥
✅Like and subscribe to never miss a new idea!✅
Disclosure: I am part of Trade Nation's Influencer program and receive a monthly fee for using their TradingView charts in my analysis.

EUR-CAD Will Keep Falling! Sell!
Hello,Traders!
EUR-CAD is going down
Now and the pair broke
The rising support line
Made a retest and is going
Down again now so we are
Bearish biased and we will
Be expecting a further
Bearish move down
Sell!
Comment and subscribe to help us grow!
Check out other forecasts below too!
Disclosure: I am part of Trade Nation's Influencer program and receive a monthly fee for using their TradingView charts in my analysis.
