USDJPY Long SetupUSDJPY Looks Bullish, Previous Day Candle Has closed above Friday Candle and we still have a LTH not taken i think today we will be bullish we might have a correction drop down to 0.25 or 0.5 of the previous day and continue higher
Smartmoneyconcept

AUD-NZD Free Signal! Buy!
Hello,Traders!
AUD-NZD has been falling
Recently and the pair is locally
Oversold so after it hits the
Horizontal support level
Of 1.0956 a long trade
Can be entered with the
TP of 1.0990 and SL of 1.0937
Buy!
Comment and subscribe to help us grow!
Check out other forecasts below too!
Disclosure: I am part of Trade Nation's Influencer program and receive a monthly fee for using their TradingView charts in my analysis.

GBP_AUD LONG SIGNAL|
✅GBP_AUD is moving down
Down now to retest a horizotnal
Support level of 2.0327 from
Where we can enter a long
Trade with the Take Profit
Of 2.0413 and SL of 2.0270
LONG🚀
✅Like and subscribe to never miss a new idea!✅
Disclosure: I am part of Trade Nation's Influencer program and receive a monthly fee for using their TradingView charts in my analysis.

EUR-CHF Bearish Wedge Pattern! Sell!
Hello,Traders!
EUR-CHF was trading in an
Uptrend but the pair has formed
A bearish wedge pattern so
IF we see a bearish breakout
From the wedge we will be
Expecting a bearish move down
Sell!
Comment and subscribe to help us grow!
Check out other forecasts below too!
Disclosure: I am part of Trade Nation's Influencer program and receive a monthly fee for using their TradingView charts in my analysis.

USD_CHF BEARISH BREAKOUT|SHORT|
✅USD_CHF is trading in a
Downtrend and we are seeing
A bearish breakout from the
Bearish wedge pattern which
Is why we are bearish biased and
We will be expecting the pair
To go further down
SHORT🔥
✅Like and subscribe to never miss a new idea!✅

USD-CAD Bearish Breakout! Sell!
Hello,Traders!
USD-CAD kept bouncing
Off of the horizontal support
Of 1.4355 but then it was
Finally broken and the breakout
Is Confirmed so we are locally
Bearish biased and we will be
Expecting the pair to go
Further down
Sell!
Comment and subscribe to help us grow!
Check out other forecasts below too!
Disclosure: I am part of Trade Nation's Influencer program and receive a monthly fee for using their TradingView charts in my analysis.

AUD_JPY RESISTANCE AHEAD|SHORT|
✅AUD_JPY is going up now
But a strong resistance level is ahead at 94.800
Thus I am expecting a pullback
And a move down towards the target at 94.093
SHORT🔥
✅Like and subscribe to never miss a new idea!✅

AMAZON SWING LONG FROM SUPPORT|LONG|
✅AMAZON fell again to retest the support of 190.79$
But it is a strong key level
So I think that there is a high chance
That we will see a bullish rebound and a move up
LONG🚀
✅Like and subscribe to never miss a new idea!✅
Disclosure: I am part of Trade Nation's Influencer program and receive a monthly fee for using their TradingView charts in my analysis.

Week of 3/16/25: EURUSD Analysis FIRST VIDEO PUBLISH!First video publish, testing out my recording but also giving my insights for the week ahead. The candle color looks a bit off but hopefully it can be fixed for the next publish.
Pardon the background noise in the first few seconds of the video.
Let me know how the quality and your thoughts/analysis as well!
Happy trading and have a great week traders, let's win.

GBP_NZD NEW LONG SIGNAL|
✅GBP_NZD is going down now
But a strong support level is ahead at 2.2454
Thus I am expecting a pullback
So we can prepare to enter
A long trade with the target 2.2562
And Stop Loss of 2.2406
LONG🚀
✅Like and subscribe to never miss a new idea!✅
Disclosure: I am part of Trade Nation's Influencer program and receive a monthly fee for using their TradingView charts in my analysis.

EUR-NZD Risky Long! Buy!
Hello,Traders!
EUR-NZD is approaching a
Horizontal support level
Of 1.8868 so after the
Retest of the support
A long trade with the
Target Level of 1.8947
And Stop Loss of 1.8851
Buy!
Comment and subscribe to help us grow!
Check out other forecasts below too!
Disclosure: I am part of Trade Nation's Influencer program and receive a monthly fee for using their TradingView charts in my analysis.

AUD-CHF Move Up Expected! Buy!
Hello,Traders!
AUD-CHF made a bullish
Breakout of the key horizontal
Level of 0.5576 and the
Breakout is confirmed
Because the daily candle
Closed above the key level
So on the market open
We will be expecting a
Local pullback and then
A strong move up
Buy!
Comment and subscribe to help us grow!
Check out other forecasts below too!
Disclosure: I am part of Trade Nation's Influencer program and receive a monthly fee for using their TradingView charts in my analysis.

EUR_AUD SUPPORT AHEAD|LONG|
✅EUR_AUD is making a bearish
Correction and will soon retest a
Key support level of 1.7100
While trading in a strong uptrend
So I think that the pair will make a rebound
And go up to retest the supply level above at 1.7260
LONG🚀
✅Like and subscribe to never miss a new idea!✅
Disclosure: I am part of Trade Nation's Influencer program and receive a monthly fee for using their TradingView charts in my analysis.

SILVER Swing Long! Buy!
Hello,Traders!
SILVER made a strong
Bullish brekaout and
The breakout is confirmed
As the daily candle closed above
The key horizontal level of 33.20$
So we are bullish biased
But we will fist expect some
Correction on Monday
With the potential retest
Of the new support level
From where we believe
Growth will continue
Buy!
Comment and subscribe to help us grow!
Check out other forecasts below too!
Disclosure: I am part of Trade Nation's Influencer program and receive a monthly fee for using their TradingView charts in my analysis.

EUR_NZD LONG SIGNAL|
✅EUR_NZD is going down now
But a strong support level is ahead at 1.8902
So after the retest on Monday we can
Enter a long trade with the target of 189640
And a Stop Loss of 1.8866
LONG🚀
✅Like and subscribe to never miss a new idea!✅
Disclosure: I am part of Trade Nation's Influencer program and receive a monthly fee for using their TradingView charts in my analysis.

GBP-NZD Strong Support Ahead! Buy!
Hello,Traders!
GBP-NZD is making a bearish
Correction after trading in an
Uptrend for some time but a
Strong horizontal support
Level is ahead at 2.2394
So after the retest we will
Be expecting a new
Bullish move up
Buy!
Comment and subscribe to help us grow!
Check out other forecasts below too!
Disclosure: I am part of Trade Nation's Influencer program and receive a monthly fee for using their TradingView charts in my analysis.

GBP_CAD WILL FALL|SHORT|
✅GBP_CAD broke the rising
Support line after trading in an
Uptrend for a long time so
We will be awaiting a long
Overdue correction and a
Move down on Monday
Towards the target of 1.8500
SHORT🔥
✅Like and subscribe to never miss a new idea!✅
Disclosure: I am part of Trade Nation's Influencer program and receive a monthly fee for using their TradingView charts in my analysis.

NZD-JPY Bearish Bias! Sell!
Hello,Traders!
NZD-JPY is about to
Retest a horizontal
Resistance level of 85.647
And as it is a strong level
A local bearish correction
Is to be expected
Sell!
Comment and subscribe to help us grow!
Check out other forecasts below too!
Disclosure: I am part of Trade Nation's Influencer program and receive a monthly fee for using their TradingView charts in my analysis.

AUD_CHF WILL GROW|LONG|
✅AUD_CHF is going up now
And the pair made a a bullish
Breakout of the key horizontal
Level of 0.5580 and the breakout
Is confirmed so we are bullish biased
And we will be expecting a
Further bullish move up
LONG🚀
✅Like and subscribe to never miss a new idea!✅

Bitcoin - Market outlook for the upcoming weeksLiquidity Sweep of the Last 4-Hour Low
Last week, Bitcoin pulled a classic sell-side liquidity sweep by breaking below the last 4-hour low. This move likely targeted stop-loss orders placed by long traders and trapped breakout sellers. The price dipped sharply below this key level but quickly reversed upward, signaling a potential bullish reversal. Such movements are often orchestrated by institutional players or "smart money" to accumulate liquidity before driving the market in their desired direction
Key characteristics of this liquidity sweep include:
Key Liquidity Zone: The 4-hour low acted as a critical support level where many traders had stop-loss orders.
Sharp Price Spike Below: The price briefly dipped below this level, triggering stop-losses and enticing short sellers.
Aggressive Reversal: Following the sweep, the price rebounded strongly, forming bullish rejection candles on lower timeframes. This confirms the sweep and suggests that smart money may now push prices higher
Resistance Zone and Current Market Structure
The current resistance level is marked by the blue zone, which represents a key imbalance area. For the bullish reversal to gain momentum, Bitcoin must break above this resistance convincingly.
A breakout above this zone would:
Confirm a shift in market structure to bullish.
Likely lead to a retest of the resistance zone as new support (a common breakout strategy).
Open the door for further upside movement toward higher targets.
However, if Bitcoin fails to break above this resistance, it could indicate continued consolidation or even another test of lower levels.
Impact of Today’s PPI Dat a
The U.S. Bureau of Labor Statistics reported that the Producer Price Index for final demand was unchanged in February 2025, seasonally adjusted. This figure came in below economists expectations of a 0.3% increase. Even tho Bitcoin did not react to this right now, it could still show some signs later.
Conclusion
The sell-side liquidity sweep below the last 4-hour low is a textbook example of smart money manipulation, setting the stage for a potential bullish reversal. Traders should closely monitor the blue resistance zone for signs of a breakout or rejection. Additionally, today’s PPI data adds another layer of complexity to market dynamics, potentially swaying sentiment depending on whether it signals inflationary pressures or relief.
__________________________________________
Thanks for your support!
If you found this idea helpful or learned something new, drop a like 👍 and leave a comment, I’d love to hear your thoughts! 🚀
Make sure to follow me for more price action insights, free indicators, and trading strategies. Let’s grow and trade smarter together! 📈

NZD-USD Short From Resistance! Sell!
Hello,Traders!
NZD-USD was going up
Yet failed to reach and
Break the horizontal resistance
Of 0.5772 before the trading week's
End so the bulls are not as strong
As we initially thought which
Give us a nice opportunity
To enter a short trade on
The pair on Monday
With the Target of 0.5732
And Stop Loss of 0.5775
Sell!
Comment and subscribe to help us grow!
Check out other forecasts below too!
Disclosure: I am part of Trade Nation's Influencer program and receive a monthly fee for using their TradingView charts in my analysis.

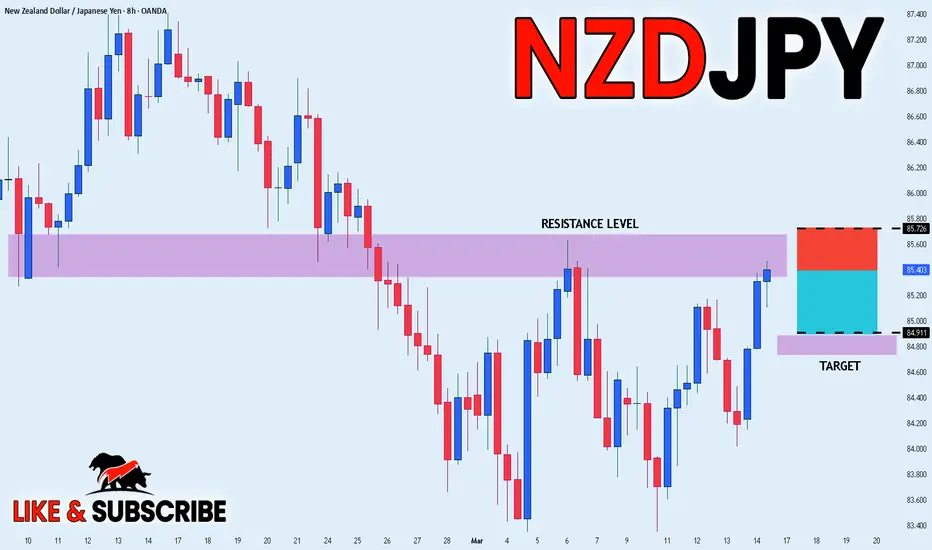
NZD_JPY SHORT SIGNAL|
✅EUR_USD has been growing recently
And the pair seems locally overbought
So as the pair is approaching a horizontal resistance of 85.6800
We can enter a short trade
At 85.3890 with the Target of 84.9110
And the Stop Loss of 85.7260
Just above the resistance
SHORT🔥
✅Like and subscribe to never miss a new idea!✅
AUDUSD swing sellI identified a break in the uptrend structure on the 1-minute timeframe at the 0.6321 level, indicating a possible shift in market direction. Upon confirmation, I entered a sell position at this level, anticipating a further decline. My target profit is set at 0.6169, aligning with a key support level. To manage risk, I placed a stop-loss above the recent swing high to limit potential losses if the price moves against my position. This trade is based on a structural shift in market momentum, aiming to capitalize on a bearish move following the breakdown of the uptrend.
