AUD_CHF WILL GROW|LONG|
✅AUD_CHF is going up now
And the pair made a a bullish
Breakout of the key horizontal
Level of 0.5580 and the breakout
Is confirmed so we are bullish biased
And we will be expecting a
Further bullish move up
LONG🚀
✅Like and subscribe to never miss a new idea!✅
Smartmoneyconcept

Bitcoin - Market outlook for the upcoming weeksLiquidity Sweep of the Last 4-Hour Low
Last week, Bitcoin pulled a classic sell-side liquidity sweep by breaking below the last 4-hour low. This move likely targeted stop-loss orders placed by long traders and trapped breakout sellers. The price dipped sharply below this key level but quickly reversed upward, signaling a potential bullish reversal. Such movements are often orchestrated by institutional players or "smart money" to accumulate liquidity before driving the market in their desired direction
Key characteristics of this liquidity sweep include:
Key Liquidity Zone: The 4-hour low acted as a critical support level where many traders had stop-loss orders.
Sharp Price Spike Below: The price briefly dipped below this level, triggering stop-losses and enticing short sellers.
Aggressive Reversal: Following the sweep, the price rebounded strongly, forming bullish rejection candles on lower timeframes. This confirms the sweep and suggests that smart money may now push prices higher
Resistance Zone and Current Market Structure
The current resistance level is marked by the blue zone, which represents a key imbalance area. For the bullish reversal to gain momentum, Bitcoin must break above this resistance convincingly.
A breakout above this zone would:
Confirm a shift in market structure to bullish.
Likely lead to a retest of the resistance zone as new support (a common breakout strategy).
Open the door for further upside movement toward higher targets.
However, if Bitcoin fails to break above this resistance, it could indicate continued consolidation or even another test of lower levels.
Impact of Today’s PPI Dat a
The U.S. Bureau of Labor Statistics reported that the Producer Price Index for final demand was unchanged in February 2025, seasonally adjusted. This figure came in below economists expectations of a 0.3% increase. Even tho Bitcoin did not react to this right now, it could still show some signs later.
Conclusion
The sell-side liquidity sweep below the last 4-hour low is a textbook example of smart money manipulation, setting the stage for a potential bullish reversal. Traders should closely monitor the blue resistance zone for signs of a breakout or rejection. Additionally, today’s PPI data adds another layer of complexity to market dynamics, potentially swaying sentiment depending on whether it signals inflationary pressures or relief.
__________________________________________
Thanks for your support!
If you found this idea helpful or learned something new, drop a like 👍 and leave a comment, I’d love to hear your thoughts! 🚀
Make sure to follow me for more price action insights, free indicators, and trading strategies. Let’s grow and trade smarter together! 📈

NZD-USD Short From Resistance! Sell!
Hello,Traders!
NZD-USD was going up
Yet failed to reach and
Break the horizontal resistance
Of 0.5772 before the trading week's
End so the bulls are not as strong
As we initially thought which
Give us a nice opportunity
To enter a short trade on
The pair on Monday
With the Target of 0.5732
And Stop Loss of 0.5775
Sell!
Comment and subscribe to help us grow!
Check out other forecasts below too!
Disclosure: I am part of Trade Nation's Influencer program and receive a monthly fee for using their TradingView charts in my analysis.

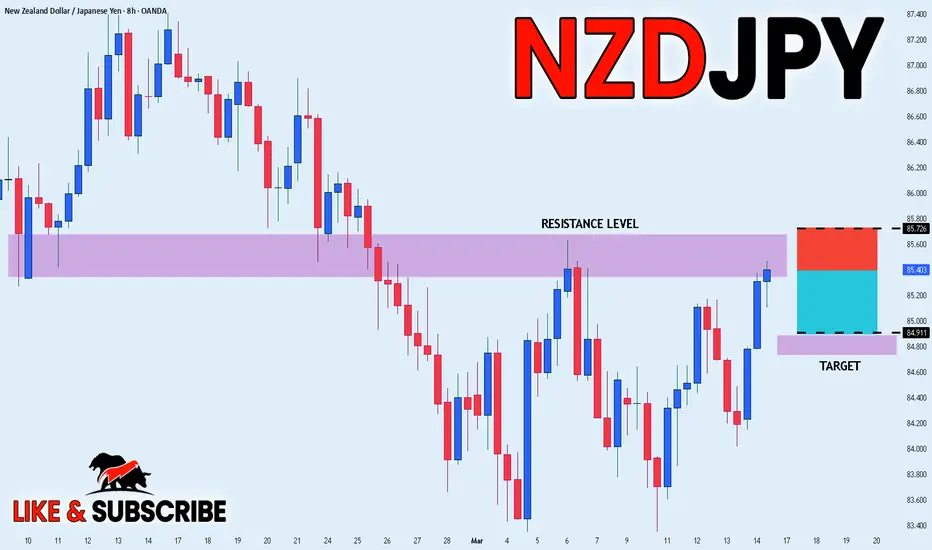
NZD_JPY SHORT SIGNAL|
✅EUR_USD has been growing recently
And the pair seems locally overbought
So as the pair is approaching a horizontal resistance of 85.6800
We can enter a short trade
At 85.3890 with the Target of 84.9110
And the Stop Loss of 85.7260
Just above the resistance
SHORT🔥
✅Like and subscribe to never miss a new idea!✅
AUDUSD swing sellI identified a break in the uptrend structure on the 1-minute timeframe at the 0.6321 level, indicating a possible shift in market direction. Upon confirmation, I entered a sell position at this level, anticipating a further decline. My target profit is set at 0.6169, aligning with a key support level. To manage risk, I placed a stop-loss above the recent swing high to limit potential losses if the price moves against my position. This trade is based on a structural shift in market momentum, aiming to capitalize on a bearish move following the breakdown of the uptrend.

EUR-AUD Will Go UP! Buy!
Hello,Traders!
EUR-AUD is trading in an
Uptrend and we are now
Seeing a nice bullish reaction
From the horizontal support
Of 1.7153 which reinforces our
Bullish bias and we will be
Expecting the pair grow more
With the target of 1.7417
Buy!
Comment and subscribe to help us grow!
Check out other forecasts below too!
Disclosure: I am part of Trade Nation's Influencer program and receive a monthly fee for using their TradingView charts in my analysis.

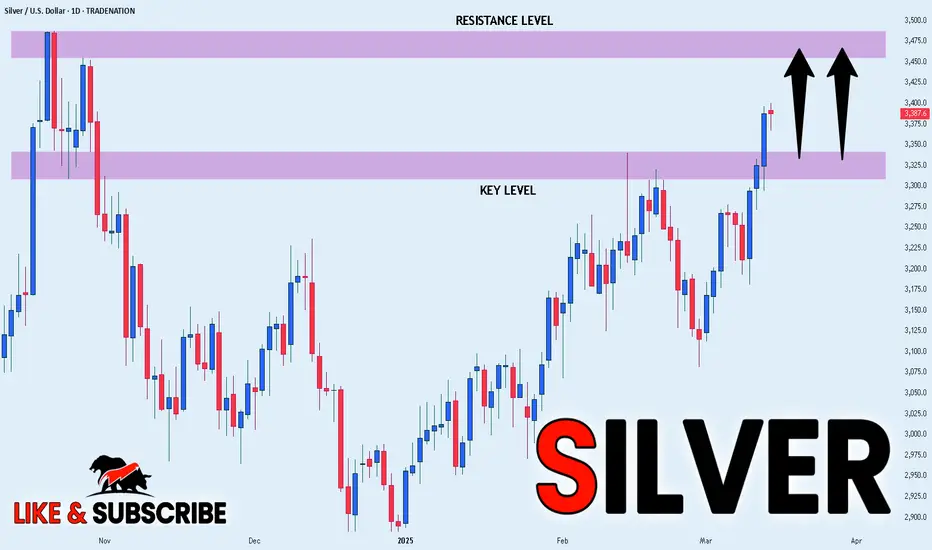
SILVER WILL KEEP GROWING|LONG|
✅SILVER is trading in a
Strong uptrend and we saw
A very strong bullish breakout
And the breakout is confirmed
So while I am expecting a potential
Correction and even a retest
Of a broken key level of 33.29$
I will be expecting a further
Move up and a retest of the
Horizontal resistance above
At around 34.84$
LONG🚀
✅Like and subscribe to never miss a new idea!✅
Disclosure: I am part of Trade Nation's Influencer program and receive a monthly fee for using their TradingView charts in my analysis.
GBP_NZD BEARISH BREAKOUT|SHORT|
✅GBP_NZD was trading in
An uptrend but now we are
Seeing a bearish breakout
From the bearish wedge
Pattern so we are bearish
Biased and we will be expecting
A further move down
SHORT🔥
✅Like and subscribe to never miss a new idea!✅

EUR-GBP Growth Ahead! Buy!
Hello,Traders!
EUR-GBP made a retest
Of the horizontal support
Level of 0.8370 and we are
Already seeing a bullish
Reaction so we are bullish
Biased and we will be
Expecting a further move up
Buy!
Comment and subscribe to help us grow!
Check out other forecasts below too!
Disclosure: I am part of Trade Nation's Influencer program and receive a monthly fee for using their TradingView charts in my analysis.

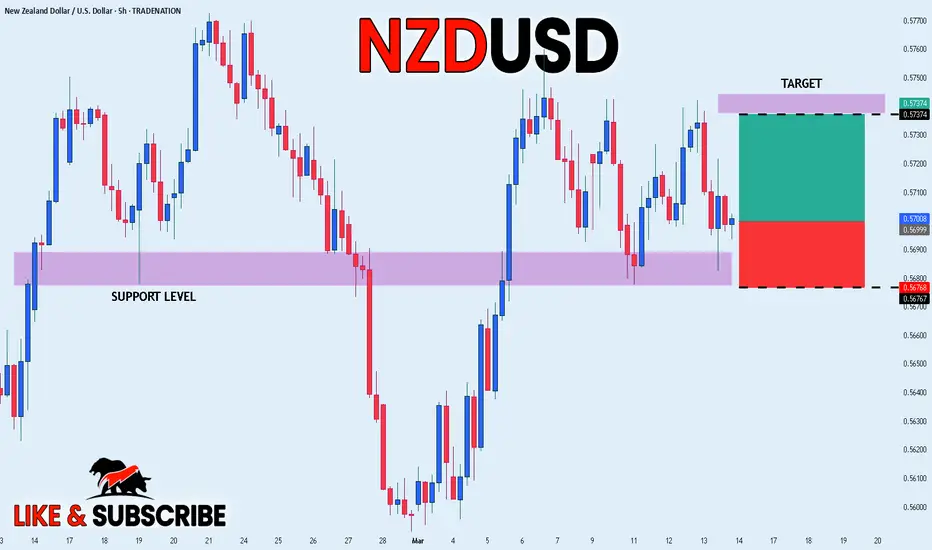
NZD_USD LONG SIGNAL|
✅NZD_USD made a retest
Of the horizontal support
Of 0.5680 from where we
Are already seeing a bullish
Rebound so we can enter a
Long trade from around 0.5700
With the target being 0.5737
And the SL of 0.5676
LONG🚀
✅Like and subscribe to never miss a new idea!✅
GOLD Strong Bullish Breakout! Buy!
Hello,Traders!
GOLD is trading in a strong
Uptrend and the price
Made a bullish breakout
Of the key horizontal level
Of 2949$ and the breakout
Is confirmed so we are
Bullish biased and we will
Be expecting a further move
Up after the potential pullback
Sell!
Comment and subscribe to help us grow!
Check out other forecasts below too!
Disclosure: I am part of Trade Nation's Influencer program and receive a monthly fee for using their TradingView charts in my analysis.

Quarterly Theory "QT"
Introduction to Quarterly Theory (QT)
Time must be divided into quarters for a proper interpretation of market cycles.
Combining QT (Quarterly Theory) concepts with basic ICT concepts leads to greater accuracy.
Understanding QT allows you to be flexible. It adapts to any trading style as it is universal across all time frames.
QT eliminates ambiguity by providing specific time-based reference points to look for when entering trades
.
THE CYCLE
Annual Cycle - 3 quarters each
Monthly Cycle - 1 week each
Weekly Cycle - 1 day each*
Daily Cycle - 6 hours each
Session Cycle - 90 minutes each
*Monday to Thursday, Friday has its own specific function .
Annual Cycle:
Q1 JANUARY - MARCH
Q2 APRIL - JUNE
Q3 JULY - SEPTEMBER
Q4 OCT - DECEMBER
Monthly Cycle**:
Q1 FIRST WEEK
Q2 SECOND WEEK
Q3 THIRD WEEK
Q4 FOURTH WEEK
Weekly Cycle*:
Q1 MONDAY
Q2 TUESDAY
Q3 WEDNESDAY
Q4 THURSDAY
Daily Cycle:
Q1 ASIA
Q2 LONDON
Q3 NEW YORK
Q4 AFTERNOON
**Monthly Cycle starts with the first full week of the month.
*Friday has its own cycle, which is why it is not listed.
Q1 indicates the quarters that follow.
If Q1 expands, Q2 is likely to consolidate.
If Q1 consolidates, Q2 is likely to expand.
TRUE OPENS
True price opens are the beginning of Q2 in each cycle. It validates key levels.
What are the true opens?
Yearly: First Monday of April (Q2)
Monthly: Second Monday of the month (Q2)
Weekly: Second daily candle of the week
Daily: Start of the London session (6 hours after the open of the daily candle)
Asia - London - NY - Evening: 90 minutes after the open of the 6-hour candle.
DIAGRAM:
Q1 (A) Accumulation - Consolidation.
Q2 (M) Manipulation - Judas Swing (Trade this).
Q3 (D) Distribution (Trade this).
Q4 (X) Continuation - Reversal of the previous quarter.
Q1 (X) Continuation - Reversal of the previous quarter.
Q2 (A) Accumulation - Consolidation.
Q3 (M) Manipulation - Judas Swing (Trade this).
Q4 (D) Distribution (Trade this).
ANNUAL CYCLE:
MONTHLY CYCLE:
WEEKLY CYCLE:
DAILY CYCLE:

AUD-USD Support Ahead! Buy!
Hello,Traders!
AUD-USD is going down
And will soon retest a
Horizontal demand level
Of 0.6260 from where we
Will be expecting a local
Rebound and a move up
Buy!
Comment and subscribe to help us grow!
Check out other forecasts below too!
Disclosure: I am part of Trade Nation's Influencer program and receive a monthly fee for using their TradingView charts in my analysis.

GOLD RESISTANCE AHEAD|SHORT|
✅GOLD is going up now
But a strong resistance level is ahead at 2956$
Thus I am expecting a pullback
And a move down towards the target at 2938$
SHORT🔥
✅Like and subscribe to never miss a new idea!✅
Disclosure: I am part of Trade Nation's Influencer program and receive a monthly fee for using their TradingView charts in my analysis.

SILVER Will Go Down! Sell!
Hello,Traders!
SILVER went up sharply
And has hit a horizontal
Resistance level of 33.41$
And we are already seeing a
Local bearish pullback
So we are locally bearish
Biased and we will be
Expecting a further move down
Sell!
Comment and subscribe to help us grow!
Check out other forecasts below too!
Disclosure: I am part of Trade Nation's Influencer program and receive a monthly fee for using their TradingView charts in my analysis.

EUR_JPY WILL GROW AFTER PULLBACK|LONG|
✅EUR_JPY is trading in an
Uptrend and the pair made a
Bullish breakout of the key
Horizontal level of 161.000
Which is now a support
And the pair is now making
A local pullback but we
Are bullish biased and after
The retest of the new support
We will be expecting a
Further move up
LONG🚀
✅Like and subscribe to never miss a new idea!✅

AMAZON Bullish Bias! Buy!
Hello,Traders!
AMAZON made a bullish
Rebound after the retest
Of the horizontal support
Level of 190.78$ so we are
Locally bullish biased and
We will be expecting a
Further bullish move up
Buy!
Comment and subscribe to help us grow!
Check out other forecasts below too!

DOW-JONES INDEX BEARISH BREAKOUT|SHORT|
✅DOWJONES/US30 index is
Going down now and the price
Made a bearish breakout which
Is confirmed so we are bearish
Biased and we will be expecting
A further bearish continuation
SHORT🔥
✅Like and subscribe to never miss a new idea!✅

GOLD Bullish Breakout! Buy!
Hello,Traders!
GOLD is going up now
And made a strong bullish
Breakout of the key
Horizontal level of 2923$
So we are bullish
Biased now therefore
We will be expecting a
Further bullish move up
Buy!
Comment and subscribe to help us grow!
Check out other forecasts below too!
Disclosure: I am part of Trade Nation's Influencer program and receive a monthly fee for using their TradingView charts in my analysis.

USD_JPY LOCAL SHORT|
✅USD_JPY has retested a key resistance level of 149.600
And as the pair is already making a bearish pullback
A move down to retest the demand level below at 147.600 is likely
SHORT🔥
✅Like and subscribe to never miss a new idea!✅

GBP-USD Resistance Ahead! Sell!
Hello,Traders!
GBP-USD keeps growing
In a strong uptrend but the
Pair is locally overbought
So after it hits a resistance
Of 1.3048 from where we
Will be expecting a local
Bearish move down
Sell!
Comment and subscribe to help us grow!
Check out other forecasts below too!
Disclosure: I am part of Trade Nation's Influencer program and receive a monthly fee for using their TradingView charts in my analysis.

USD-JPY Swing Long! Buy!
Hello,Traders!
USD-JPY has made a retest
Of the horizontal support
Of 146.540 and we are already
Seeing a bullish rebound
From where we will be
Expecting further move up
Buy!
Comment and subscribe to help us grow!
Check out other forecasts below too!
Disclosure: I am part of Trade Nation's Influencer program and receive a monthly fee for using their TradingView charts in my analysis.

EUR_GBP CORRECTION AHEAD|SHORT|
✅EUR_GBP surged again to retest the resistance of 0.8473
But it is a strong key level
So I think that there is a high chance
That we will see a bearish pullback and a move down
SHORT🔥
✅Like and subscribe to never miss a new idea!✅
