CADJPY Retesting Key Level: Will Sellers Step In?OANDA:CADJPY is approaching a key level that previously acted as support. Now that price is retesting it, there’s a good chance it could turn into resistance. If sellers step in, we could see a bearish reaction.
If the price shows clear signs of rejection from this zone, I anticipate a move downward toward the 104.500 level, which serves as a logical target for this setup. Conversely, a clean breakout above the zone could signal a potential bullish continuation.
Traders should monitor for bearish confirmation signals, such as bearish engulfing candles, long upper wicks rejecting the resistance, or increased selling volume before considering short positions. Let me know your thoughts or any additional insights you might have
SMC

GBP_CHF LONG SIGNAL|
✅GBP_CHF is trading in an uptrend
Along the rising support line
Which makes me bullish biased
And the pair is about to retest the rising support
Thus, a rebound and a move up is expected
So we can enter a long trade with
The TP of 1.1410 and SL of 1.1350
LONG🚀
✅Like and subscribe to never miss a new idea!✅
Disclosure: I am part of Trade Nation's Influencer program and receive a monthly fee for using their TradingView charts in my analysis.

USD-CHF Local Short Form Resistance! Sell!
Hello,Traders!
USD-CHF is trading in a
Kind of range consolidating
For a next big move but
Right now we can use the
Moment to trade the local
Range and to short the pair
From the horizontal resistance
Of 0.8855
Sell!
Comment and subscribe to help us grow!
Check out other forecasts below too!
Disclosure: I am part of Trade Nation's Influencer program and receive a monthly fee for using their TradingView charts in my analysis.

eurusd chart: trade idea 1 - go towards breaker blockeurusd chart: trade idea 1 - go towards breaker blockeurusd chart: trade idea 1 - go towards breaker blockeurusd chart: trade idea 1 - go towards breaker blockeurusd chart: trade idea 1 - go towards breaker blockeurusd chart: trade idea 1 - go towards breaker blockeurusd chart: trade idea 1 - go towards breaker blockeurusd chart: trade idea 1 - go towards breaker blockeurusd chart: trade idea 1 - go towards breaker blockeurusd chart: trade idea 1 - go towards breaker blockeurusd chart: trade idea 1 - go towards breaker blockeurusd chart: trade idea 1 - go towards breaker blockeurusd chart: trade idea 1 - go towards breaker blockeurusd chart: trade idea 1 - go towards breaker blockeurusd chart: trade idea 1 - go towards breaker blockeurusd chart: trade idea 1 - go towards breaker blockeurusd chart: trade idea 1 - go towards breaker blockeurusd chart: trade idea 1 - go towards breaker blockeurusd chart: trade idea 1 - go towards breaker blockeurusd chart: trade idea 1 - go towards breaker blockeurusd chart: trade idea 1 - go towards breaker blockeurusd chart: trade idea 1 - go towards breaker blockeurusd chart: trade idea 1 - go towards breaker blockeurusd chart: trade idea 1 - go towards breaker blockeurusd chart: trade idea 1 - go towards breaker blockeurusd chart: trade idea 1 - go towards breaker blockeurusd chart: trade idea 1 - go towards breaker blockeurusd chart: trade idea 1 - go towards breaker blockeurusd chart: trade idea 1 - go towards breaker block

SPY WILL FALL|SHORT|
✅SPY has hit a key structure level of 577.50$
Which implies a high likelihood of a move down
As some market participants will be taking profit from their long positions
While others will find this price level to be good for selling
So as usual we will have a chance to ride the wave of a bearish correction
SHORT🔥
✅Like and subscribe to never miss a new idea!✅
Disclosure: I am part of Trade Nation's Influencer program and receive a monthly fee for using their TradingView charts in my analysis.

BITCOIN Wait For Breakout! Sell!
Hello,Traders!
BITCOIN is trading below
The horizontal resistance
Of 92,000$ and has formed
A bearish wedge pattern so
We are bearish biased and
IF we see a bearish breakout
From the wedge we can
Be expecting a further move down
Sell!
Comment and subscribe to help us grow!
Check out other forecasts below too!
Disclosure: I am part of Trade Nation's Influencer program and receive a monthly fee for using their TradingView charts in my analysis.

USOIL SHORT FROM RESISTANCE|
✅CRUDE OIL has hit a TP
Of our last free signal and
Went further up just as we
Predicted but will soon hit
A horizontal resistance level
Of 70.57$ from where we will
Be expecting a local bearish
Correction and a move down
SHORT🔥
✅Like and subscribe to never miss a new idea!✅
Disclosure: I am part of Trade Nation's Influencer program and receive a monthly fee for using their TradingView charts in my analysis.

CAD-CHF Free Signal! Sell!
Hello,Traders!
CAD-CHF has made some
Gains from the recent lows
Just as we expected but now
The pair is entering the
Horizontal resistance area
Around 0.6212 from where
We can enter a short trade
With the Take Profit of 0.6162
And the Stop Loss of 0.6233
Buy!
Comment and subscribe to help us grow!
Check out other forecasts below too!
Disclosure: I am part of Trade Nation's Influencer program and receive a monthly fee for using their TradingView charts in my analysis.

NAS still charging for bullish targets but currently retracingWe are looking at a retest of break points on the session. Going into this session we will monitor what happens at the previously broken levels.
We do have bearish imbalances in LTFs that have yielded neat entry on shorts. Stay sharp in this range.
Share with someone in need on true levels 🔑

Gold is eyeing highs after a bullish daily candleThis is def a consolidation range so keep your eyes sharp and pay attention to what happens as we break into the highs. Will we displace with longs or will be be saturated by the bearish imbalances above the current hourly range?
Share with a friend in need 🔑

USDJPY Trending Lower - Will It Drop To 145.200?OANDA:USDJPY is currently trading within a descending channel, indicating a strong bearish structure. The price has broken below a key support zone and may now pull back for a potential retest. This level previously acted as support and could now serve as resistance, aligning with a possible bearish continuation.
If sellers confirm resistance at this zone, the price is likely to move downward toward the 145.200 target. However, a failure to reject this level could indicate a potential shift in momentum.
Traders should monitor for bearish confirmation signals, such as bearish engulfing candles, strong wicks rejecting the resistance zone, or increased selling volume, before considering short positions.
Let me know your thoughts or any additional insights you might have!

CADCHF Approaching Key Support – Rebound Toward 0.61890?OANDA:CADCHF is approaching a key support zone, marked by strong buying pressure. This area has historically served as a demand zone, suggesting the potential for a bullish reversal if buyers step in.
The current market structure indicates that if the price confirms a rejection from this support zone, there is a high probability of an upward move. I anticipate that if buyers defend this level, the market may head higher toward the 0.61890 target, which represents a logical target within the current market structure. However, a break below this support would invalidate the bullish bias and could lead to further declines.
If you have any thoughts on this setup or see an alternative perspective, feel free to comment!

GOLD at Key Resistance: Possible Correction AheadOANDA:XAUUSD has reached a critical resistance zone. This zone has previously acted as a barrier for price, leading to strong reversals in the past. This area aligns with a significant supply zone, where the ongoing bullish momentum may face exhaustion, signaling a potential turning point.
If the price shows bearish confirmation, such as rejection candles or a bearish engulfing pattern, I expect a pullback toward the 2733.000 level, which represents a logical target within the current market structure. This scenario reflects the potential for a short-term correction within the broader trend.
If you agree with this analysis or have additional insights, feel free to share your thoughts in the comments!

EURUSD Approaching Key Demand Zone – Potential Rebound?OANDA:EURUSD is approaching a key demand zone marked by previous price reactions. This area has historically acted as strong support, leading to bullish moves in the past. The current structure suggests that buyers may step in if the price confirms a rejection from this zone.
If we see bullish confirmation, such as a strong rejection or a bullish engulfing candle, the market could push higher toward the 1.04020 level. However, a break below this demand zone would invalidate the bullish bias and could lead to further declines.
This setup reflects the potential for a rebound after an impulsive move, supported by past price behavior and market structure.
If you agree with this analysis or have additional insights, feel free to share your thoughts in the comments!

EUR-GBP Bearish Breakout! Sell!
Hello,Traders!
EUR-GBP made a bearish
Breakout of key horizontal
Level of 0.8353 so we are
Bearish biased and after
A potential pullback we will
Be expecting a further
Bearish move down
Sell!
Comment and subscribe to help us grow!
Check out other forecasts below too!
Disclosure: I am part of Trade Nation's Influencer program and receive a monthly fee for using their TradingView charts in my analysis.

USD_CAD LOCAL LONG|
✅USD_CAD fell again to
Retest the support of 1.4420
But it is a strong key level
So I think that there is a high chance
We will see a bullish rebound and a move up
LONG🚀
✅Like and subscribe to never miss a new idea!✅
Disclosure: I am part of Trade Nation's Influencer program and receive a monthly fee for using their TradingView charts in my analysis.
NIKKEI INDEX BEARISH BIAS|SHORT|
✅NIKKEI is going up now
But a strong resistance level is ahead at 38,400
Thus I am expecting a pullback
And a move down towards the target of 37,530
SHORT🔥
✅Like and subscribe to never miss a new idea!✅
Disclosure: I am part of Trade Nation's Influencer program and receive a monthly fee for using their TradingView charts in my analysis.

SPY Free Signal! Sell!
Hello,Traders!
SPY made a nice bullish
Move and will soon hit a
Horizontal support of 577.19$
From where we can enter
A short trade with the
Take Profit of 566.48$
And the Stop Loss of 583.38$
Sell!
Comment and subscribe to help us grow!
Check out other forecasts below too!
Disclosure: I am part of Trade Nation's Influencer program and receive a monthly fee for using their TradingView charts in my analysis.

CRUDE OIL LONG SIGNAL|
✅USOIL made a retest
Of the horizontal support
Of 68.60$ so we are bullish
Biased so we can enter a
Long trade with the TP of 69.46$
And the SL of 68.17$
LONG🚀
✅Like and subscribe to never miss a new idea!✅
Disclosure: I am part of Trade Nation's Influencer program and receive a monthly fee for using their TradingView charts in my analysis.

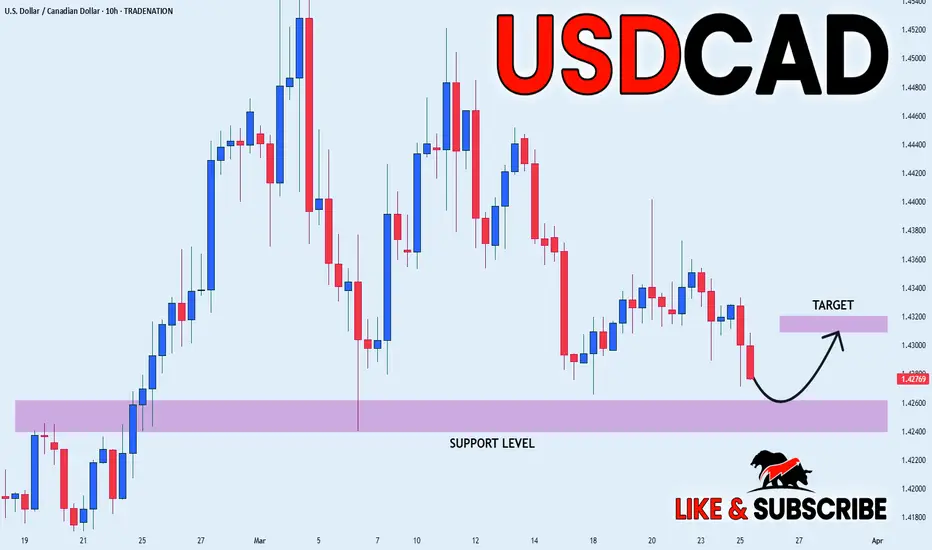
USD-CAD Long From Support! Buy!
Hello,Traders!
USD-CAD made a retest of
The horizontal support level
Of 1.4256 and we are already
Seeing a bullish rebound so
We will be expecting a
Further bullish move up
Buy!
Comment and subscribe to help us grow!
Check out other forecasts below too!
Disclosure: I am part of Trade Nation's Influencer program and receive a monthly fee for using their TradingView charts in my analysis.

Ger 30 Additional LookOutThis is what I wanted to talk about today, the gap might really mess with our heads if we are not careful enough. Please don't take the motivation offensive, I am just directing the message to people who are as stuck as I am. Happy Trading.

USDJPY BUY📊 EUR/JPY - Order Block & Break of Structure (BOS) Strategy 📊
Tracking EUR/JPY on the 15-minute timeframe, we see a potential bullish setup based on order blocks (OBs) and smart money concepts (SMC). However, confirmation via Break of Structure (BOS) on lower timeframes will be key before entering a trade.
Key Zones:
Bullish Order Block (Demand Zone): 161.000 - 160.700
Expecting price to drop into this area, where institutions previously showed strong buying pressure.
Looking for BOS on lower timeframes (M5/M1) to confirm bullish intent before entering a buy position.
Bearish Order Block (Supply Zone): 163.500 - 163.700
A strong resistance level where price previously sold off.
If price reaches this area, we could see a reaction or potential reversal.
Trade Plan:
📉 Wait for price to enter the demand zone (161.000 - 160.700).
🔎 Look for a Break of Structure (BOS) on lower timeframes (M5/M1) to confirm bullish reversal.
✅ Enter a long position upon confirmation.
🎯 Targeting the supply zone at 163.500 - 163.700.
⚠️ Stop-loss below 160.700 to manage risk.

CAD_JPY POTENTIAL LONG|
✅CAD_JPY made a bullish
Breakout of the key horizontal
Level of 104.800 and the breakout
Is confirmed which reinforces our
Bullish bias and makes us expect
A further move up after the
Retest of the new support
LONG🚀
✅Like and subscribe to never miss a new idea!✅
Disclosure: I am part of Trade Nation's Influencer program and receive a monthly fee for using their TradingView charts in my analysis.
