EUR-CHF Resistance Ahead! Sell!
Hello,Traders!
EUR-CHF is making a
Bullish rebound now but
The pair will soon hit a
Horizontal resistance of 0.9347
From where we will be expecting
A local bearish pullback
Sell!
Comment and subscribe to help us grow!
Check out other forecasts below too!
Disclosure: I am part of Trade Nation's Influencer program and receive a monthly fee for using their TradingView charts in my analysis.
SMC

DXY: Local Bullish Bias! Long!
My dear friends,
Today we will analyse DXY together☺️
The recent price action suggests a shift in mid-term momentum. A break above the current local range around 99.390 will confirm the new direction upwards with the target being the next key level of 99.627 and a reconvened placement of a stop-loss beyond the range.
❤️Sending you lots of Love and Hugs❤️

EURUSD: Strong Growth Ahead! Long!
My dear friends,
Today we will analyse EURUSD together☺️
The in-trend continuation seems likely as the current long-term trend appears to be strong, and price is holding above a key level of 1.13895 So a bullish continuation seems plausible, targeting the next high. We should enter on confirmation, and place a stop-loss beyond the recent swing level.
❤️Sending you lots of Love and Hugs❤️

SILVER: Will Go Down! Short!
My dear friends,
Today we will analyse SILVER together☺️
The market is at an inflection zone and price has now reached an area around 32.557 where previous reversals or breakouts have occurred.And a price reaction that we are seeing on multiple timeframes here could signal the next move down so we can enter on confirmation, and target the next key level of 32.295..Stop-loss is recommended beyond the inflection zone.
❤️Sending you lots of Love and Hugs❤️

GOLD: The Market Is Looking Down! Short!
My dear friends,
Today we will analyse GOLD together☺️
The price is near a wide key level
and the pair is approaching a significant decision level of 3,327.25 Therefore, a strong bearish reaction here could determine the next move down.We will watch for a confirmation candle, and then target the next key level of 3,299.56.Recommend Stop-loss is beyond the current level.
❤️Sending you lots of Love and Hugs❤️

Bitcoin - Who Will Take Control: Bulls or Bears?Bitcoin is currently exhibiting a prolonged phase of sideways movement, trading within a clearly defined consolidation range. After a sharp move to the upside earlier this month, price has stalled and started to range between the resistance zone near $86,000 and support around $82,000. This type of price action typically suggests indecision in the market, where neither buyers nor sellers are in full control.
The candles within this range are relatively choppy, with many wicks on both sides, further reinforcing the idea that this is a low-conviction environment. It reflects a battle between opposing market participants, and historically, such consolidations often precede strong directional moves. Until this range is broken, price is likely to continue moving sideways with potential for false breakouts and low-probability trade setups.
The Consolidation Range
The current consolidation is outlined with clear visual zones. The upper boundary acts as resistance and is highlighted in red, while the lower boundary, acting as support, is marked in green. The range itself is filled in blue, representing the broader area of indecision and price balance.
This consolidation is not minor—it has held for several days with multiple rejections from both the resistance and support levels. The more time price spends within a range like this, the more significant the breakout is likely to be. Liquidity builds up at the highs and lows of these ranges, and eventually one side will be taken out, leading to an expansion move.
Bullish Breakout Scenario
If Bitcoin manages to break and close decisively above the resistance zone, this would signal a potential shift in market sentiment toward the upside. A breakout above this level is likely to trigger stop-loss orders from short-sellers and attract breakout traders entering long positions.
The chart suggests that if this bullish breakout occurs, price will likely target the liquidity resting above recent swing highs, which are marked by the black horizontal lines. These levels represent areas where traders may have placed their stop orders, making them attractive targets for a price sweep. Following this, Bitcoin could enter a new trend phase, potentially setting up a continuation of the larger bullish structure that preceded the consolidation.
It is important, however, to wait for confirmation. A clean breakout followed by a retest or strong follow-through volume would provide greater confidence in a bullish continuation. Entering prematurely could result in being caught in a false breakout, especially in a ranging market like this.
Bearish Breakdown Scenario
Alternatively, if price breaks below the support zone with conviction, this would be a clear bearish signal. A move below the lower boundary of the range would imply that the buyers have been exhausted and that sellers have regained control.
In this scenario, the expectation is that price will seek out the inefficiencies and untested price action below, particularly the yellow zone marked on the chart. This area likely represents a previous gap or imbalance—zones where price moved rapidly in the past and did not spend much time. Such zones often act as magnets for price once a breakdown occurs, as the market seeks to fill in that inefficiency.
This bearish move could lead to a significant drop, potentially targeting levels as low as the upper $70,000s or even lower, depending on how strong the selling pressure becomes. Much like the bullish scenario, it's critical to watch for confirmation. A candle close below support with strong volume would be an ideal trigger for this bearish thesis.
No-Trade Zone and Strategy
Until Bitcoin breaks out of this range in either direction, there are no clear high-probability trades. Entering within the range is inherently risky due to the lack of momentum and high chance of reversals. Whipsawing price action can easily trigger stop-losses and create frustration for traders trying to anticipate moves before confirmation.
The most prudent approach in this situation is patience. Let the market show its hand. Once a breakout occurs, whether to the upside or downside, the path forward becomes more defined and trade setups with favorable risk-to-reward ratios will emerge. For now, this is a textbook no-trade zone—ideal for observing and planning, not for forcing entries.
Conclusion
Bitcoin is currently at a critical juncture. The ongoing consolidation is a precursor to a larger move, and while the direction is not yet confirmed, the zones of interest are clearly mapped out. A breakout above resistance will suggest a bullish continuation, targeting liquidity above recent highs. A breakdown below support will imply a bearish move toward the inefficiencies and untested price areas below.
In markets like this, discipline is key. The goal is to avoid getting chopped up in the range and instead position yourself on the right side once momentum returns. The next breakout will likely set the tone for the coming days or even weeks—so patience now could lead to greater reward later.
__________________________________________
Thanks for your support!
If you found this idea helpful or learned something new, drop a like 👍 and leave a comment, I’d love to hear your thoughts! 🚀
Make sure to follow me for more price action insights, free indicators, and trading strategies. Let’s grow and trade smarter together! 📈

NZD_USD WILL KEEP GROWING|LONG|
✅NZD_USD is trading in an
Uptrend and the pair made a
Strong bullish breakout of the
Key horizontal level of 0.5927
Which is a support now and the
Breakout is confirmed so we
Will be expecting a further
Bullish continuation
LONG🚀
✅Like and subscribe to never miss a new idea!✅
Disclosure: I am part of Trade Nation's Influencer program and receive a monthly fee for using their TradingView charts in my analysis.

GBP-AUD Bearish Triangle Pattern! Sell!
Hello,Traders!
GBP-AUD has formed a
Bearish triangle pattern
So we are bearish biased
And IF we see a bearish
Breakout then we will be
Expecting a further
Bearish continuation
Sell!
Comment and subscribe to help us grow!
Check out other forecasts below too!
Disclosure: I am part of Trade Nation's Influencer program and receive a monthly fee for using their TradingView charts in my analysis.

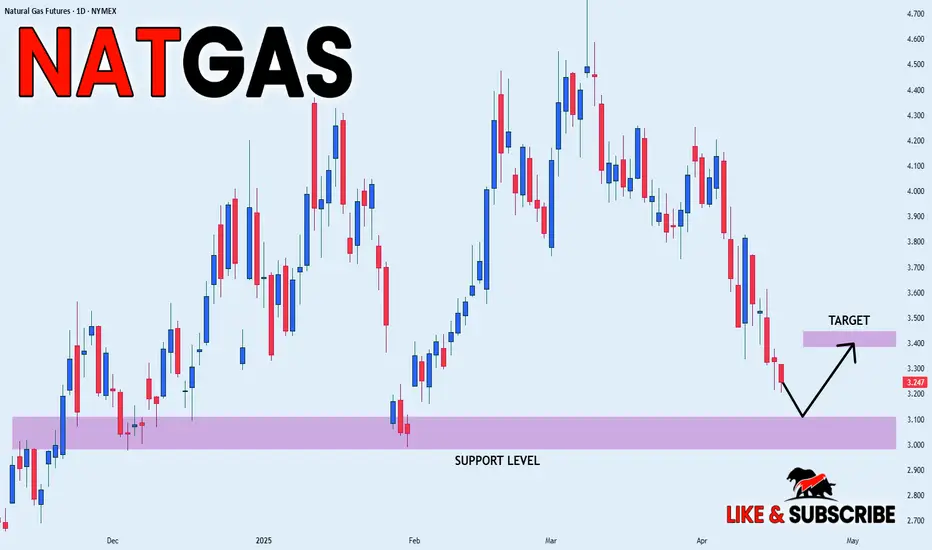
NATGAS Swing Long! Buy!
Hello,Traders!
NATGAS went down after
The support cluster breakout
Just as we predicted in my previous
Analysis but price will soon hit a
Horizontal support level of 3.00$
From where we will be expecting
A local bullish correction
Buy!
Comment and subscribe to help us grow!
Check out other forecasts below too!
Disclosure: I am part of Trade Nation's Influencer program and receive a monthly fee for using their TradingView charts in my analysis.

GBP_USD WILL GO UP|LONG|
✅GBP_USD already made a
Retest of the horizontal support
Of 1.3200 and is making a bullish
Rebound so as the pair is in the
Uptrend we are bullish biased
And we will be expecting the
Pair to go further up
LONG🚀
✅Like and subscribe to never miss a new idea!✅
Disclosure: I am part of Trade Nation's Influencer program and receive a monthly fee for using their TradingView charts in my analysis.

SILVER: Strong Bearish Sentiment! Short!
My dear friends,
Today we will analyse SILVER together☺️
The recent price action suggests a shift in mid-term momentum. A break below the current local range around 32.430 will confirm the new direction downwards with the target being the next key level of 32.151.and a reconvened placement of a stop-loss beyond the range.
❤️Sending you lots of Love and Hugs❤️

DXY: Bears Are Winning! Short!
My dear friends,
Today we will analyse DXY together☺️
The in-trend continuation seems likely as the current long-term trend appears to be strong, and price is holding below a key level of 99.125 So a bearish continuation seems plausible, targeting the next low. We should enter on confirmation, and place a stop-loss beyond the recent swing level.
❤️Sending you lots of Love and Hugs❤️

EURUSD: Next Move Is Up! Long!
My dear friends,
Today we will analyse EURUSD together☺️
The market is at an inflection zone and price has now reached an area around 1.13506 where previous reversals or breakouts have occurred.And a price reaction that we are seeing on multiple timeframes here could signal the next move up so we can enter on confirmation, and target the next key level of 1.13834.Stop-loss is recommended beyond the inflection zone.
❤️Sending you lots of Love and Hugs❤️

GOLD: Target Is Up! Long!
My dear friends,
Today we will analyse GOLD together☺️
The price is near a wide key level
and the pair is approaching a significant decision level of 3,305.34 Therefore, a strong bullish reaction here could determine the next move up.We will watch for a confirmation candle, and then target the next key level of 3,336.25.Recommend Stop-loss is beyond the current level.
❤️Sending you lots of Love and Hugs❤️

USDJPY (1h) sell updateEarlier this week we had this USDJPY sell setup where price perfectly pulled back into our entry price and even though it's been ranging the trade is now running in profit so if you did take this trade move the stop-loss to break-even (to the entry level) & watch it play out till it hits take profit or you can manually close the trade in profit.

AUD_CAD SHORT SIGNAL|
✅AUD_CAD made a retest
Of the horizontal resistance
Of 0.8880 then established
A beautiful double top pattern
And then broke the local neckline
Around 0.8832 so its a great
Setup for a short trade
With the TP of 0.8778 and
The SL of 0.8887 above the
Resistance upper bound
SHORT🔥
✅Like and subscribe to never miss a new idea!✅
Disclosure: I am part of Trade Nation's Influencer program and receive a monthly fee for using their TradingView charts in my analysis.

GBP-USD Free Signal! Buy!
Hello,Traders!
GBP-USD is trading in an
Uptrend and the pair is
About to retest a horizontal
Support level of 1.3181
From where we will be
Expecting a local rebound
As we are locally bullish biased
So we can enter a long trade
With the Take Profit of 1.3290
And the Stop Loss of 1.3147
Buy!
Comment and subscribe to help us grow!
Check out other forecasts below too!
Disclosure: I am part of Trade Nation's Influencer program and receive a monthly fee for using their TradingView charts in my analysis.

NATGAS SUPPORT AHEAD|LONG|
✅NATGAS is set to retest a
Strong support level below around 3.00$
After trading in a local downtrend from some time
Which makes a bullish rebound a likely scenario
With the target being a local resistance above 3.40$
LONG🚀
✅Like and subscribe to never miss a new idea!✅
Disclosure: I am part of Trade Nation's Influencer program and receive a monthly fee for using their TradingView charts in my analysis.
AUD_JPY LOCAL SHORT|
✅AUD_JPY price went up sharply
But a strong resistance level was hit around 91.500
Thus, as a pullback is already happening
And a move down towards the target of 89.500 shall follow
SHORT🔥
✅Like and subscribe to never miss a new idea!✅
Disclosure: I am part of Trade Nation's Influencer program and receive a monthly fee for using their TradingView charts in my analysis.

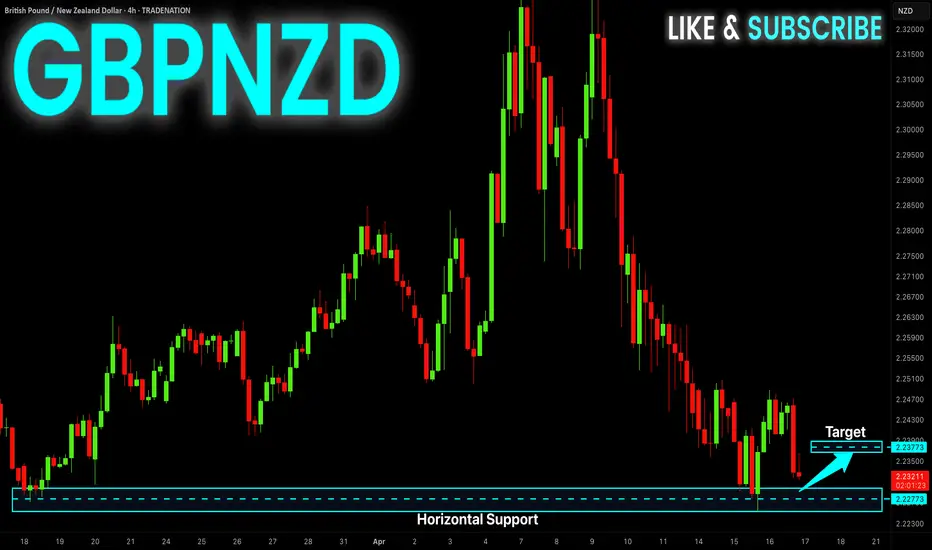
GBP-NZD Local Long! Buy!
Hello,Traders!
GBP-NZD is going down
Again to retest the horizontal
Support level of 2.2253 so
After the price hits the level
A local bullish rebound is
To be expected
Buy!
Comment and subscribe to help us grow!
Check out other forecasts below too!
Disclosure: I am part of Trade Nation's Influencer program and receive a monthly fee for using their TradingView charts in my analysis.
TRADE WITH BOTHSIDEThis diagram shows the potential relationship between the swing structure and the pingpong structure

DAX: Move Up Expected! Long!
My dear friends,
Today we will analyse DAX together☺️
The recent price action suggests a shift in mid-term momentum. A break below the current local range around 21,159.51 will confirm the new direction downwards with the target being the next key level of 21,322.13.and a reconvened placement of a stop-loss beyond the range.
❤️Sending you lots of Love and Hugs❤️

SILVER: Local Bullish Bias! Long!
My dear friends,
Today we will analyse SILVER together☺️
The recent price action suggests a shift in mid-term momentum. A break above the current local range around 32.833 will confirm the new direction upwards with the target being the next key level of 33.123 and a reconvened placement of a stop-loss beyond the range.
❤️Sending you lots of Love and Hugs❤️
