AUDUSD ShortAUDUSD Is Bearish On 4H TF As SMC Structure. Price Sweep The Liquidity On 1H TF, And Mitigate The 1H LQGC So we Got Confirmation On 5min TF.
Smcconcepts

EURGBP ShortEURGBP Short Bu SMC Structure On HFT. Price On Bearish Mood, So we Trade The Trend Wave.

GBPUSD ShortGBPUSD Is BUllish On 4H HTF By {SMC} Structure, But I'M Shorting Cause The 1H And M15 Is Bearish So I wanna Trade The Internal Structure.

Wave structure of DXY in time frame M15, 4HDay uptrend -> pullback is bearish
4H dowtrend -> pullback is bearish
M15 Uptrend-> current is bullish
The price increased and broke through the strong swing high, so in the M15 time frame it turned into an uptrend
life cycle of the wave structure
Day is uptrend => 4H is dowtrend => M15 is uptrend => 4H is uptrend => Day Uptrend

XAUUSD: 15 MINT $2090 Target! Gold consolidated and distributed successfully though price have dropped after we still it was a retest to take the price upwards of $2090 which remain a key area. Please use accurate risk management and this idea comes with higher risk, do your own research and only take if you agree with our bias.
Good Luck

Wave structure of XAUUSD at 15M timeframeThe 15 minute time frame is trending down
Currently it is an internal wave.
We watch the structure develop, can only look for sell-off opportunities when the strong i-Swing bottom is broken

GBPUSD Continuing Bullish Momentum?The daily is still in a bullish pullback and it will probably continue to move upwards until it finds a strong supply area. Most likely at the 1.28500 area.
We can take advantage of this move by looking at the LTF and finding demand areas so we can take longs from.

Wave structure of AUDUSD in 15M, 4H time frame4H is uptrend => current is impulse
15M is uptrend -> current is impulse
The current price is in the supply zone of the daily time frame, so there is a high possibility of a pullback wave of the 4H frame.
We wait for the wave structure to develop and give the CHOCH breakout signal

Wave structure of XAUUSD in 4H, 15M, 5M time frames4H is uptrend => current is correction
15M is dowtrend => current is conrrection
5M is uptrend => current is correction
If the 5M time frame breaks the strong Swing, then we will look for an opportunity to sell down

Gold Process, we follow the institutional playersAfter a really good reaction in the OB H1, there might be a good opportunity to sell with a new Bos or witness a significant expansion, but I'm still convinced we are bullish. He possible to Hit the LRLR.
We need to wait for the market to open to assess the situation.

EURUSD sell trade ideaI am going to sell EurUsd around 1.03 price level. Entry is based on the 5 min chart. Looking to take out the 1.01 liquidity. I will update my entry and stop loss here!

Wave structure of DXY analyzed in multiple time framesDay uptrend -> correction
4H dowtrend -> impulse
5M/15M dowtrend -> impulse
We can only buy when the strong swing of the 5M time frame is broken

Wave structure of XAUUSD analyzed in multiple time frames4H is uptrend => current is correction
15M is dowtrend => current is conrrection
5M is uptrend => current impulse
We can only sell down when the Swinglow of the 5M time frame is broken through

Wave logic analysis of multi-timeframe DXYDay is uptrend -> current is correction
4H is dowtrend -> current is impulse
5M/15M is dowtrend -> current is impulse
Wave 5M/15M reversal increases when the reversal peak is broken. Then the 4H wave is a corrective wave, the price increases back to the Swing High level of the 4H time frame.
If the high of the 4H timeframe is broken, the price will rise back to the swing high of the daily timeframe.

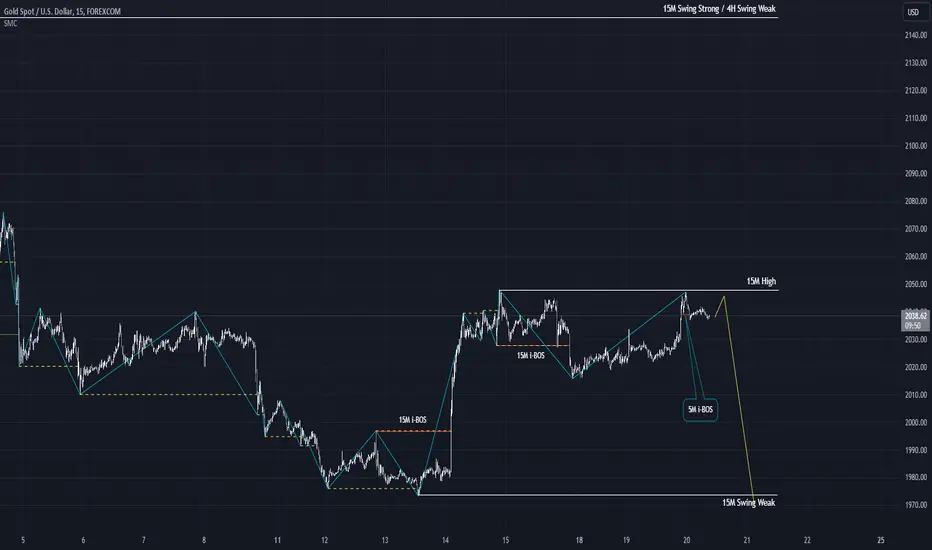
XAUUSD wave structure in 15M timeframe- 4H time frame uptrend
- 15M time frame downtrend => currently pullback up
- 5M time frame downtrend => current pullback up
- The price dropped and broke through the bottom of 5M, creating an i-BOS signal signaling the end of the pullback wave of 5M.
- The 15M and 5M time frames end the pullback wave, with a high possibility that the price will fall to the weak swinglow of the 15M time frame.
GBPUSD → 4H Bullish Continuation SETUP (SMC ANALYSIS)We are closely monitoring a potential buying opportunity around the POI zones.

CADJPY Sell Setup R:R:1:11This is for short term
Marked Possible Sell zone
Once Reached Entry zone Look for Liquidity sweep and BOSin LTF then Enter
And this is risky too.
Please DYOR before entering the trade.

GBPUSD wave structure in 4H time frame-The daily timeframe is in a downtrend, currently a bullish pullback wave
-The 4H time frame is in an uptrend, currently a bearish pullback wave
-15M time frame is in an uptrend, currently a bearish pullback wave
-15M and 4H have the same downtrend.
-If the Swing Low of the 15M timeframe is broken. We look for opportunities to sell down

BTC wave structure 4H time frameBTC wave structure 4H time frame
The 4H time frame is currently a pullback wave
The 15M timeframe is in a downtrend.
The 5M time frame is the pullback wave of the downtrend
We only have a chance to buy when the 5M time frame turns to an uptrend


Gold's wave structure in the 4H time frameThe 15M timeframe is in a downtrend.
We wait for the 15M pullback to end and the price to drop to the strong Swinglow of the 4H timeframe


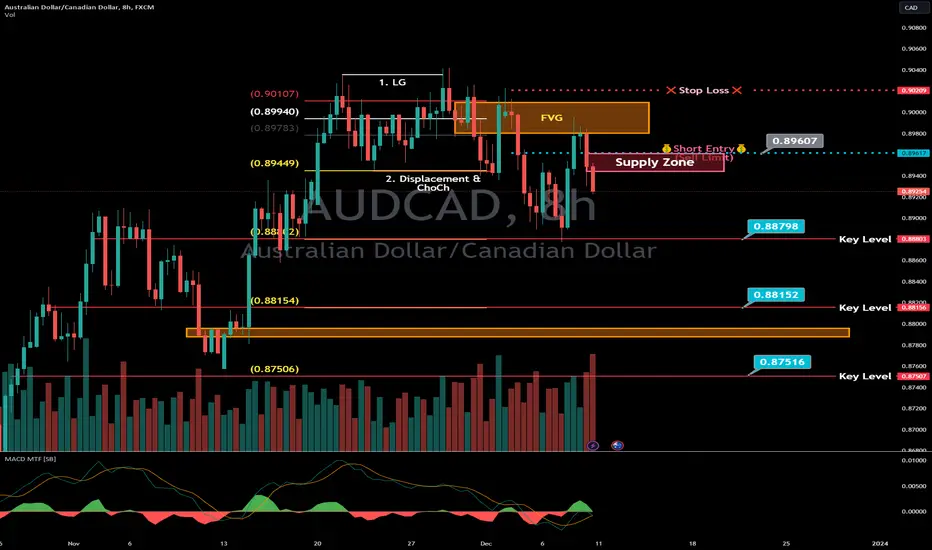
Reeling in Profits: A Comprehensive Guide to Short AUDCAD🚩 New Signal Notification - Swing Trade
📣 Attention Traders! 📈🔍
🔹 AUDCAD, Short when Pullback to Supply Zone 🔹
📊 Here are the key points for a potential trading opportunity in AUDCAD:
🔹 AUDCAD, 8H, ICT Short setup🔹
From our AI screener, we found CAD in Daily chart timeframe is going to Strong side right after the BoC Interest Rate Decision on 6th Dec, 2023 which made CAD pairs got 8H ICT, Short setup.
Here we bring you a great chance to watch and earn!
The Bank of Canada (BOC) has decided to keep the interest rate at 5% for the third consecutive decision, as expected. The short-term interest rates are the primary factor in currency valuation, and a higher than expected rate is positive/bullish for the CAD, while a lower than expected rate is negative/bearish for the CAD. The BOC’s tone of the statement hints that there will be no rate hikes in the near future. So, if you’re planning to invest in CAD, this is a good time to do so! 💰💸
TA:
By simple ICT setup, we found there is a ICT Short setup in timeframe 8H.
Last week, 8H bar highs were rejected from the fair very gap (FVG) and formed a Lower High
Our idea to the next support levels below as shown.
AUDCAD is one of our focus this week, Only Short strategy, may be landing slowly to the support levels
Target 1↘️ 0.8879
Target 2↘️ 0.8815
Target 3↘️ 0.8752
🔔Short entry near this Supply Zone: 0.8960 to 0.8945
Keep a close eye on these levels and trends in AUDCAD for potential
trading opportunities. Remember to manage your risk and trade
responsibly!
✅ Stay tuned for more updates and analysis. Happy trading! 🚀💰