GBPJPYThe descending blue and red range is a long linear regression broken in the purple rectangle!
This is a good sign for the price to rise, but there are also many signs of a decline.
The red rectangle is strong resistance!
The white dot is a short-term linear regression! The price is in its possible resistance.
And these are two strong signs that prices are falling!
You can follow the price of oil! Rising oil prices are not having a good effect on the Japanese economy! And it can break the resistance, but oil is also close to the resistance levels!
You also have to wait until the end of the week and assess the market conditions this week. If the candle succeeds in breaking the range, it means that the price will go up! But my prediction is that the resistance will not be broken and the price will go back down!
what is your opinion? Green or red route?
SNR

GBPNZD longThe green area is a very important area! Which is broken and now we are back to it!
The line that changes color from blue to black is Magic Trend indicator, which is now blue and looks upward.
The green dotted line is a strong support! Which is accompanied by strong volumetric support on January 7 (purple circle).
The red dotted line is a strong resistance line that has been broken since the beginning of the week! another sign of higher prices in near future!
The red line marked below the red highlight range is a deviation of 2 from the regression line that has been valid since mid-2016, and breakout has been clearly unsuccessful!
Everything seems to be ready for the pair to climb, but people who depend on candle approval in their strategy can wait for candle confirmation!


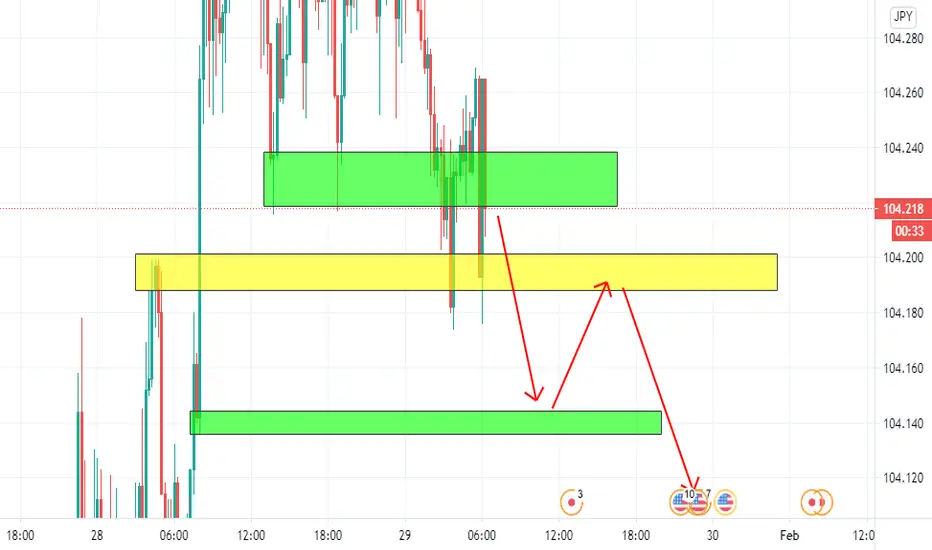
USDJPY SHORT SCALPPrice will retest green zone, then pullback to yellow zone . Then will break green zone. Just my 0.02usd idea .
idea about gbpnzd , any question or education can pm 0137282799i think gbpnzd will retest my zon , sl can take 15 pips from zon oke!!! pm me 0137282799 for any question

HERE WE THE ZONE!I recommended for all of us to see this marked zone-level by me. After the price been reached this area, you need to precise your price in lower time frame. Take care of your Money Management!


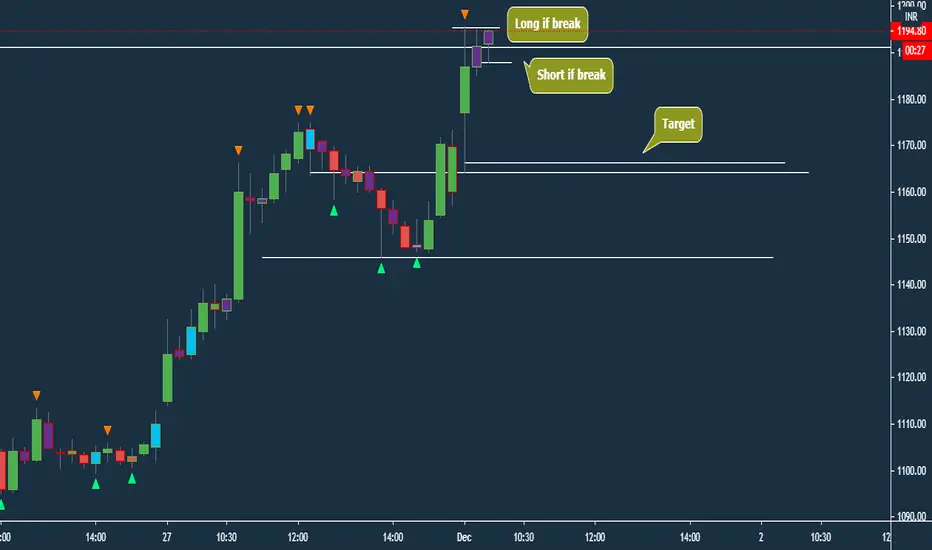
GodrejProp { INTRADAY }IB formed it can go both up & down . So, we'll do as price say's , rest is as per charts .
EU POSSIBLE FAKE OUT. GOOD RR!Hello. Currently we're watching EU price trying to make a possible fakeout move. The price already broke New R1 & New R2. At the moment. we're seeing that the price has already entered previous fakeout level (DAILY TF). It is still hi risk to enter the trade now, we have to wait for confirmation.
Cheers!

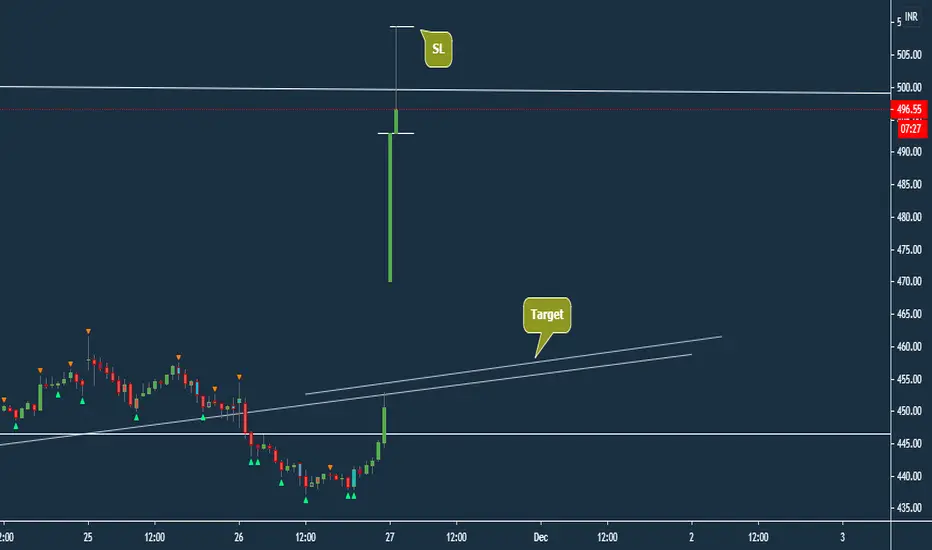
Escorts { 15 M Short }Forming Doji at support , where in D frame it's about to break Candle Low . Short as mentioned with SL at candle high .


