Solana | BULLISH ON SOL | SOL Dominates Blockchain RevenueEven with a dip in activity particularly around memecoins, Solana has managed to hold its ground impressively when it comes to generating revenue.
While you might think fewer transactions would automatically mean less money coming in, Solana's performance shows otherwise. This ability points to the solid value being created by the different applications and uses on the network right now.
A big reason for this financial resilience is the continued strength of dApps on Solana. These apps have been really effective at bringing in fees and adding value to the network. It seems that while the hype around certain speculative tokens has died down significantly, the core utility and economic activity within Solana's dApps are still going strong. This shift towards more fundamental uses for generating revenue is a really positive sign for how the network can keep growing in the long run.
Looking ahead the future for SOL is bright imo as more projects are linking Artificial Intelligence with Solana, taking advantage of its speed and low costs to build new things. Plus, the introduction of Solana ETFs in Canada is a big step.
Other Solana-based alts including Official Trump (TRUMP), Jupiter (JUP), Raydium (RAY), and Bonk (BONK), have followed SOL with good price increases.
It seems like the focus is shifting towards building more lasting and useful applications. With ongoing support for developers and increasing interest from the traditional financial world, Solana seems well-positioned to handle market ups and downs and keep finding new ways to create value in the future. I'll definitely be watching to accumulate for the long-term.
______________________________
BINANCE:SOLUSDT
Solana

Setup: Long on SOL/USDT🚀 Setup: Long on SOL/USDT Perpetual (15m timeframe)
📈 Context:
Strong divergence between Perp CVD (down) and Spot CVD (up).
_Top Traders accumulating long positions.
_Open Interest stable to slightly rising.
_More than 90% of positions are short — strong imbalance favoring a squeeze.
🎯 Trade Plan:
_Entry: around 148.20 USDT
_Stop-Loss: 145.70 USDT
_TP1: 150.38 USDT (partial profit)
_TP2: 152.30 USDT (full close)
🧠 Notes:
Plan to secure partial profits at TP1.
Will monitor for continuation if breakout occurs.

Why Solana (SOL) might correct to the $75–$85 range?Let’s break down why Solana (SOL) might correct to the $75–$85 range, considering fundamental factors, news, events, technical analysis, Coinbase orders, and on-chain activity.
Fundamental Factors
Solana is a high-performance blockchain known for its speed and low fees. However, in 2024–2025, it faces several challenges that could impact its price. One of these challenges is the phenomenon of meme tokens, often referred to as the " Meme Casino ," which has become a significant part of Solana’s ecosystem.
1. Decline in DeFi, NFT, and Meme Token Activity
Solana has been widely used for DeFi and NFT projects and has established itself as the leading blockchain for meme tokens. However, in 2024–2025, these sectors are experiencing a downturn. For instance, NFT trading volume and DeFi activity on Solana have significantly dropped compared to their peak levels in 2021–2022. Interest in meme tokens like BONK, which temporarily boosted demand for SOL, may also fade due to the volatility of this market. This reduces the demand for SOL tokens for transactions within the ecosystem, putting downward pressure on the price and diminishing the token’s fundamental value.
2. Competition from Other Blockchains
Solana competes with networks like Ethereum (following the Ethereum 2.0 upgrade and the introduction of sharding), Arbitrum, Optimism, and newer players such as Sui and Aptos. These blockchains also offer high performance and low fees, potentially drawing developers and users away from Solana and reducing interest in SOL.
3. Regulatory Risks
In 2024–2025, regulators worldwide, particularly in the U.S., are tightening control over cryptocurrencies. Meme tokens, which drive a significant portion of Solana’s activity, are often associated with scams. I believe that 99.999% of meme tokens are scam coins, and this could lead to regulatory actions that harm the meme sector on Solana. Since Solana heavily relies on this sector, the price of SOL could plummet to levels like $2–$11.
4. Declining Interest in Meme Tokens on Solana
In 2023–2024, meme tokens like BONK temporarily increased Solana’s popularity and demand for SOL. However, in 2025, this hype may fade, as the meme token market is prone to sharp rises and falls. This could reduce network activity and, consequently, the price of SOL. In other words, "the music is slowly fading."
Technical Analysis
On the provided SOL/USDC chart (5-day timeframe), several key points support the idea of a correction to the $75–$85 range:
➖ Volume Profile
On the right side of the chart, the volume profile shows a significant trading volume (a thick zone) in the $75–$85 range. This indicates strong support, making it a likely area for the price to return to due to high liquidity.
➖ Trend Structure
The chart shows signs of a slowing uptrend: shorter upward impulses and increasing volatility (short candles with long wicks). This could signal a reversal or the start of a correction.
➖ Correction Target: $75–$85 Zone ("Coinbase Orders")
The $75–$85 range, marked as "Coinbase orders," is a support zone with limit buy orders. For example, on Coinbase alone, there are orders for 44,419 SOL worth $3,553,520. Similar orders may exist on other exchanges like Binance, Kraken, OKX, and others, creating a strong demand zone.
➖ Hyperliquid Liquidation Map
According to the Hyperliquid Liquidation Map, the $75–$85 range contains liquidation levels for long traders. A drop to this level could trigger a cascade of liquidations, intensifying the downward move but also attracting buyers looking for an entry point.
What Event Could Trigger a Correction?
An expected correction in Bitcoin to the $70,000–$76,000 range could act as a trigger for Solana and other cryptocurrencies to fall, as the altcoin market often follows BTC.
===
I believe this will be the last corrective bounce for cryptocurrencies, synchronized with a bounce in the S&P 500. After that, I expect all markets to enter a deep decline.
🤔🤔🤔

Support around 148.18 is important
Hello, traders.
If you "Follow", you can always get new information quickly.
Please click "Boost" as well.
Have a nice day today.
-------------------------------------
(SOLUSDT 1D chart)
The OBV Line indicator on the 1M chart is formed at the 148.18 point.
Therefore, the key is whether it can be supported around 148.18 and rise above the M-Signal indicator on the 1W chart.
If not, and it falls, you should check whether it is supported near the M-Signal indicator on the 1M chart.
-
Since the M-Signal indicators of the 1D, 1W, and 1M charts are converging, I think the current location is an important support and resistance zone.
-
If it continues to rise, there is a possibility that it will touch the HA-High indicator point of the 1D chart, which is around 225.0.
However, since the HA-High indicator of the 1M chart is formed at the 179.74 point, we need to see if it can break through this area upward.
-
Since the StochRSI indicator is in the overbought zone, even if it rises further, it will eventually show a downward trend.
We need to create a response strategy by keeping this in mind.
In other words, we need to check whether the price is maintained above the M-Signal indicator of the 1D chart or above the M-Signal indicator of the 1W chart and create a response strategy.
-
Thank you for reading to the end.
I hope you have a successful transaction.
--------------------------------------------------
- Explanation of the big picture.
I used TradingView's INDEX chart to check the entire range of BTC.
I rewrote it to update the previous chart by touching the Fibonacci ratio range of 1.902 (101875.70) ~ 2 (106275.10).
(Previous BTCUSD 12M chart)
Looking at the big picture, it seems to have been maintaining an upward trend following a pattern since 2015.
In other words, it is a pattern that maintains a 3-year upward trend and faces a 1-year downward trend.
Accordingly, the upward trend is expected to continue until 2025.
-
(Current BTCUSD 12M chart)
Based on the currently written Fibonacci ratio, it is displayed up to 3.618 (178910.15).
It is expected that it will not fall again below the Fibonacci ratio of 0.618 (44234.54).
(BTCUSDT 12M chart)
Based on the BTCUSDT chart, I think it is around 42283.58.
-
I will explain it again with the BTCUSD chart.
The Fibonacci ratio ranges marked in the green boxes, 1.902 (101875.70) ~ 2 (106275.10) and 3 (151166.97) ~ 3.14 (157451.83), are expected to be important support and resistance ranges.
In other words, it seems likely that they will act as volume profile ranges.
Therefore, in order to break through these ranges upward, I think the point to watch is whether they can receive support and rise near the Fibonacci ratios of 1.618 (89126.41) and 2.618 (134018.28).
Therefore, the maximum rising range in 2025 is expected to be the 3 (151166.97) ~ 3.14 (157451.83) range.
In order to do that, we need to see if it is supported and rises near 2.618 (134018.28).
If it falls after the bull market in 2025, we don't know how far it will fall, but based on the previous decline, we expect it to fall by about -60% to -70%.
Therefore, if it starts to fall near the Fibonacci ratio 3.14 (157451.83), it seems likely that it will fall to around Fibonacci 0.618 (44234.54).
I will explain more details when the bear market starts.
------------------------------------------------------

Brett: Your Altcoin ChoiceA Solana memecoin, Brett produced a year long higher low with the classic ending diagonal pattern to signal an upcoming trend reversal.
The first low happened in April 2024. The second and higher low this month, this week, 7-April 2025.
The chart dynamics are very simple. Are you wondering, is the timing right? Right for a buy, maybe. Right to hold or, will a reversal happen soon?
The answer is positive to all those questions.
The time is right and is also ripe for a reversal to take place. This is the best possible time right now to buy and hold. The market must be bought when prices are low and red. This is the situation with the chart today. Prices are low and red but ready to turn. All the early signals are in.
BRETTUSDT is showing potential for a strong bullish wave in the coming months. Being new and also trading at bottom prices, growth can go off the chart. I will not be surprised when this pair goes beyond the 1,115% shown on the chart, this target is based on the mid-term.
The first target can reach 415%.
This is an easy chart. This is an easy trade.
I don't like memecoins, but it is not about what I like, it is about what the chart says.
The chart says that this pair is bullish with huge potential for growth. If you like it, feel free to enter with force. The Cryptocurrency market is turning bullish now and this and other pairs are sure to grow.
Thanks a lot for your continued support.
Your timing is great. A good Altcoin Choice.
Namaste.

$SOL one more leg lower to $64-80Even though CRYPTOCAP:SOL has bounced nearly 50% from the bottom, the fall isn't over yet.
If we look at the chart, we can see that Solana has only fallen 4/5 waves down and it's the last leg down that will be painful for most.
Everyone is long again calling for new highs, yet the chart is still bearish.
I think it's likely that price retraces from around this level and falls down to the lower supports at $64-80.
Once we hit that region, it'll setup a good trade for the long term.

Solana - This just faked out literally everybody!Solana - CRYPTO:SOLUSD - just faked out literally everybody:
(click chart above to see the in depth analysis👆🏻)
Over the course of the past 25 days, Solana dropped a significant -30% and wiped out a ton of bulls before creating a complete reversal. Especially with the current horizontal support level, bulls are taking over again, offering us another major crypto trading opportunity.
Levels to watch: $120, $250
Keep your long term vision!
Philip (BasicTrading)

Breaking: $PENGU Spike 33% Today Gearing For Another Leg UpThe price of Pudgy Penguins ( CSECY:PENGU ) a solana based NFT platform similar to Magic Eden saw notable uptick of 33% today, reclaiming $600 million market amidst breaking out of prolong oversold levels.
About
PENGU is the official coin of Pudgy Penguins.
Pudgy Penguins has become the face of crypto with one of the most influential communities in the industry. From large companies wearing the Penguin, to being featured in ETF commercials, to garnering millions of followers and over 50 billion views, the Pengu has become a cultural icon.
Technical Outlook
Since listing, CSECY:PENGU has seen a notable uptick of +2,000% before sharply consolidating losing about 94% of market value. Present market metrics hints at a possible move to the $0.0266 resistant point and a break above the ceiling of that pivot would spark a move to the ATH recorded.
With the RSI at 73, CSECY:PENGU is looking to capitalize on the dip and make a comeback, with all present metrics hinting at a bullish reversal to the ATH territory.
Pudgy Penguins Price Data
The Pudgy Penguins price today is $0.008763 USD with a 24-hour trading volume of $379,038,248 USD. Pudgy Penguins is up 31.78% in the last 24 hours. The current CoinMarketCap ranking is #107, with a market cap of $550,838,659 USD. It has a circulating supply of 62,860,396,090 PENGU coins.

SOL / USDT Update - Breakout in Play! Check out the 1H chart for SOLUSDT. Solana is showing strength in a rising channel, with a recent breakout from a symmetrical triangle to support at $150.
If we break to $165, we could see a strong move higher. But if rejected, watch for a pullback to $150 or lower.
What’s your take?

Is a great time for holding Solana?!Hello guys!
What I see:
Ascending Channel: Price has been moving inside a clearly defined upward-sloping channel since the start of 2023, showing a strong long-term uptrend.
33% Correction: Recently, SOL experienced a 33% correction from its local high, testing the previous breakout zone (highlighted in light blue). This area has now acted as a strong support.
Bullish Signal: Price is attempting to reclaim and close above a key horizontal resistance level (~$132), noted by the text: “If the price closes above this level, then buy it.” A close above this level would confirm a bullish reversal and suggest strength returning to the trend.
RSI Outlook: The RSI indicator at the bottom shows a potential reversal from the lower range, indicating possible bullish momentum building.
Projection: If the price successfully closes above the mentioned resistance zone, the structure supports a potential move toward a new high, as marked by the arrow pointing toward the upper channel boundary (above $250 and potentially up to $300+).

Solana: More RoomSolana’s countermovement of the green wave 4 has some more room on the upside. Once the wave-4-top is established (below the resistance at $192.33), we primarily anticipate a wave 5 sell-off down into the blue Target Zone on the downside (coordinates: $56.56 – $29.87). In this range, the wave (ii) corrective movement should conclude, and the altcoin should start the next sustainable upward impulse. However, if the price rises above the mentioned $192.33 mark during the current upward movement (36% likely), this will suggest that the low has already formed via wave alt.(ii) in blue.

SOL in coming weeksThe SOL will increase $150 and reach to the top of the wedge in the coming weeks .
Give me some energy !!
✨We spend hours finding potential opportunities and writing useful ideas, we would be happy if you support us.
Best regards CobraVanguard.💚
_ _ _ _ __ _ _ _ _ _ _ _ _ _ _ _ _ _ _ _ _ _ _ _ _ _ _ _ _ _ _ _
✅Thank you, and for more ideas, hit ❤️Like❤️ and 🌟Follow🌟!
⚠️Things can change...
The markets are always changing and even with all these signals, the market changes tend to be strong and fast!!

SOL/USDTInitially, there is a level, there is also a liquidity removal.. but I would like to show you the indicator that I came up with and prescribed and how it works. Thank you all so much!

Solana structur-update ElliotWaveBINANCE:SOLUSDT
I'm still anticipating the same pattern; the only change is an additional high in wave 3.

Solana – Bear Market Rally or Reversal?Like the rest of the crypto market, Solana started rebounding on April 8th, pushing more than 50% up from the recent lows. But just like with many altcoins, I'm not convinced this is a true trend reversal. Instead, it looks more like a classic bear market rally.
Let’s not forget: SOL is coming down from nearly $300. A bounce from $95 to $150 is strong, yes—but in the bigger picture, it’s still just a correction.
📍 Key resistance zone: $160–$170
As long as price remains under this zone, the probability of another leg down remains high.
🧠 My plan:
If Solana creates a new local high around $160, I’ll be looking to sell into the rally.
🎯 Target:
$100 at least, depending on how the market reacts.

Solana H4 | Potential bearish breakoutSolana (SOL/USD) is falling towards a potential breakout level where the price could fall lower from here.
Sell entry is at 144.76 which is a potential breakout level.
Stop loss is at 155.00 which is a level that sits above a multi-swing-high resistance.
Take profit is at 122.72 which is an overlap support that aligns close to the 50.0% Fibonacci retracement.
High Risk Investment Warning
Trading Forex/CFDs on margin carries a high level of risk and may not be suitable for all investors. Leverage can work against you.
Stratos Markets Limited (tradu.com):
CFDs are complex instruments and come with a high risk of losing money rapidly due to leverage. 63% of retail investor accounts lose money when trading CFDs with this provider. You should consider whether you understand how CFDs work and whether you can afford to take the high risk of losing your money.
Stratos Europe Ltd (tradu.com):
CFDs are complex instruments and come with a high risk of losing money rapidly due to leverage. 63% of retail investor accounts lose money when trading CFDs with this provider. You should consider whether you understand how CFDs work and whether you can afford to take the high risk of losing your money.
Stratos Global LLC (tradu.com):
Losses can exceed deposits.
Please be advised that the information presented on TradingView is provided to Tradu (‘Company’, ‘we’) by a third-party provider (‘TFA Global Pte Ltd’). Please be reminded that you are solely responsible for the trading decisions on your account. There is a very high degree of risk involved in trading. Any information and/or content is intended entirely for research, educational and informational purposes only and does not constitute investment or consultation advice or investment strategy. The information is not tailored to the investment needs of any specific person and therefore does not involve a consideration of any of the investment objectives, financial situation or needs of any viewer that may receive it. Kindly also note that past performance is not a reliable indicator of future results. Actual results may differ materially from those anticipated in forward-looking or past performance statements. We assume no liability as to the accuracy or completeness of any of the information and/or content provided herein and the Company cannot be held responsible for any omission, mistake nor for any loss or damage including without limitation to any loss of profit which may arise from reliance on any information supplied by TFA Global Pte Ltd.
The speaker(s) is neither an employee, agent nor representative of Tradu and is therefore acting independently. The opinions given are their own, constitute general market commentary, and do not constitute the opinion or advice of Tradu or any form of personal or investment advice. Tradu neither endorses nor guarantees offerings of third-party speakers, nor is Tradu responsible for the content, veracity or opinions of third-party speakers, presenters or participants.

$136 Resistance Crumbles: Solana Bulls Take the Lead...Solana Breaks Key Resistance – Eyes Set on $150 and $180 Targets
Solana (SOL) has successfully broken through the strong resistance level at $136 after several failed attempts, signaling a potential continuation of its current uptrend. This breakout marks a significant technical milestone for SOL, which had previously struggled to maintain momentum above this price zone.
If Solana is able to hold above the $136–$137 level, it could open the door for further gains, with short- to mid-term price targets around $150 and $180. The breakout aligns with broader bullish sentiment in the crypto market and may attract new buyers looking to ride the trend.
For traders or investors interested in entering a position, the $136–$137 range could offer a potential entry point, provided the breakout holds and is supported by volume. As always, proper risk management is recommended, and watching for confirmation on the next few candles could be key.

$BONK: Prepping for a Potential Explosive Move🚀 SEED_DONKEYDAN_MARKET_CAP:BONK : Prepping for a Potential Explosive Move
SEED_DONKEYDAN_MARKET_CAP:BONK is known for its wild, high-volatility pumps—and we may be approaching another one.
After a significant bearish divergence on the daily chart, SEED_DONKEYDAN_MARKET_CAP:BONK has retraced to levels lower than last year. However, it's important to remember: SEED_DONKEYDAN_MARKET_CAP:BONK is the original meme coin of the Solana ecosystem, and it's strongly supported by Solana whales.
📈 If CRYPTOCAP:SOL rallies, SEED_DONKEYDAN_MARKET_CAP:BONK usually follows.
While a new all-time high might be out of reach in the short term, a significant move to the upside is on the table. Here's why:
✅ RSI is rising, forming a bullish divergence
✅ Price has entered my 2025 buy zone
✅ MACD has just crossed bullish on the 1D timeframe
✅ Volume is low, often a precursor to explosive moves
✅ CRYPTOCAP:OTHERS index is showing signs of strength—altcoin momentum is building
🧠 If momentum picks up, we could see a 2x to 3x move from current levels.
📌 Keep an eye on this one. As always, DYOR.
#BONK #Solana #MemeCoin #Altcoins #CryptoTrading #CryptoSignals #BONKArmy #MACD #RSI #DYOR #Altseason #CryptoAnalysis

SOLUSDT SOLUSDT Analysis 📊
🔹 Support Levels: 118, 112, and 107 USD
🔹 Resistance Levels: 130 and 150 USD
✅ The price has reacted positively after testing the 118-112 USD support zone, showing a short-term bullish move with increasing volume.
📉 If the price fails to break 130 USD, a pullback to 118 USD is possible.
📈 A breakout above 130 USD could pave the way for a move toward 150 USD.
🔍 Conclusion: The bullish trend remains unconfirmed until 130 USD is broken.


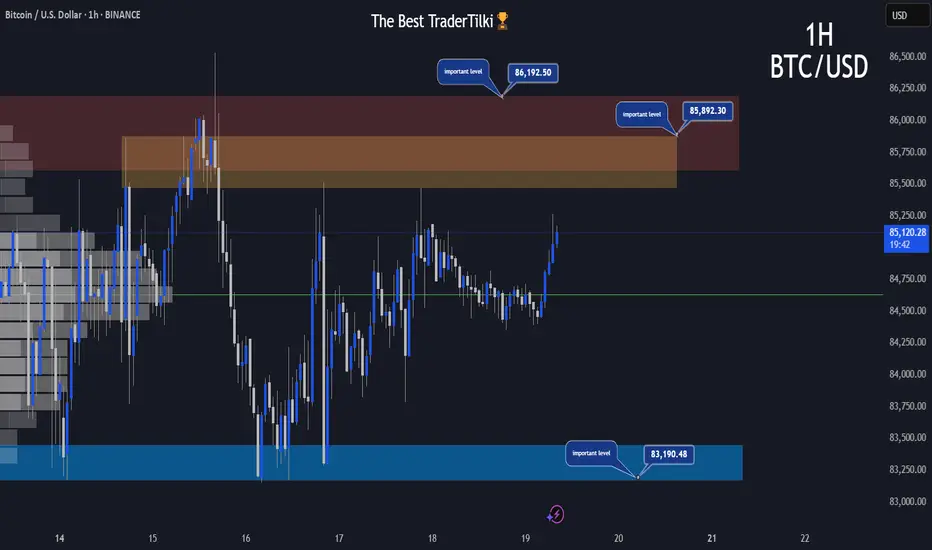
BTCUSD | 1H | IMPORTANT LEVELSHey There;
I’ve prepared a fresh Bitcoin analysis just for you.📈
Key resistance levels for Bitcoin are 85,892.00 and 86,192.00, while the support level stands at 83,190.00.⚠️
If Bitcoin breaks above the 86,192.00 level, the next target could be around 88,860.00.📣
I truly care about you all, and keeping you informed is something I see as my responsibility.🥰
Wishing you an amazing day ahead!💙
$SOL - Pullback to $120 Likely?Solana recently rebounded from a key higher-timeframe support level. However, a short-term pullback to around $120 could be on the horizon before any significant upward move.
For a short-term outlook, check this video.

SOLANA has obliterated ETHERIUM in this bull market.We now know that approximately 70% of all daily blockchain fees are collected on Solana chain. This reminds us of Etherium in the previous cycle. Solana's being faster and cheaper, ETH L2's cannibalizing their mother chain in activity and fees, and complexity of execution in Etherium chain might be seen as the main reasons here (please comment if any more).
When we look at the price action, we see that CRYPTOCAP:SOL has outvalued CRYPTOCAP:ETH 1200% since the start of 2023. The interesting fact is that this uptrend has been intact since then. While ETH maxis, like a religious revelation, claim that ETH will rise from its ashes and beat BTC eventually, the fundamentals and technicals do not support this idea. I predict that unless dramatical fundamental changes happen, this trend will continue throughout the final stages of this bull market. So I continue to be long SOLETH
