SOL LIVE TRADEHello dears
Given the price support by buyers and the formation of higher ceilings and floors, we can open a trade with risk and capital management.
*Trade safely with us*
SOLUSDTPERP

Solana Price Target: Expert Predicts $180–$200 BreakoutSolana Price Target: Expert Predicts $180–$200 BreakoutSolana (SOL), one of the most prominent blockchain platforms in the cryptocurrency market, has been on a tear recently, with its price rallying significantly. As of today, Solana’s bullish momentum has caught the attention of investors and analysts alike, with many predicting a breakout to the $180–$200 price range. This optimistic outlook comes on the back of strong technical indicators, increasing adoption, and improving fundamentals.
In this article, we’ll explore the key factors driving Solana’s price rally, analyze expert predictions, and assess whether SOL can sustain its upward trajectory to hit the $200 mark.
________________________________________
Solana’s Recent Rally: A Snapshot
Solana has seen a remarkable recovery in recent weeks, with its price climbing steadily after periods of consolidation and minor corrections. The blockchain platform, known for its high-speed transactions and low fees, is once again making waves as it captures investor interest.
Key Highlights of the Rally:
1. Price Momentum: Solana’s price surged by over 30% in the last week, breaking past key resistance levels and positioning itself for further gains.
2. High Trading Volumes: The rally has been accompanied by a significant increase in trading volumes, indicating strong market participation.
3. On-Chain Activity: Solana’s on-chain activity has also spiked, with rising transaction counts and growing usage of decentralized applications (dApps) on its network.
These developments underscore the growing confidence among investors and the sustained demand for Solana’s ecosystem.
________________________________________
What’s Driving Solana’s Price Surge?
The ongoing rally in Solana's price is being fueled by a combination of technical, fundamental, and macroeconomic factors. Let’s take a closer look at these drivers:
1. Strong Technical Indicators
Technical analysis suggests that Solana’s price is in a bullish breakout phase. Analysts have pointed to several key technical patterns that support the prediction of a move toward $200:
• Ascending Triangle Pattern: Solana’s price chart shows an ascending triangle formation, a bullish continuation pattern that typically signals a breakout to higher levels.
• Support and Resistance Levels: SOL recently broke through the $150 resistance level, which had previously acted as a key barrier. With this resistance now flipped into support, the path to $180–$200 becomes more feasible.
• Moving Averages: Solana’s price is trading well above its 50-day and 200-day moving averages, a classic bullish signal that indicates strong upward momentum.
2. Ecosystem Growth
Solana’s ecosystem has been expanding rapidly, with an increasing number of developers and projects choosing its blockchain for their applications. Key areas of growth include:
• DeFi Expansion: Solana has become a hub for decentralized finance (DeFi) projects, with platforms such as Raydium, Serum, and Marinade gaining traction.
• NFT Boom: The Solana blockchain has also emerged as a major player in the non-fungible token (NFT) space, hosting popular marketplaces like Magic Eden and SolSea.
• Gaming and Web3: Solana’s high-speed, low-cost infrastructure makes it an ideal platform for blockchain-based gaming and Web3 applications.
This growing ecosystem contributes to increased demand for SOL tokens, driving up their value.
3. Institutional Interest
Institutional investors have been steadily increasing their exposure to Solana. This trend is evident from the inflows into Solana-based investment products and the growing number of hedge funds and venture capital firms backing Solana projects.
Notably, Solana’s ability to process thousands of transactions per second at a fraction of the cost of Ethereum has made it an attractive alternative for institutional use cases.
4. Favorable Market Conditions
The broader cryptocurrency market has also been in a recovery phase, with Bitcoin, Ethereum, and other major cryptocurrencies rallying. This positive market sentiment has spilled over into Solana, amplifying its price gains.
Additionally, the macroeconomic environment—characterized by easing inflation concerns and renewed interest in risk assets—has created a conducive environment for cryptocurrencies to thrive.
________________________________________
Expert Predictions: $180–$200 Breakout
Several experts and analysts have weighed in on Solana’s price trajectory, with many predicting a move to $180–$200 in the near term. Here are some of the most notable predictions:
Technical Analysts See Bullish Patterns
Prominent cryptocurrency analysts have pointed to bullish technical patterns that suggest Solana could soon reach $200. For instance:
• Ascending Triangle Target: Based on the ascending triangle pattern, the measured move suggests a price target of $190–$200.
• Fibonacci Retracement Levels: Analysts using Fibonacci retracement levels have identified $180 and $200 as key levels of interest.
Institutional Analysts Eye $200
Institutional analysts have also expressed optimism about Solana’s price potential. A recent report by a leading investment firm highlighted the following factors supporting a $200 price target:
• Increasing adoption in the DeFi and NFT sectors.
• Strong developer activity on the Solana blockchain.
• Growing institutional inflows into Solana-based products.
Community Sentiment
The Solana community remains highly bullish, with many investors and enthusiasts sharing optimistic price targets on social media platforms. This positive sentiment often serves as a self-reinforcing mechanism, attracting more buyers and driving up the price.
________________________________________
Challenges and Risks
While the outlook for Solana appears promising, it’s important to consider the potential challenges and risks that could impact its price trajectory:
1. Competition from Ethereum and Layer-2 Solutions
Ethereum’s transition to Proof of Stake (PoS) and the rise of Layer-2 scaling solutions like Arbitrum and Optimism could pose challenges to Solana’s market share. These competitors are addressing scalability issues, reducing the competitive advantage that Solana has traditionally enjoyed.
2. Network Outages
Solana has faced criticism for network outages in the past, which have raised concerns about its reliability. Any future outages could undermine investor confidence and slow adoption.
3. Regulatory Uncertainty
The cryptocurrency market remains highly sensitive to regulatory developments. Unfavorable regulations targeting DeFi, NFTs, or blockchain technology could negatively impact Solana and the broader market.
4. Market Volatility
Cryptocurrencies are inherently volatile, and Solana is no exception. While the current rally is encouraging, sharp corrections are always a possibility, particularly if external factors such as macroeconomic events or market sentiment shift.
________________________________________
Can Solana Sustain Its Momentum?
For Solana to sustain its momentum and achieve the $200 price target, several factors need to align:
• Continued Ecosystem Growth: Solana must maintain its position as a leading platform for DeFi, NFTs, and Web3 applications. This requires ongoing innovation and developer support.
• Institutional Adoption: Increased participation from institutional investors will be critical to sustaining demand for SOL tokens.
• Positive Market Sentiment: The broader cryptocurrency market needs to remain in a bullish phase, providing a favorable backdrop for Solana’s price growth.
• Resolving Network Issues: Addressing concerns about network reliability and scalability will be key to maintaining investor confidence.
________________________________________
Conclusion
Solana’s recent rally and the expert predictions of a $180–$200 breakout highlight the growing confidence in its ecosystem and price potential. Driven by strong technical indicators, ecosystem expansion, institutional interest, and favorable market conditions, Solana appears well-positioned for further gains.
However, challenges such as competition, network reliability, regulatory risks, and market volatility remain. Investors should approach Solana with cautious optimism, balancing the bullish outlook with an awareness of the risks involved.
As Solana continues its upward trajectory, the $200 milestone could mark a significant achievement for the blockchain platform, solidifying its status as one of the leading players in the cryptocurrency space. Whether this rally leads to sustained growth or faces temporary setbacks, one thing is clear: Solana’s growing ecosystem and innovative technology make it a force to be reckoned with in the world of blockchain and decentralized applications.

SOLUSDT Reversal Brewing — Watch This Level or Get Wrecked!Yello Paradisers — Are you paying attention to #SOLUSDT? Because what’s forming right now isn’t just noise — it’s a high-probability reversal setup that could trap the late bulls or become the kind of move that sets the tone for the next few weeks. Either way, the next play is going to separate professionals from gamblers. Let’s talk.
💎#SOLUSDT has been printing textbook bearish price action for weeks — lower lows and lower highs on the major time frame. But something critical has just changed. A break in market structure has occurred, and we’ve now got a higher high. That’s your first probable signal that the tide may be turning. Now comes the most important test — can we form the higher low to confirm this shift?
💎What makes this setup even more interesting is that we’re not just seeing a random bounce. SOL is in the middle of potentially probable completing two major bullish reversal patterns — an inverse head and shoulders and a Quasimodo. The left shoulder and neckline are already locked in. The right shoulder? Still cooking. But here’s the thing — the previous resistance, which aligns perfectly with where the right shoulder could form, is lining up as a textbook retest zone. That means we could get the higher low right there, completing both patterns at once.
💎Right now, price is struggling against multi-timeframe resistance, and that’s exactly what we want. It increases the probability of a short-term pullback to the key zone — around 110.9 to 115 — before the real breakout happens. If that level holds, and we print a confirmed higher low, this whole setup becomes explosive.
💎First area of resistance sits at 153, but that’s just the appetizer. The main zone we’re looking at is 173 to 181. That’s the bigger move that this structure is potentially building toward. But let’s be clear — if SOLUSDT closes a candle below 110.9, the entire setup gets invalidated. That level is your line in the sand.
This is the kind of setup we live for — clean structure, clear invalidation, and serious upside potential. But don’t rush it. The market will reward the ones who wait, not those who chase. Let others panic. Let others fomo. You focus on execution.
Trade smart, Paradisers — and always remember, only a few will catch the real move. Be one of them.
MyCryptoParadise
iFeel the success🌴

SOL LONG AND SHORT OPPERTUNITYSOLUSDT chart shared with 4h time frame analysis, I am expecting price to go slightly up to invite late FOMO longers and then come down to hunt their stop losses, when price will come down and hunt stop losses of LONG traders then they will try to enter Short but here I am expecting price to come and fill SSL and FVG and then go LONG and target buy side liquidity and supply zone. This is my plan.

#SOL/USDT#SOL
The price is moving in a descending channel on the 1-hour frame and is expected to continue upwards
We have a trend to stabilize above the moving average 100 again
We have a descending trend on the RSI indicator that supports the rise by breaking it upwards
We have a support area at the lower limit of the channel at a price of 134
Entry price 137
First target 140
Second target 144
Third target 149

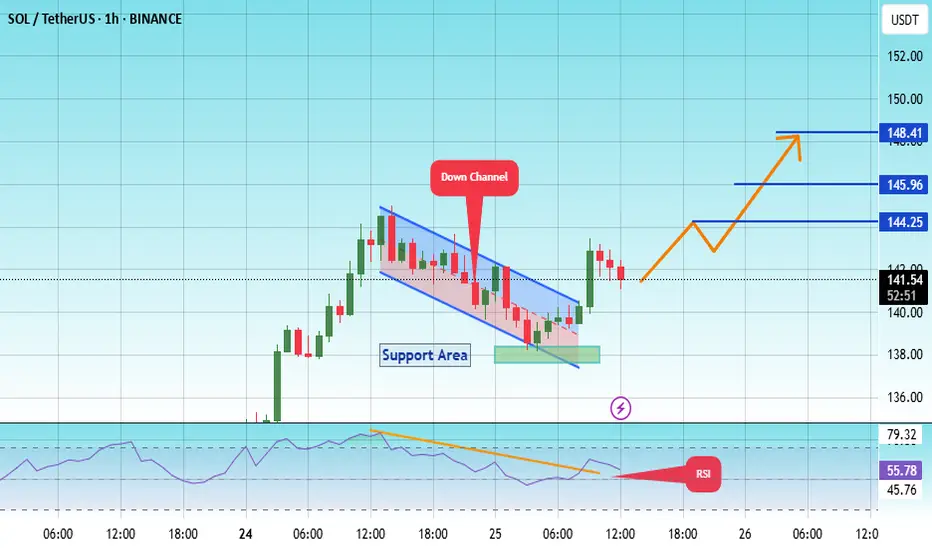
#SOL/USDT#SOL
The price is moving within a descending channel on the 1-hour frame, adhering well to it, and is heading for a strong breakout and retest.
We are seeing a bounce from the lower boundary of the descending channel, this support at 138.
We have a downtrend on the RSI indicator that is about to be broken and retested, supporting the upward trend.
We are looking for stability above the 100 moving average.
Entry price: 142
First target: 144
Second target: 146
Third target: 148
#SOL/USDT#SOL
The price is moving within a descending channel on the 1-hour frame and is expected to continue lower.
We have a trend to stabilize below the 100 moving average once again.
We have a downtrend on the RSI indicator that supports the upward move with a break above it.
We have a resistance area at the upper limit of the channel at 127.
Entry price: 126
First target: 124
Second target: 122
Third target: 119

SOL/USDT:BUYHello friends
Due to the price correction, we can buy in two specified areas in a stepwise manner, with capital and risk management.
*Trade safely with us*

SOLUSDT SOLUSDT Analysis 📊
🔹 Support Levels: 118, 112, and 107 USD
🔹 Resistance Levels: 130 and 150 USD
✅ The price has reacted positively after testing the 118-112 USD support zone, showing a short-term bullish move with increasing volume.
📉 If the price fails to break 130 USD, a pullback to 118 USD is possible.
📈 A breakout above 130 USD could pave the way for a move toward 150 USD.
🔍 Conclusion: The bullish trend remains unconfirmed until 130 USD is broken.

SOLUSDT heading towards resistance 180SOLUSDT has bounce from monthly support MS1. A weekly support marked as WS1 on the chart is also sitting just above it. Therefore, this zone 95-110 was a confluece of these support levels and a bounce was justified. Now the price is heading towards weekly resistance which is sitting around 165-180 zone. However, it is facing daily resistance DR1 and currently pushing there. With a bit of struggle, it shall pierce through this DR1 resisatnce to head towards weekly resistance. And exactly above that weekly resistance, monthly resistance MR1 is also sitting with zone 180-200. Therefore, this is a confluence of the resistances and will cause the upward movement of the price to stall there and cause some push back. Lets see how it reacts there but if in long some profit taking on that resistance confluence zone is definitely a rational behavior.

SOL/USDT:SIGNALHello friends
According to the price growth we had, you can see that the price is in a range and now, as it approaches the ceiling of the range, if it manages to break our channel, it can move to the specified targets.
*Trade safely with us*

#SOL/USDT#SOL
The price is moving within a descending channel on the 1-hour frame, adhering well to it, and is heading for a strong breakout and retest.
We are experiencing a rebound from the lower boundary of the descending channel, which is support at 95.
We are experiencing a downtrend on the RSI indicator, which is about to break and retest, supporting the upward trend.
We are looking for stability above the 100 moving average.
Entry price: 108.50
First target: 114.06
Second target: 119
Third target: 127

SOLUSDT Holding Support, Targeting $150BINANCE:SOLUSDT bounced perfectly from the 0.618 Fib level and is now testing resistance. A small dip back to support is possible, but if $110 holds, we could see a strong move toward $150. Compared to other altcoins, SOLUSDT is showing real strength. Once the tariff noise clears, this could be one of the top performers. Always manage risk and set your stop loss!
BINANCE:SOLUSDT Currently trading at $118
Buy level: Above $112.5
Stop loss: Below $100
Target : $150
Max Leverage 3x
Always keep Stop loss
Follow Our Tradingview Account for More Technical Analysis Updates, | Like, Share and Comment Your thoughts

SOLUSDT 1DSOL ~ 1D Analysis
#SOL Buy gradually after successfully penetrating this resistant line with a short -term target of at least 10%+.

SOLANA(UPDATE)Hello friends
Due to the heavy price drop, you can see that buyers are slowly entering and the price is creating a good ascending channel, which now provides a good opportunity to buy in stages and with capital management and move towards the specified goals.
Don't forget to save profit on each target.
*Trade safely with us*

solusdt analysis and trade idea.SOLUSDT is trading at 142$ and has done bullish BOS after MSS as mentioned on the chart. As bullish BOS has done so we have to look for long entries in below that BOS move that caused BOS. I have found one FVG where i will look for long entries.

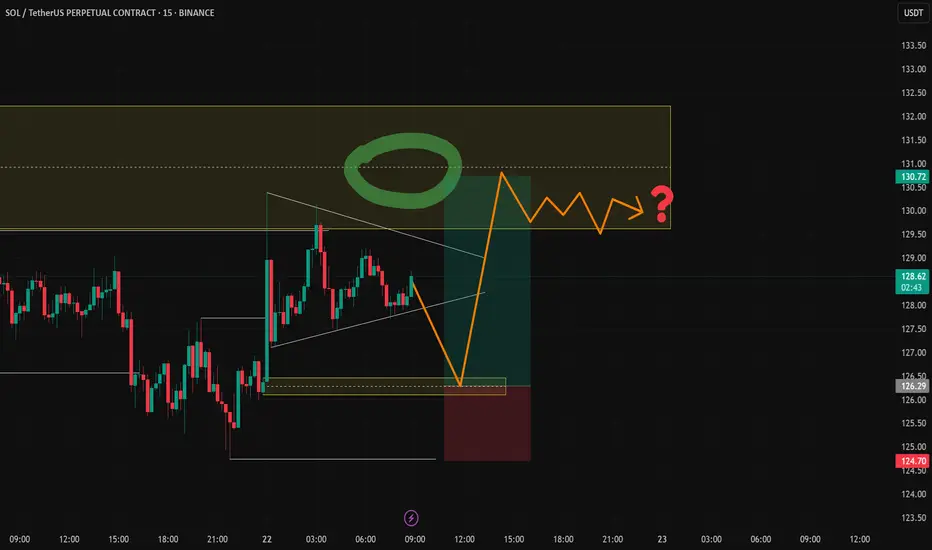
solana trade setup 15min chart* if you are trading on market orders need to set limit order *
i say this because last week it has going all directions and playing with strict levels are important
just spotted a triangle forming which could be drying up in volume as of recording this chart setup it saturday where major market remains closed the volume and volatility will be low
buy area 126-126.50 target 130.5 to 131 sl 124.70-50
triangle is trap for liquidation be careful !!
#SOL/USDT#SOL
The price is moving in a descending channel on the 1-hour frame and is expected to continue upward.
We have a trend to stabilize above the 100 moving average once again.
We have a downtrend on the RSI indicator that supports the upward move with a breakout.
We have a support area at the lower boundary of the channel at 121.60.
Entry price: 126
First target: 129
Second target: 132
Third target: 135

SOL/USDTHello friends
Given the downward trend we had, the price has reached a good support area and if the area is maintained, you can enter a buy trade and move to the specified targets with it.
*Trade safely with us*

SOLUSDT: Strong Bounce from Major Support!!BINANCE:SOLUSDT has shown a strong recovery after hitting a major support zone around $110. This bounce is accompanied by good trading volume, indicating growing interest. Investors who missed the previous rally are now accumulating, which adds further strength to the bullish sentiment.
As market conditions improve, the entry of bigger players could push SOL towards higher highs. If momentum continues, there’s potential for SOL to breach its previous all-time high, with a long-term target of $500 in sight.
For investors, this presents a solid buying opportunity to hold for the long term. Traders, however, should manage their risk carefully and always set a stop loss to protect their capital.
BINANCE:SOLUSDT Currently trading at $132
Buy level: Above $110
Stop loss: Below $90
Target : $500
Max Leverage 3x
Always keep Stop loss
Follow Our Tradingview Account for More Technical Analysis Updates, | Like, Share and Comment Your thoughts

Long-term Solana (SOL) OutlookExpecting a further drop in price to a range of $10-$40 before a bull run to possibly another ATH. Sentiment and price pattern is similar across all major cryptocurrencies. HODLing would be extremely stressful during this bear run.
This is only my opinion and should not be taken as an investment advice. The market can of course, turn at any point in time.

SOL/USDT BUYHello friends
Given the price reaching resistance and price correction, now the best conditions have become to buy in stages and with capital management. We have also specified price targets for you.
*Trade safely with us*

#SOL/USDT#SOL
The price is moving in a descending channel on the 1-hour frame and is adhering to it well and is heading to break it upwards strongly and retest it
We have a bounce from the lower limit of the descending channel, this support is at a price of 157.48
We have a downtrend on the RSI indicator that is about to break and retest, which supports the rise
We have a trend to stabilize above the Moving Average 100
Entry price 159.85
First target 165.92
Second target 169.59
Third target 175.10
