Weekly Macro S&P 500 AnalysisThe 4270.00 level can contain selling through Q1, above which 4634.50 remains a 3 - 5 week target, 4864.25 likely over the next 3 - 5 months.
Upside, 4634.50 can contain weekly buying pressures, while closing above 4634.50 indicates the targeted 4864.25 by the end of February where the market can top out into Q2.
Downside, a settlement below 4270.00 signals 4113.50 within 2 - 3 weeks, secondary long- term support able to contain selling into later in 2024 and above which a longer-term bullish dynamic remains in effect over that time horizon.
Sp500future

1-Treasury bills give the same returns as S&P 500 with less riskWall Street Investment banks are predicting various prices for the S&P 500 close at the end of 2024. But if the current 1-year Treasury Bill Yield is the same as the estimates then why bother buying the S&P 500? It would be safer buying bills and you may get an equal return.
This piece of analysis will look at:
Historical accuracy of Wall Street Banks S&P 500 estimates for the year ending
Current predictions for S&P 500 estimates for year-end 2024
The current yield on 1-year Treasury Bills
Comparison between the estimates for the S&P 500 vs. 1-year Treasury bills.
Historical analysis
According to research done by Bespoke Investment Group and by CNBC.
Excluding 2008, the analyst overshoot of the S&P 500 actual performance over the past 15 years goes down from being over 9% off to a miss of 3.4%. And the fact that analysts overshot the actual market performance 12 out of 15 times, means they did undershoot it three times. When looking at their S&P 500 price target prediction, analysts undershot the actual performance in seven of the past 20 years.1
Historically, these forecasts have often underestimated the actual market performance, especially during the bullish period since 2009, when they were off target seven out of nine times. The average annual projection tends to be around 9.3%, aligned with the S&P's historical average gain. 2
So, overall, excluding the outlier of 2008, analysts tended to overshoot their predictions of the S&P 500 performance by a decreasing margin over the past 15 years, moving from an initial overestimation of over 9% to a more moderate miss of 3.4%. Their track record shows a pattern of overshooting the market's actual performance in 12 out of 15 instances, with just three instances of undershooting.
Current predictions
BMO Capital Markets: $5,100
Deutsche Bank: $5,100
RBC Capital Markets: $5,000
UBS: $4,700
Goldman Sachs: $5,000
Bank of America: $5,000
Barclays: $4,800
Wells Fargo: $4,600
Morgan Stanley: $4,500
J.P. Morgan: $4,200
Average = $4,800
Median = $4,900
Mode = $5,000
1-Year Treasury Bill
The current yield on the 1-Year Treasury Bill is 5.061%. The reasons for the yield being somewhat high are:
Strong Economic Data: The resilience of the U.S. economy, especially the robustness of the jobs market, has surprised many experts. Despite expectations for a slowdown, the economy continues to perform well, leading to higher yields. The Federal Reserve's cautious approach to cutting interest rates too quickly is another reflection of this strong economic backdrop.
Fed's Cautionary Stance: The Federal Reserve is wary of cutting rates swiftly due to concerns about inflation and the tightness of the labour market. They aim to maintain a balanced approach, keeping rates at a level that won't spur excessive inflation but also won't hinder economic growth.
The shift in Fed Messaging: Recent messaging from the Fed indicated less aggressive rate cuts in the future than previously expected. This change in outlook, particularly with the Dot Plot showing fewer rate cuts in 2024, has influenced bond market sentiment.
Increased Treasury Issuance: The U.S. Treasury's substantial pace of issuing new debt has disrupted the supply-demand equilibrium in the bond market. The unexpected announcement of raising a significant amount of money through bond sales has added pressure to yields as more bonds flood the market.
Yield Curve Dynamics: The yield curve, which had previously inverted (short-term yields higher than long-term yields), is now experiencing a lessening of this inversion. Typically, this occurs as short-term rates fall while long-term rates rise. However, the current situation is unique as the long-term yields are increasing while short-term rates remain relatively stable.
The surge in Treasury yields reflects a confluence of factors: a resilient U.S. economy outperforming expectations, the Federal Reserve's cautious approach to rate cuts amid concerns about inflation and a tight labour market, a shift in Fed messaging signalling fewer future rate reductions, increased government borrowing, and the unique dynamics of the yield curve. This unexpected rise in yields diverges from earlier predictions of a decline, shaping the current landscape of the bond market and influencing borrowing rates for consumers and businesses alike.
One's prediction of the future yield in a year may be higher or lower. But regardless, when you buy a bond it is stuck at that yield since it represents the interest earned.
S&P 500 vs Treasury bills
Yesterday's close of the S&P 500 was $4,567.18. If we assume the S&P 500 will reach the average and median estimates that represents a 5.10% and 7.13% return on investment respectively.
However, as we have established above looking at the historical analysis of Wall Street estimates they tend to overestimate. Most of the time the S&P 500 closed below their estimate. Wall Street estimates between 2000 and 2018 have an average overshoot of 4.40% from the table above. So there is reason to assume they will do the same this year.
If we assume the estate's average and median return of 5.10% and 7.13% respectively are overshooting. That means we might as well invest in 1-year Treasury Bills. Why? Because Treasury bills are safer, and guaranteed return and if they are giving similar returns to the more risker S&P 500 over the next year then why bother with the risker alternative? It makes more sense to just buy 1-year Treasury Bills.
Conclusion
In the landscape of investment choices for the year ahead, the comparison between the S&P 500 and 1-year Treasury Bills offers compelling insights. The historical analysis of Wall Street's predictions demonstrates a consistent pattern of overestimation, signalling a potential trend that might repeat itself in the current estimates for the S&P 500 for year-end 2024.
With the current projections showcasing potential returns for the S&P 500, it's crucial to consider the safety and reliability offered by 1-year Treasury Bills, especially given their current yield, standing at 5.061%. The compelling argument arises when assessing the historical trend of overestimation by financial analysts in forecasting S&P 500 performance.
If these estimations continue to overshoot, as historical data suggests, the seemingly safer investment in 1-year Treasury Bills could provide comparable returns with considerably lower risk. The prudent approach might lean toward the Bills, given their guaranteed return and stability, particularly if they yield similar or better returns than the potentially riskier S&P 500.
The choice between the S&P 500 and Treasury Bills becomes a contemplation of risk versus stability. While the S&P 500 might offer potential gains, the historical trend and current projections invite consideration of the Bills as a safer and possibly equally rewarding investment option for the upcoming year. Ultimately, it might be prudent for investors to weigh these factors carefully before making their investment decisions for the year ahead.
1
www.cnbc.com
2
seekingalpha.com

S&P500 (@ES @MES)We are currently in an upwards rally in the markets
With a trend fib being pulled from our larger lows we have a coinciding level of the 50% retracement converging with the top line of our rising wedge which is a bearish pattern (depending on how long this march takes we could meet our golden ratio 61.8% at the top of our wedge creating a yearly double top as a possibility also).....this is purely up to how fast we continue to move higher
We must assume price will continue to respect this rising wedge (which is a bearish pattern which breaks to the downside 65%+ of the time)
If we break out to the upside we can see a 61.8% retrace and grab a nice throw over or we have a blast of scenario and we march to new all time highs we must wait and see
But for now i am expecting a pull back once we hit our 50% fib

S&P500 Hello Traders!
Today I am focusing on the S&P500's next move and considering that we are approaching the Christmas period and that I am expecting a year-end bullrun towards 4700 I believe that at the moment the index could retrace towards 4525 with a maximum extension towards 4485 to load some long positions at better prices and then restart towards the highs.
Targets are determined by fibonacci's retracement, let us consider the period of the extension of the last restart until exhaustion.
Targets are the levels between 4525-4485.
Thanks.

today go longo in sp500?We have the bullish trend and we are likely to enter the retracement to go in favor of the trend with a minimum risk benefit of 1/3

Emini S&P500 LONGStill holding e-mini S&P long. Took a second entry at 4326.75 and moved stops below pivot point strong support @ 4315.5 I am looking for upside swing targets: Swing Target 1 =4415, Swing Target 2 =4431.25 and Swing Target 3 =4457.50
Regular session Targets:
TP1: 4357.50
TP2: 4373.50
TP3: 4383.75
TP4: SwT 4430
TP5: SwT 4457

E-mini S&P500 Long Double Bottom/Bullish OrderblockLooking for Market to find Support in Bullish Orderblock... Market could probe lower coming into market close ahead of Tesla Earnings, however, if market is going to hold it should hold right here. If earnings are good, market will be bullish. If earnings are bad, market will be bearish and we will be folding lower...
⚠️This idea is for informational purposes only and should not be considered as financial advice. Trading involves risk, and past performance is not indicative of future results. Always conduct your own research and consult with a qualified financial advisor before making any investment decisions. ⚠️

SP500 Futures new Supply Zone (?)Hello trading community!
The ES Futures seems to be Bearish, and we can watch in this chart 3 Higher Lows created. A strong support that was tested three times has already been crossed and tested to create a new possible resistance.
The Dollar continue to show strength, the DXY is again testing the resistance, and we believe this time will be a strong long signal.
Also, after analyzing the SPX timeframe 4Hours, is possible to observe the Supply area that has already been tested and originated the three HL.
SPX is entering in an area that was resistance some months ago.
To conclude, we believe ES Futures contracts will test again the area of the new resistance 4401.25, and will change the direction to a short position

SP500 Short Term Sell IdeaH1 - Bearish trend pattern.
Currently it looks like a pullback is happening.
No opposite signs.
Until the two strong resistance zones hold my short term view remains bearish here.

$SPX500USD US500 Continue to Build Upward PressureOANDA:SPX500USD
We will have choppy times ahead.
Target 4600
Above 4600 Vey Low Volume
The sentiment is positive
4060 is support
Technically
Higher Highs Lower Lows
We are slowly leaving the current ange
The ranges are increasing
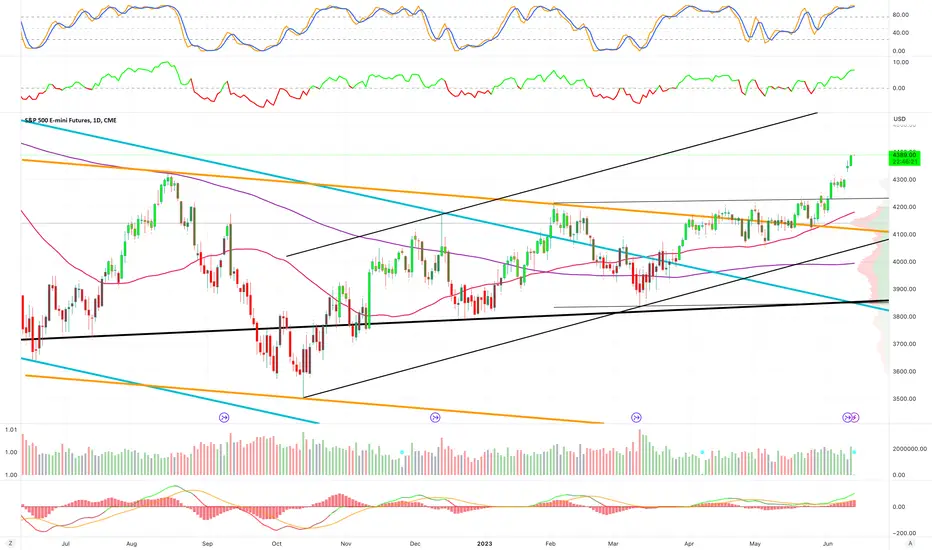
The S&P 500 has rallied rather significantly during the course of the week to break above the 4200 level, showing signs of extreme strength. At this point, the market looks as if it is going to threaten the 4300 level above, an area that has previously been resistance. We have seen a lot of noise over the last several months, but the resiliency of the market is something that you have to pay attention to. As long as the market stays this resilient, it will be difficult to short anytime soon. The candlestick seems as if it is trying to tell us that the market has made up its mind finally, and that it decided that it’s going higher.
If we can break above the 4300 level, then this becomes more of a “buy-and-hold” situation, but you can see that the gains have been hard won. With that, I think you get a situation where you are probably better off looking for short-term dips that you can take advantage of, as they offer value in what is becoming a very aggressive uptrend.
That being said, if we were to turn around a break down below the 50-Week EMA could send the market lower, perhaps back down to the 4000 level, and even down to the 200-Week EMA which is currently near the 3770 level. However, it’s probably worth noting that momentum is definitely not on your side if you are going to take this position, and therefore you are probably better off looking for a move to the upside but expecting a lot of volatility. Keep in mind that the S&P 500 is not equally weighted, so it’s just a handful of stocks that make the difference.

US500 - KeyLeveles for next weekIf you wanna take a trade on US500, maybe before that, you need to conisder this KeyLevels of support and resistance areas.
Careful with longs until the resistance are on daily was rejected and the RSI looks very overbought!

SP500 Bearish ScenarioThe #SP500 diverged 61% from the trend it had referenced since 1940.
When we look at such divergences in history, we see that the index has returned to the reference trend.
The beginning of this reversal is usually confirmed by a close below the SMA9 on the 3-month timeframe. This level is currently displayed as $4174.
In a possible bear scenario, EMA60 or $2651 will guide us for the priority return level. Finally, EMA120, which is already at the same level as the reference trend level, will act as the last support.
In addition, looking at the SP500 index in the daily time frame, the McClellan Oscillator, which has been working very successfully since 1900s, turned negative last week.
However, another factor that can contribute to my analysis is that the monetary and fiscal policies made by HSBC today are not compatible with the bond and stock markets, and that the current recession will go further.

S&P 500, 6/22/23For Thursday, 4444.50 can contain session strength, below which 4352.50 is likely intraday, 4257.50 in reach by the end of next week, where the market can bottom out on a weekly basis, possibly into later July.
Upside Thursday, pushing/opening above 4444.50 signals 4462.50, while closing today above 4444.50 indicates 4503.50 within several days, able to contain buying through next week and the point to settle above for yielding the 4613.00 longer-term objective within several more weeks.

S&P 500, 6/20/23The 4195.75 long-term support area can contain selling through the balance of the year, above which 4606.50 remains a 3 - 5 month objective, the 4808.25, January 2022 all-time high expected by the end of the year.
On the way up, 4606.50 can contain monthly buying pressures, with a settlement above 4606.50 indicating the targeted 4808.25 within 3 - 5 weeks, where the broader market can double-top on a monthly basis.
Downside, a weekly settlement below 4195.75 would be considered a significant failed long-term buy signal, in essence indicating 3898.25 within 2 - 3 months.
-
For Tuesday, 4451.75 can contain weekly selling pressures, above which 4606.50 remains 2 - 3 week objective.
Upside Tuesday, 2522.50 can contain session strength, while closing above 4522.50 should yield 4606.50 by the end of next week, able to contain buying through July.
Downside Tuesday, breaking/opening below 4451.75 allows 4404.25 intraday, able to contain session weakness and the level to settle below for indicating a good weekly high, 4299.50 then expected by the end of next week, where the market can place a weekly low, possibly into later July trade.

S&P 500, 6/15/23For Thursday, 4399.00 can contain intraday weakness, the targeted 4441.25 - 4446.50 area in reach and able to contain buying through the balance of June.
Holding below 4441.25 allows 4203.75 long-term support by the end of July or sooner, while closing today above 4446.50 signals our 4600.00 longer-term objective over the next 2 - 3 weeks.
Downside Thursday, 4367.50 can contain session weakness, while closing below 4367.50 indicates a good weekly high, 4263.75 then expected within several days, also able to contain session weakness and the point to settle below for indicating 4186.75 - 4203.75 long-term support within several more days.

S&P 500, 6/14/23For Wednesday, 4402.50 can contain intraday weakness, the targeted 4436.00 - 4446.50 area in reach and able to contain buying through the balance of June, once tested the market susceptible to falling back to 4203.75 within 3 - 5 weeks.
On the other hand, closing today above 4446.50 signals the 4596.50 longer-term objective over the next 2 - 3 weeks.
Downside Wednesday, 4353.00 can contain session weakness, indicates a good weekly high, 4263.75 then expected within several days, also able to contain session weakness and the point to settle below for indicating 4188.50 - 4203.75 long-term support within several more days.

SP500 Next Price Target So ClearRange is very clean.
It is very clear where the price will go.
I hope you can see this.
All ranges of this range worked sharply.
While individual investors buy the break out, you can sell it.
Have a nice one and good trading!

S&P 500, 6/13/23For Tuesday, 4348.75 can contain intraday weakness, 4385.00 in reach and able to contain intraday strength.
Pushing/opening above 4385.00 allows 4409.00 intraday, able to contain session strength and the level to settle above for yielding the targeted 4430.50 formation tomorrow, where the market can top out into July activity.
Downside Tuesday, breaking/opening below 4348.75 signals 4328.75, able to contain session weakness.
Closing today below 4328.75 indicates 4263.75 within several days, also able to contain session weakness and the point to settle below for indicating 4190.25 - 4203.75 long-term support within several more days.
S&P Futures: Mind the "Bull Market" GapIs this the proper way to start a new bull market? Asking for a friend...
-Home prices relative to income are higher than during the peak of the 2008 financial crisis.
twitter.com
-62% of new homebuyers are having trouble paying their mortgages.
listwithclever.com
-Some cities already seeing a rollover in housing prices with a rise in inventory.
twitter.com
twitter.com
-Investors are leaving the housing market.
twitter.com
-Commercial real estate is busting.
twitter.com
-Hotel developers are broke.
www.reuters.com
-Total credit card debt has crossed $1 trillion for the first time ever.
twitter.com
-Credit card delinquency rates are rising.
twitter.com
-7 stocks are responsible for all of the gains in the SP500 this year.
twitter.com
- Student debt payments are about to resume putting more pressure on cash-strapped consumers.
twitter.com
Good luck out there in this new "bull market". I suspect that the gap will be filled sooner rather than later, especially with that lower TDI indicator showing the RSI above its upper Bollinger Band.

Will the S&P 500 tank (or will bears be forced to capitulate?)Whilst this year's 'rally' on the S&P 500 has been mediocre at best, the increase in net-short exposure to S&P futures has been impressive. As of last Tuesday, large speculators pushed their net-short exposure to the futures contract to their most bearish level since late 2007.
Yet with prices rising whilst speculators increase bearish exposure, there is a clear mismatch between the two data sets. And one that will need correcting, one way or another.
Prices will either need to roll over to justify the short-exposure of large speculators, or bears will have to capitulate which could also trigger a short-covering rally to send prices higher.
A potential catalyst could be if (or when) the US increase their debt ceiling, with reports suggesting we are on the cusp of a 2-year raise - and that could support risk assets such as the S&P 500. But if the talks break down, the deadline is missed and the US government defaults (which would also see the US lose their 'AAA' rating), it could be a case of 'watch out below' as the market slumps to justify the aggressive positions of bears.
Either way, this is one to watch as the week's progress.

Big Short On SPX500 According to the US30 analysis, the price of spx500 can also have a down trend in the long term

SP500 - SHORT SETUPOn daily timeframe, we have a last pump wich show us the level of distribution area, nothing bullish undeer 4200.
If the daily candle will close under 4.160, i will enter short

ES Overnight Breakdown Continuation?Will ES continue to break down the main channel support? If we do not hold 4150, I believe we will see a much needed cool off and a main channel retest around ~4120.
I played a short overnight for 20 points for a measured move of yesterdays leg. I believe we will see a small bounce to retest the uptrend, then see continuation down to the main channel as we have lost a bit of steam.
