S&P500 Short Trade - The next big shortI have tried multiple times to short the S&P500 this quarter with little success. 4hr & 1hr trendlines that were broken then appeared to be fake outs and the index just kept on climbing. Resistance zones held and then failed and it has been quite messy.
That being said, the power of R:R ratio always comes through and the higher it climbs... the more it has to fall.
This time we have the long term fibonacci 0.786 retracement zone and 2800/2810 resistance zone holding strong. There appears to be a change in direction bias on the 4hr and todays little pullback is providing a nice entry for a long term short position.
Target Profits:
$2600 first... the famous support/resistance zone
0.27 fib extension & support at $2100 after that.
Sp500short


Approaching speculative short top positionRedraw of my previous idea. Period to watch: now to 02.25.19.

sell at 2746 with 2 tp before end weekmuch overbought in short time
face biggest resistance
market euphori on shutdown and trade talks but nothing is done,is buy the rumour for now..so investor will surely take some rofit sonnest

S&P 500 Weekly Model shows Markets Bottom March 2020Tonight i ran my model on a weekly scale - just amazing results - the low is locked in for March 26 2020.
brschultz / markettimer777 / @brschultzgoldw1

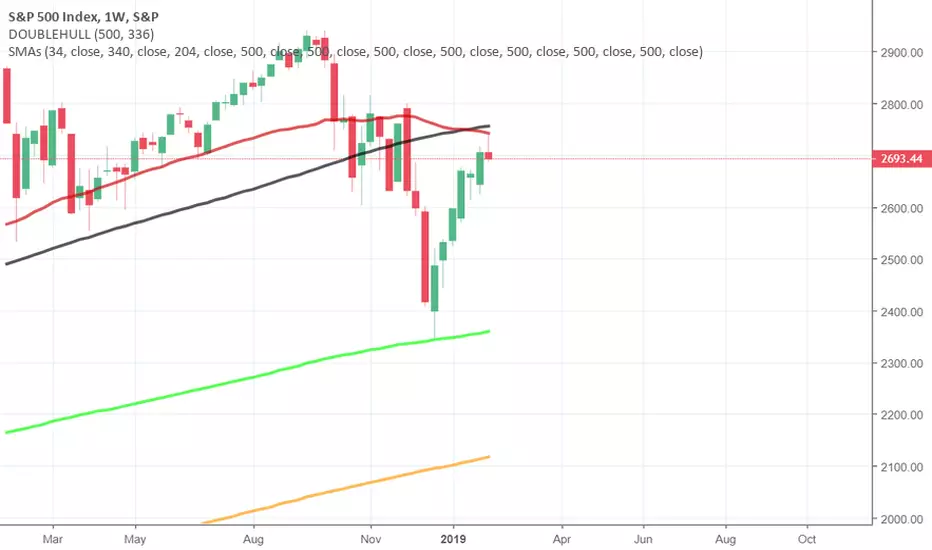
March 26 2020 Major Market Low en route perf tag 500 Double HullIt Now Begins as markets nailed 500 period Double Hull on weekly & daily basis ON THE SAME DAY!!!
AMAZING
brschultz / markettimer777

Losing steamThis has been forming a long and slow top, often making new unexpected highs.
The probability that this tumbles over becomes increasingly higher, but markets can always go on longer than we expect them to, so be carefull.
MACD about to cross, RSI relatively high (and losing steam), 200SMA as resistance (interesting level to keep watching)
red = 200 sma
orange = 100 sma
yellow = 50 sma
green = 20 sma
white = 21 ema

Indexes have crackedAs said, patience in key. If you missed shorting the top months ago and have been waiting for this rally to end, we have the crack! The 200 MA on daily was the obvious brick wall. On long term shorts, I always take profit at the Weekly 200 MA, as it's very powerful and aligns with Fib ratios frequently. For this rally, the weekly 0.95 Fib is last(medium term) target. The first 3 targets I have with X's by them. Stop loss would be 2740 to 2750. I do believe this is a generational short and it will go lower than the December correction, but only time will confirm that.


Weekly Momentum Model Puts Peak hereTesting my weekly model - SH weeklly shows a buy here so thus a peak in markets if testing goes as planned
brschultz


For My Earnings Model to Be Accurate S&P 500 MUST FAIL hereIf my model is going to be accurate in the majority of market directional changes then the S&P 500 must peak at the 340 daily SMA here.

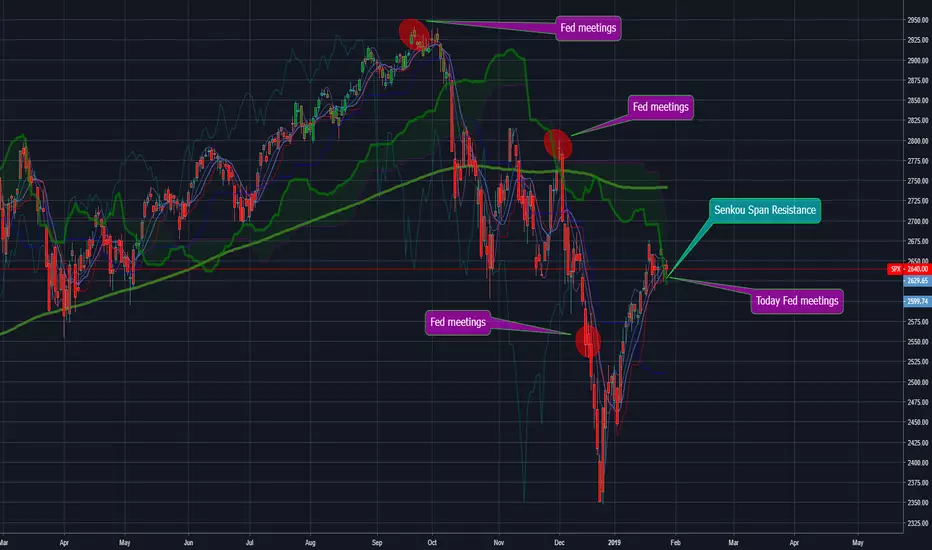
#S&P 500 INDEX SignalAs you can see in the graph above in the last three times of Fed meetings The market dropped, Today there will also be a meeting of the Fed so we recommend opening a sell position and continuing the trend of meetings, The second (sell) reason is the line of resistance of (Ichimoku Indicator) Senkou Span
sell S&P 500
Entry Price: 2655
Stop Loss: 2703
Take Profit: 2400
S%P500 / SPX / S&P 500 Chart - I am watching it closely..Those are my main 2 levels that I am looking to see how price reacts.
Great RR at every level..
We broke the market structure and I AM BEARISH until proven wrong.
Watch how the price is increasing while the volume is decreasing...Everything is very bearish..The bubble will pop in in less than 2 months!


SPX Short....but wait!I see a lot of bears getting greedy eyes and bulls filled with hopium. Per my original chart, we are still headed into targets to short or get out of long positions. But! Wealth is transferred to the hands of the patient- from the hands of the impatient. The sidelines are cozy when you're aiming for the best entry.

S&P500 APPROACHING KEY RESISTANCE: ANALYSISS&P500 is approaching a key resistance level and looks likely to sell off in line with the weekly timeframe.
The weekly timeframe has formed lower lows and has retraced to the 38.2 fib and key resistance.
Looking for bearish price action here to suggest further downside to come.

Possible short on SP500Possible short on SP500, based on Fibo and structure, price approaching a key support turned resistance, will enter once PA agrees, hope price reaching that level!

SP 500 [Daily] Looking to sell rallies towards 2650/90Some space left for bulls, so im not going to chase the price and will look to sell rallies towards 2650/90

