S&P500 | 100 year bullish channel | GTradingMethodHello Traders - Happy Monday!
I thought this was a very interesting perspective on S&P500.
What they don’t want you to see... 👀
The S&P has been moving inside a bullish channel for nearly 100 years (since 1925).
Right now, price is breaking out of that channel but is it fakeout?
If it’s a fakeout, the implications are huge: we could be looking at a 70% drop back to the bottom of the channel.
⚠️ Chart is on the monthly timeframe with a logarithmic scale.
What do you think — breakout or fakeout? Very keen to hear all your thoughts
#TradingLife
SPX (S&P 500 Index)

BRIEFING Week #36 : Oil Prices Diverge from RealityHere's your weekly update ! Brought to you each weekend with years of track-record history..
Don't forget to hit the like/follow button if you feel like this post deserves it ;)
That's the best way to support me and help pushing this content to other users.
Kindly,
Phil

SPX500 Awaits Breakout – Key Levels 6,506 & 6,486SPX500 – Overview
The S&P 500 is holding above the 6,490 pivot, with short-term momentum favoring a retest of 6,506.
Technical Outlook:
📈 Bullish scenario: While above 6,490, price is expected to test 6,506. A confirmed breakout above this level would extend upside toward 6,527 → 6,550.
📉 Bearish scenario: A confirmed 1H close below 6,486 would open the way to 6,469, with further downside toward 6,425 if that level breaks.
Key Levels:
Pivot: 6,490
Resistance: 6,506 – 6,527 – 6,550
Support: 6,469 – 6,453 – 6,425

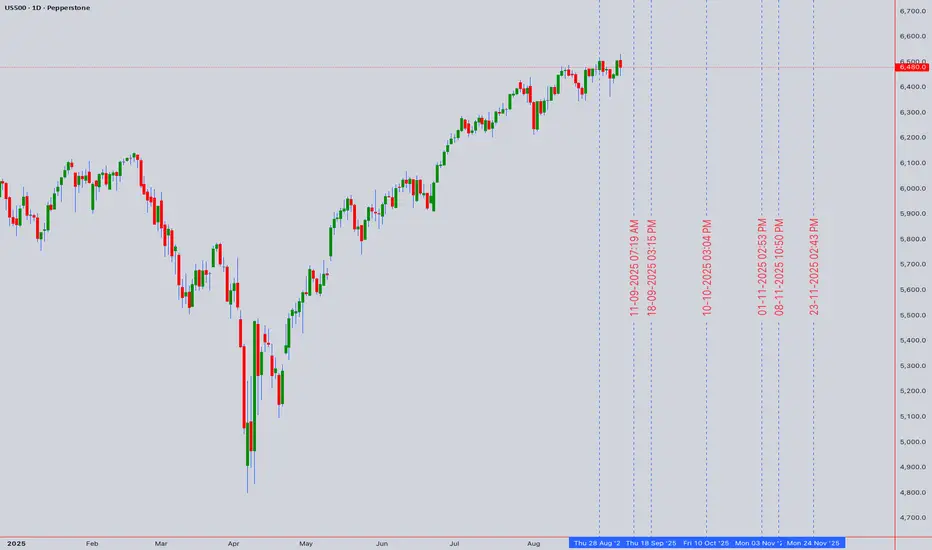
SPX: NVIDIA surging bets on Fed cutThe previous week on the US stock markets was marked with surprisingly low Non-farm payrolls data in August. Namely, only 22K new jobs were added to the US economy, while the market was expecting to see at least 75K. At the same time, unemployment rose to 4,3% in August from 4,2% posted for the previous month. These figures were a game changer when market sentiment is in question, so Friday was a quite volatile day. Namely, during the one day, the positive market sentiment pushed the S&P 500 to the historically highest level at 6.530, but the disappointing jobs data, reverted the optimism, so the index closed the week at 6.481. The slowing jobs market increased expectations that the Fed now has solid grounds to cut interest rates by 25 basis points at their September meeting.
The company Kraft Heinz was in the center of news during the previous week, after the announcement that the company will split into two, in a strategic move aimed at unlocking brand value. The split should finalize in the second half of 2026. Shares of the company rose by 1% on the news, however, it should be considered that the stocks lost around 21% over the past year. Another company that was discussed was Robinhood Markets, which will join the S&P 500 index before trading on September 22nd, in a milestone indicating growing mainstream acceptance of the fintech giant. The stocks of the company surged around 7,3% following the announcement.
Some higher volatility might be expected also in the coming period on the US stock markets. There are still both positive and negative drivers which are shaping market sentiment. In the week ahead the US August inflation data will be posted, which might bring some higher volatility in case that the figures are not in line with market expectations. For the moment, the easing jobs market in the US is providing a strong case for the rate cut in September.

ES (S&P500) - Analyses - Breakout or Breakdown Plan (Sep 9)S&P 500 E-mini (ES) keeps ranging inside 6,490–6,505, with repeated taps of 6,516 above and 6,490–6,496 below. Tomorrow I’m stalking a box resolution during the AM session, then a second chance in the PM window.
Key Zones
Resistance: 6,505–6,516 (NYPM/NYAM lid). Above it: 6,541.25 (PDH) → 6,547.75 (IBH).
Support: 6,495–6,490 (NYAM/NYPM floor). Below it: 6,481.0 → 6,471.5 (hard pools).
Range to watch: 6,490–6,505 (decision box).
Game Plan (structure-first)
LONG (breakout-acceptance)
1. 5-minute displacement close > 6,505–6,516.
2. Retest 6,501–6,503 (OB/FVG/OTE) and hold.
3. Entry on confirm; Targets: TP1 6,541.25, TP2 6,547.75, TP3 6,555+.
4. Invalidation: any 5-minute body back ≤ 6,500 after breakout.
SHORT (breakdown-acceptance)
1. 5-minute displacement close < ~6,496.
2. Retest 6,498–6,500 (failed reclaim) and roll.
3. Entry on confirm; Targets: TP1 6,481.0, TP2 6,471.5, TP3 6,464–6,465.
4. Invalidation: any 5-minute body ≥ 6,500 after fill.
Timing windows
Primary: 09:30–11:30 ET and 13:30–15:30 ET (trade management only in between).
We are currently consolidating below 6,516, with a clear liquidity ladder leading to PDH 6,541.25 if the movement is accepted. If it fails, we have stacked support levels around 6,481 and 6,471 that typically attract price action once 6,496 breaks down.
Please confirm with ES and NQ: we want both indices to move in sync (no bearish signs of market tension on longs, and no bullish signs of market tension on shorts).
What could affect ES tomorrow?
NFIB Small Business Optimism (Aug): 6:00 AM ET.
API crude inventories (for CL correlation): Tuesday around 4:30 PM ET.
(For Wednesday's context: EIA petroleum report at 10:30 AM ET.)

Day 25 — Trading Only S&P Futures | Gold’s Rally Raises FlagsWelcome to Day 25 of Trading Only S&P Futures!
Today started strong with an overnight short and continued by taking longs at major support levels. With the FOMC blackout period in effect, I leaned bullish but stayed selective, waiting for the 5-min MOB to hit before entering. That trade paid off and I wrapped the day at +264.83.
Still, there’s a cautionary note: gold just hit a record high above $3,633/oz, and that could be signaling underlying stress in the markets. Something to keep an eye on as we move forward.
🔑 Key Levels for Tomorrow
Above 6480 = Remain Bullish
Below 6465 = Flip Bearish
📰 News Highlights
SPOT GOLD EXTENDS GAINS, LAST UP 1.3% TO HIT A RECORD HIGH OF $3,633.65/OZ

Economic Tipping Point...GFC 2.0? In this video we discuss;
Bond Market Signal using the 2 year yield.
Is the 2 year yield giving us a 2007 / 2008 signal?
We look at the correlation of the 2 year yield vs SPX
We analyze the forward expectation of interest rate projections.
Observe and dissect last weeks economic employment data.
There will be plenty of opportunities in this next phase of the market cycle.
I will be looking very forward to the plethora of trade alerts I will be issuing.

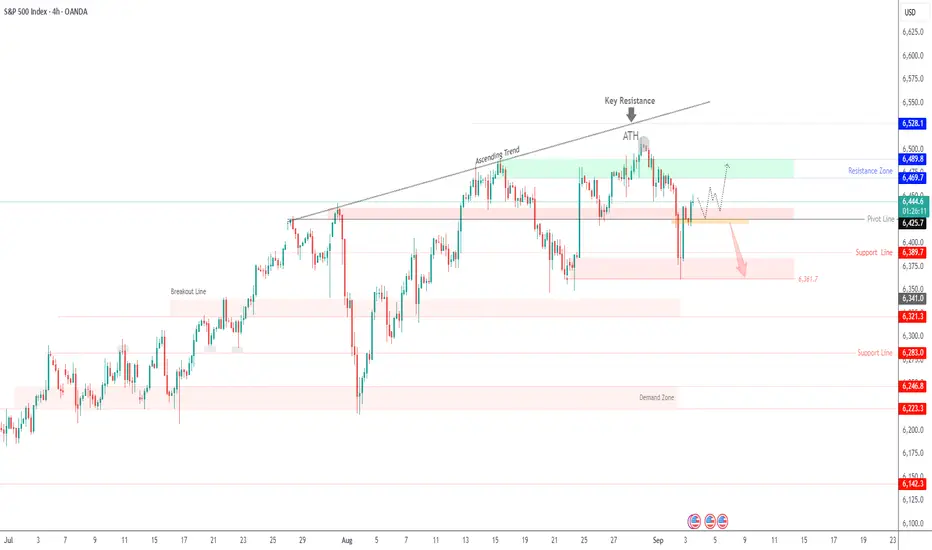
S&P 500 At Critical Juncture - 6,500 Breakout or Major RejectionUS500 Technical Analysis: 🎯 At Critical Juncture - 6,500 Breakout or Major Rejection? ⚖️
Asset: US500 (S&P 500 CFD)
Analysis Date: September 5, 2025
Current Closing Price: 6,480.0 (as of 12:59 AM UTC+4)
Timeframes Analyzed: 1H, 4H, D, W
Executive Summary & Market Outlook 🧐
The US500 is knocking on the door of a historic milestone, trading within striking distance of the 6,500 level. 🚪 This represents a massive psychological and technical barrier. The index is in a strong bullish trend but is displaying classic signs of short-term exhaustion and overextension. The price action here is critical: a decisive breakout could unleash a new wave of buying towards 6,600+, while a rejection could trigger the most significant pullback in weeks. This analysis provides a clear roadmap for intraday traders 🎯 and swing traders 📈 navigating this pivotal moment.
Multi-Timeframe Technical Analysis 🔍
1. Trend Analysis (Daily & 4-Hour Chart):
Primary Trend: 🟢 Bullish. Price is well above all major Daily Moving Averages, which are sloping upwards in bullish alignment.
Short-Term Trend: 🟡 Bullish but Fragile. The rally has been relentless, leaving the price extended and vulnerable to a sharp, news-driven correction.
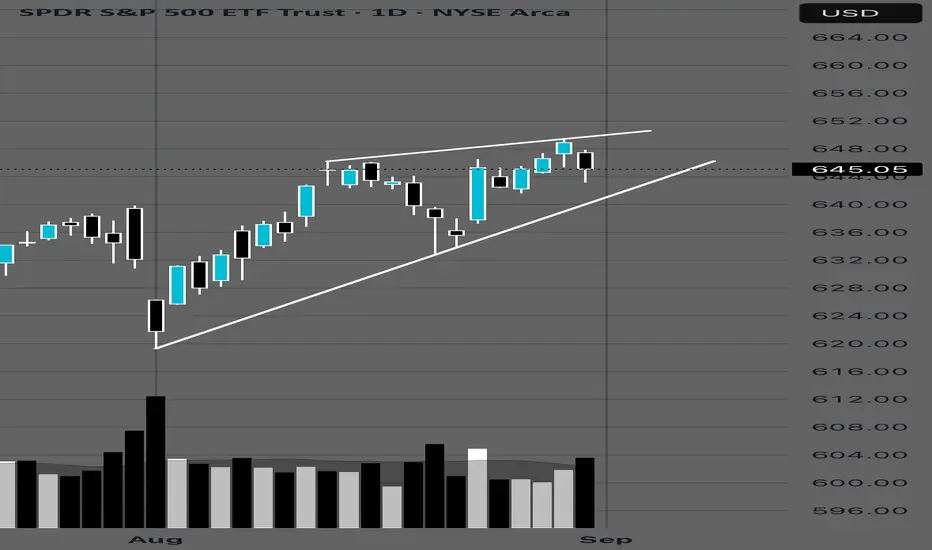
2. Key Chart Patterns & Theories:
Ascending Wedge / Bull Flag? 🤔: The recent consolidation near the highs could be interpreted as a small bull flag (pausing before breakout) or the end of an ascending wedge (bearish reversal). The next major candle will likely resolve this.
Elliott Wave Theory 🌊: The rally from the last major low is a clear five-wave impulse. We are likely in the final stages of Wave 5. This suggests the completion of a cycle and warns that a larger corrective phase (Wave 4 or A-B-C) is the next probable move. A typical retracement target is the 38.2% Fibonacci level of the entire Wave 3 move.
Ichimoku Cloud (H4/D1) ☁️: Price is trading far above the Cloud on daily charts, confirming the strong bullish trend. However, this also signals a significant over-extension from mean support, increasing mean reversion risk.
Gann Theory ⏳: The 6,500 level is a key psychological and mathematical resistance. A decisive break and close above it could open the path to the next Gann angle target.
3. Critical Support & Resistance Levels:
Resistance (R1): 6,500 - 6,520 (Key Psychological & Technical Ceiling) 🚨
Resistance (R2): 6,600 (Projected Target)
Current Closing Price: ~6,480
Support (S1): 6,400 - 6,420 (Immediate Support & Prior Breakout Zone) ✅
Support (S2) : 6,300 - 6,320 (Major Support - 38.2% Fib & 21-day EMA) 🛡️
Support (S3): 6,200 (50-day EMA & 50% Fib Retracement)
4. Indicator Consensus:
RSI (14-period on 4H/D): Reading is between 68 and 72, signaling overbought conditions. 📛 This warns of weakening momentum and increased downside vulnerability. A bearish divergence on the 4H chart would be a strong short-term sell signal.
Bollinger Bands (4H) 📏: Price is hugging the upper band, a sign of strong momentum. A move back to the middle band (~6,400) would be a healthy and expected development.
Moving Averages: The bullish alignment (EMA8 > EMA21 > EMA50) is perfect. The EMA 21 on the 4H chart acts as dynamic support and is a key level for the bullish thesis.
Volume & VWAP : Volume has been inconsistent on the most recent push higher, a potential bearish divergence 📉 suggesting a lack of strong conviction from large players at these exact levels.
Trading Strategy & Forecast 🎯
A. Intraday Trading Strategy (5M - 1H Charts):
Bearish Scenario (Rejection Play) ⬇️: Given overbought conditions, this is a high-probability setup. Watch for bearish reversal candlestick patterns (e.g., Bearish Engulfing, Evening Star 🌟, Doji) at or near the 6,500 resistance.
Entry: On confirmation of rejection (e.g., a break below a 1H support low).
Stop Loss : Tight, above 6,520.
Target: 6,420 (TP1), 6,400 (TP2).
Bullish Scenario (Breakout Play) ⬆️: If buyers break through with force, wait for a pullback to the breakout level for a better entry.
Entry: On a re-test of 6,500 as new support.
Stop Loss: Below 6,480.
Target: 6,550 (TP1), 6,600 (TP2).
B. Swing Trading Strategy (4H - D Charts):
Strategy: PATIENCE IS KEY. The risk/reward for new long entries at this resistance is poor. 🚫
Ideal Long Zones: A pullback to 6,320 would be an optimal entry to add long positions for the next leg up in the primary bull trend. A shallower pullback to 6,400 could also offer an opportunity. ✅
Bearish Risk: A daily close below 6,300 would signal a deeper correction is underway, potentially targeting the 6,200 support zone.
Risk Management & Conclusion ⚠️
Key Risk Events: High-impact US data (CPI, PPI, NFP) and Fed commentary are paramount. 🔥 The market is highly sensitive to any hint of a shift in monetary policy.
Geopolitical events can also trigger flight-to-safety flows.
Position Sizing: Due to the potential for explosive volatility at this key level, conservative position sizing is non-negotiable. Risk no more than 1% of capital per trade.
Conclusion: The US500 is at a critical inflection point. ⚖️ The bullish trend is intact, but price is exhausted. This is a low-risk-taking zone. Swing traders should be patient for a better entry. Intraday traders can play the range between 6,400 and 6,500 until a decisive break occurs. The most probable outcome is a pullback to recharge before the next major directional move. 📊
Overall Bias: 🟢 Bullish above 6,320 | 🟡 Neutral/Bearish between 6,480-6,500
SPX at verge of breaking down?SP:SPX is treading dangerously in a bearish wedge formation with multiple bearish divergences in RSI.
A breakdown from here could send it around 6200 zone. And that might just be beginning of the fall everyone is waiting for, on account of excessive debt and inflation situation.

SPX500 | Indexes Rise Ahead of JOLTS Data – Key Pivot 6,438S&P 500 & Nasdaq Futures – Update
Futures tied to the S&P 500 and Nasdaq rebounded on Wednesday, led by gains in Alphabet after its antitrust ruling. Dow futures edged slightly lower as traders await fresh labor market data. The focus today is the JOLTS report (10 a.m. ET), the first of several key releases this week, with nonfarm payrolls on Friday being the most important.
Technical Outlook (SPX500):
🔼 Price reversed from the 6,366 support mentioned in yesterday’s update and has now stabilized above the pivot line at 6,438.
As long as price holds above 6,438, upside momentum is expected toward 6,469 → 6,489, with extended resistance at 6,528.
🔻 On the downside, a confirmed 1H close below 6,420 would shift momentum bearish, exposing 6,389 → 6,361.
Key Levels:
Resistance: 6,469 – 6,489 – 6,528
Support: 6,420 – 6,389 – 6,361
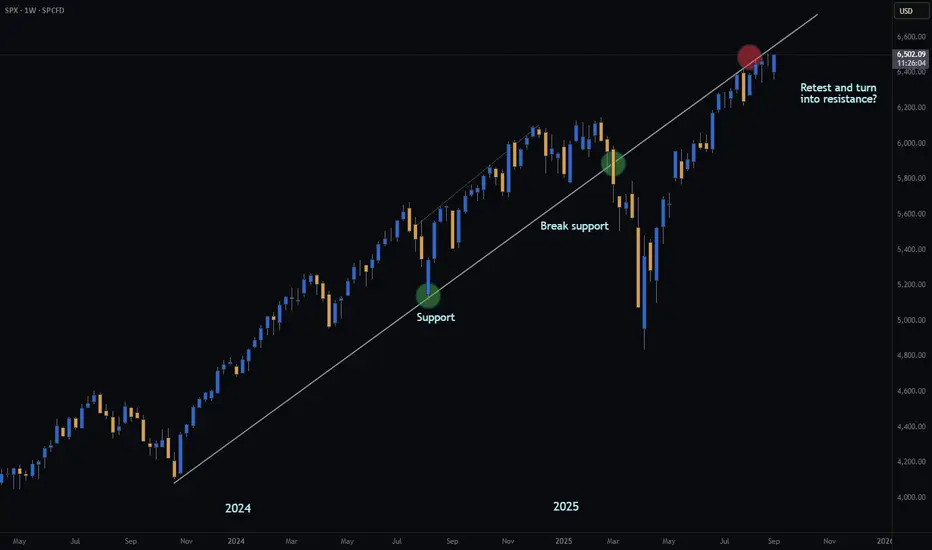
S&P | KEY RESISTANCE | GTradingMethodHello traders!
Has the S&P finally met its match?
Is this just a retest… or the beginning of a much deeper move?
- Broke diagonal support earlier this year
- Retesting previous support now
- Potential daily double top forming
If the retest holds, it’s a long way down… 📉
What are your thoughts? Keen to hear them :)
Signing off
G
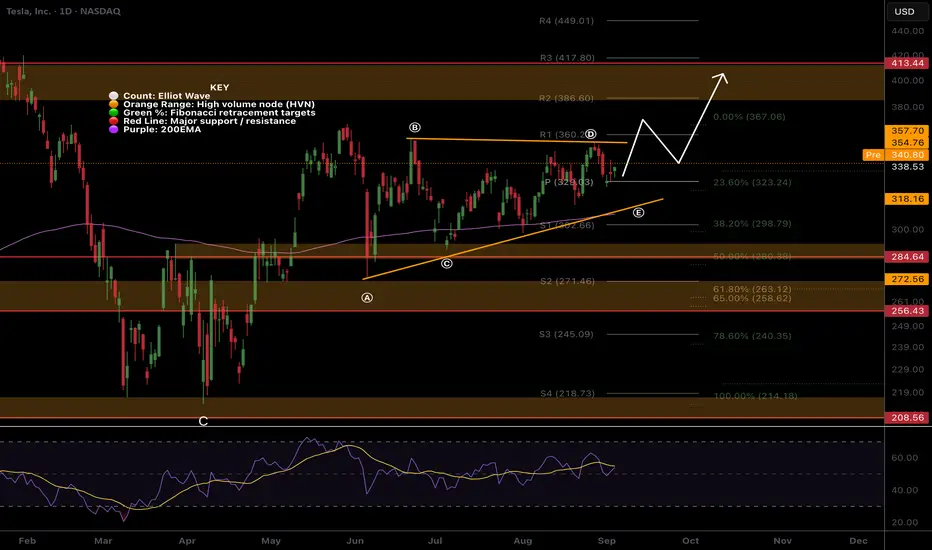
TSLA Creeping up from original triangle, but still in a larger tNASDAQ:TSLA continues to take the stairs of worry up to my trading signal target from the original triangle analysis, $386, but the pattern has morphed into what appears to be a barrier triangle now as price struggles at $360 with a series of higher lows.
RSI is comfortable at the EQ with room to grow while price remains above the daily pivot.
Analysis is invalidated below wave (C) $284
Safe trading
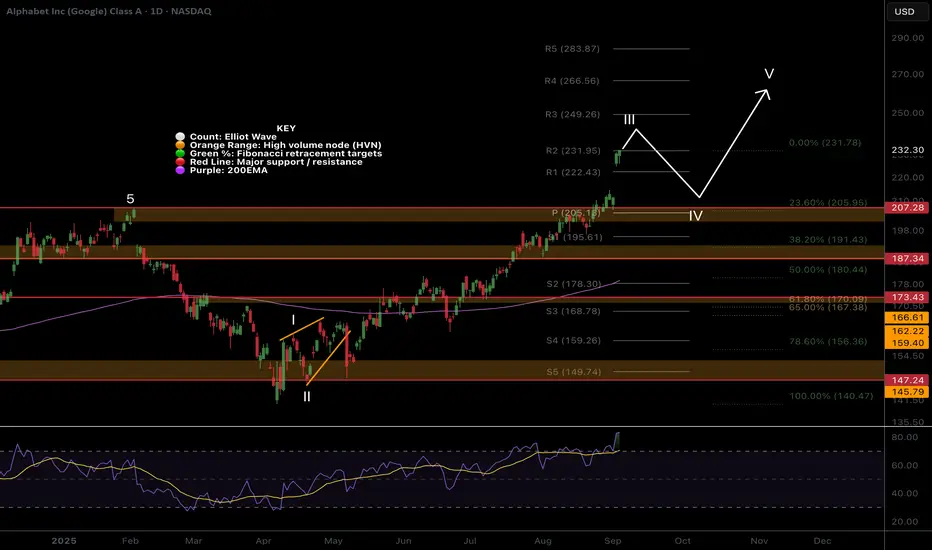
Google clear for take off? Elliot Wave adjusted!NASDAQ:GOOG Google shot up on the open into price discovery invalidating the pullback scenario and suggesting we are in a strong wave 3. Don't step in front of this moving train! gaps don't have to be filled if they are runaway gaps!
Daily RSI is significantly overbought and price is far above the mean so a short term reversal is still expected though not guaranteed! We expect a test of the all time High Volume Node as support at least, $207
Safe trading
S&P500 | Daily Double Top | GTradingMethodHello Traders.
Welcome to today's trade idea by GTradingMethod.
🧐 Market Overview:
I’ve opened a short on the cash500 (S&P 500) at 6521. All GTradingMethod variables have been met, which means this trade setup qualifies under my system.
Additional confluences suggesting weaker buying strength include:
- RSI making lower highs while price pushed higher highs.
- Volume tapering off toward the latter part of the rally.
- MACD on sell signal
The only hesitation is that money flows have not decreased in the later stages of this move — but rules are rules. My edge is probability-based, so when my variables align, I must take the trade consistently.
📊 Trade Plan:
Risk/reward = 9.2
Entry price = 6520
Stop loss price = 6544
Take profit level 1 (50%) = 6370
Take profit level 2 (50%) = 6215
💡 GTradingMethod Tip:
A high RR doesn’t make a trade safer — it simply reflects how far the market could move relative to your risk. Always focus on process and probability, not just the potential payout.
🙏 Thanks for checking out my post!
Make sure to follow me to catch the next idea and please share your thoughts - I would like to hear them.
📌 Please note:
This is not financial advice. This content is to track my trading journey and for educational purposes only.

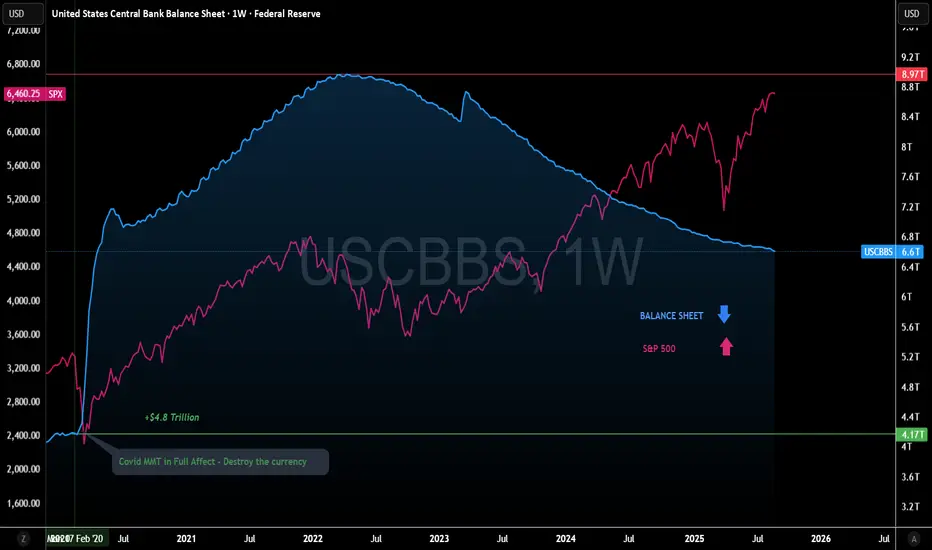
Federal Reserve Balance sheet vs SPXFed Balance sheet vs SPX
Its amazing to see the S&P500 breaking away from a long term correlation.
The Fed Balance sheet has shrunk from $8.97T to $6.6T but the markets have not been fazed.
Historically reductions in the balance sheet have resulted in markets selling off.
This time we are observing the markets trending higher.
Where is the liquidity coming from?
Is this time different?
S&P500 THE MOST IMPORTANT ANALYSISSP:SPX The S&P500 is in it's 5th wave and about to reverse. In addition to the expanding diagonal.
The currenct situation is an economic bubble. Compare it to the S&P500 gold ratio. NVDA is reversing.
Markets Titan

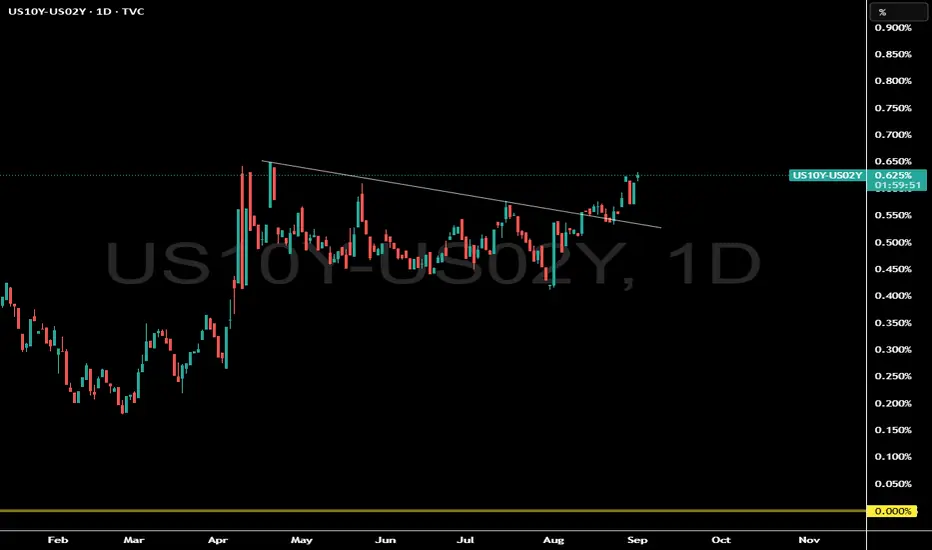
The Most Bullish Chart in the stock marketWhat does this 10 year yield and 2 year yield chart represent?
Is the bond market signaling a big economic event?
This bond market signal has a 100% success rate...but timing is the hard part since its a monthly long term signal.
Wait until we make a new pivot high in this chart...we should see some fireworks.
If you need to know what this means subscribe to our Youtube channel Where we often discuss macro economics and equites.
S&P500 Strong buy signal if the 4H MA200 holds.The S&P500 index (SPX) has been pulling back since the August 28 All Time High (ATH) and is headed for a 4H MA200 (orange trend-line) test.
This is a major short-term buy point as since April 25, every contact with this trend-line (6 so far) resulted into a new rally/ Bullish Leg.
The last two in particular rose as high as the 1.236 Fibonacci extension. So as long as the 4H MA200 holds, that gives us a 6530 short-term Target.
-------------------------------------------------------------------------------
** Please LIKE 👍, FOLLOW ✅, SHARE 🙌 and COMMENT ✍ if you enjoy this idea! Also share your ideas and charts in the comments section below! This is best way to keep it relevant, support us, keep the content here free and allow the idea to reach as many people as possible. **
-------------------------------------------------------------------------------
💸💸💸💸💸💸
👇 👇 👇 👇 👇 👇

S&P 500 Under Pressure as Pivot 6,425 HoldsSPX500 – Overview
The index dropped nearly 500 points (~0.9%), in line with the previous outlook, and continues to face bearish pressure as long as it trades below the pivot at 6,425.
Technical Outlook:
🔻 Bearish scenario: While under 6,425, downside momentum remains intact toward 6,389 → 6,366.
🔺 Bullish scenario: A confirmed 1H close above 6,425 would shift momentum upward, targeting 6,442 → 6,468.
Key Levels:
Pivot: 6,425
Support: 6,389 – 6,366
Resistance: 6,442 – 6,468
Previous idea:

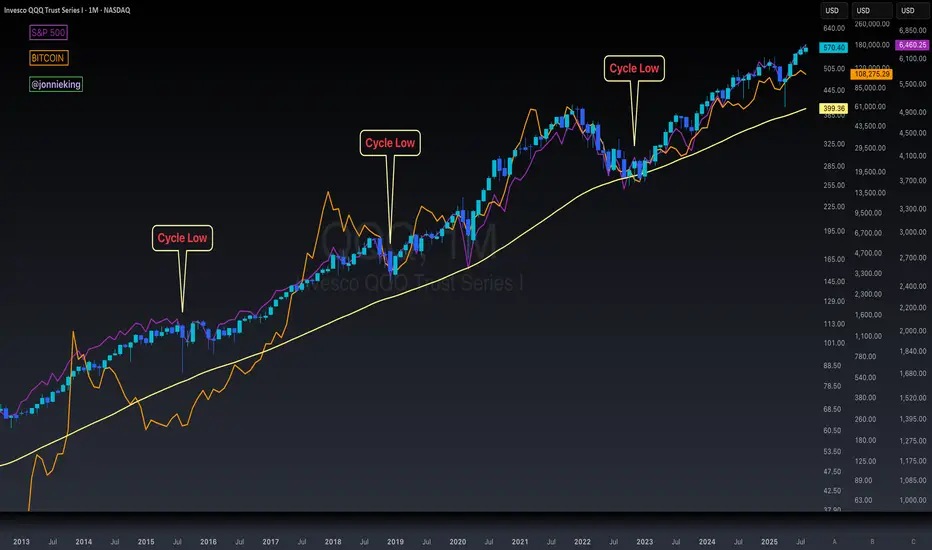
$BTC 4-Year Cycle Is NOT Dead According to $QQQ $SPXIt’s really weird cause everyone keeps telling me the ₿itcoin 4-year cycle is dead yet Nasdaq and S&P 500 follow nearly the exact same pattern with cycle lows 🤓
It’s almost as-if monetary and fiscal policy creates this boom and bust cycle every 4-years 🤔
Question for the “this time is different people”….
Will NASDAQ:QQQ and SP:SPX not have similar bear markets as we’ve seen in the past along with CRYPTOCAP:BTC ?
BEARS LOVE THIS!!! $SPY Break below this daily trend-line is not looking good for the bulls and everything for the bears 🐻. Price closing below would confirm the break of this daily trend. Rising wedge formed at all time highs 👀 is not a good sign.
Best of luck to everyone out there.
Not financial advice
🙂🫡
BRIEFING Week #35 : Monthly forecast for Q4Here's your weekly update ! Brought to you each weekend with years of track-record history..
Don't forget to hit the like/follow button if you feel like this post deserves it ;)
That's the best way to support me and help pushing this content to other users.
Kindly,
Phil

Bitcoin - Important scenario of what will happend soon!Did you know this cycle is almost identical to the 2020 cycle?
When I say identical, I don’t mean the exact percentage of price moves, but rather the price behavior and market structure.
If you look closely at the Bitcoin chart, you’ll notice that the current price action is very similar to what happened back in 2020 — and not only that, it’s happening in the same months as well.
There are so many strong similarities confirming this theory.
📌 So what’s the reason behind this?
-Both cycles are happening under Trump’s presidency.
-Same policies, same decisions, which lead to the same market behavior.
-The market is literally moving the same way it did during his first term.
- for example Bitcoin Dominance, didn’t reach the 66% level since 2020, and right after that it dropped to around 40%. The same setup could be repeating now... as it's expected to move up and retest the 60% level during Sep before going to 40% level
And here’s the shocking part 👇
If you check the SPX fractal between Feb 19, 2020 and 2025, you’ll see the exact same pattern — even on the same day! This can’t just be a coincidence. It’s part of a much bigger game being played on us.
Based on this, here’s what I expect:
The S&P 500 (SPX) could correct around 10% in September, dropping towards the 5800 level.
And of course, this will have a direct impact on the crypto market, likely causing it to drop in September.
So what should we expect?
September is likely to start with high volatility and downside pressure, with some altcoins potentially dumping over 30%.
After that, starting in October, we could be entering the real bull run, lasting until mid-2026.
Best Regards :
Ceciliones🎯
