SPX to dump 30% - 50% for Inflated Expectations in 2026I like to say the narrative follows the price . This was bound to happen after such an overheated year, couple years. Blame whomever you want, in the end its your wallet if you aren't ready to have your expectations met.
Best case scenario, the breakout of macro is confirmed after the retest (blue arrows). Worst, more likely case, it smashes down to confirm a double bottom with a strong foundation to form a macro support. The sawtooth can provide opportunities for volatile scalps, but its gonna get gnarly I can already tell.
SPX (S&P 500 Index)

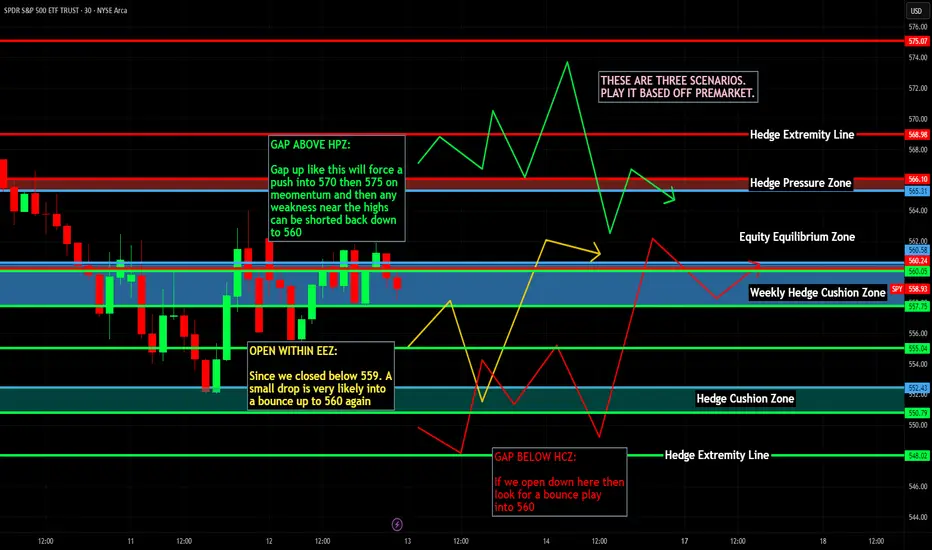
Nightly $SPY / $SPX Scenarios for March 13, 2025 🔮 🔮
🌍 Market-Moving News 🌍:
🇰🇷🇺🇸 South Korea's Trade Minister Visits U.S. 🇰🇷🇺🇸: South Korea's Trade Minister, Cheong In-kyo, is visiting Washington, D.C., from March 13 to 14 to discuss trade issues, including reciprocal tariffs and investment opportunities, with U.S. counterparts. This visit aims to address concerns about tariffs following President Trump's comments regarding disparities between U.S. and South Korean tariffs. The outcome of these discussions could impact sectors reliant on U.S.-South Korea trade relations.
🇩🇪🛠️ German Debt Reform Debates 🇩🇪🛠️: Germany's Bundestag is set to begin debates on debt reform plans starting March 13, focusing on increasing infrastructure spending and reforming state borrowing rules to fund defense. The proposed creation of a €500 billion infrastructure fund aims to stimulate the economy. These reforms could influence European economic stability, indirectly affecting U.S. markets through global economic interconnections.
📊 Key Data Releases 📊:
📅 Thursday, March 13:
🏭 Producer Price Index (PPI) (8:30 AM ET) 🏭:The PPI measures the average change over time in selling prices received by domestic producers, offering insights into wholesale inflation trends.
Forecast: +0.3% month-over-month
Previous: +0.4% month-over-month
📉 Initial Jobless Claims (8:30 AM ET) 📉:This weekly report indicates the number of individuals filing for unemployment benefits for the first time, providing insight into the labor market's health.
Forecast: 226K
Previous: 221K
⚠️ Disclaimer: This information is for educational and informational purposes only and should not be construed as financial advice. Always consult with a professional financial advisor before making investment decisions.⚠️
📌 #trading #stockmarket #economy #news #trendtao #charting #technicalanalysis
S&P500 Strong Support cluster on the 2-year Channel Up.S&P500 (SPX) has been trading within a 2-year Channel Up that has made the market recover from the 2022 Inflation Crisis, taking it to a new All Time High (ATH).
The recent 4-week decline however has been an aggressive one and rightly so has sparked heightened fear to investors, especially considering the trade war fundamentals. Technically, the index just broke below its 1W MA50 (blue trend-line) and is approaching the bottom of this long-term Channel Up, a development that in the eyes of short-term traders is disastrous.
On the long-term though, this is a very strong Support level as the market seems to be repeating the Secondary Channel Up (blue) of February - October 2023. The end of this was also an aggressive correction which broke below both the 1W MA50 and 0.382 Fibonacci retracement level temporarily before starting a massive Bullish Leg. Even the 1W RSI sequences among the two fractals are similar, despite the current price action being more aggressive.
Interestingly enough, they both declined by at least -10%, so if we see the current week closing in green and by the next starting to recover, it is likely to see a similar Bullish Leg to test the -0.5 Fibonacci extension as the April 01 2024 Top did. That would give us a 6900 long-term Target, which would be a +24.75% rise from the current low, exactly identical with the rise from the April 19 2024 to February 19 2025.
-------------------------------------------------------------------------------
** Please LIKE 👍, FOLLOW ✅, SHARE 🙌 and COMMENT ✍ if you enjoy this idea! Also share your ideas and charts in the comments section below! This is best way to keep it relevant, support us, keep the content here free and allow the idea to reach as many people as possible. **
-------------------------------------------------------------------------------
Disclosure: I am part of Trade Nation's Influencer program and receive a monthly fee for using their TradingView charts in my analysis.
💸💸💸💸💸💸
👇 👇 👇 👇 👇 👇

Bearish & Boring? Maybe. Profitable? Definitely.Bearish & Boring? Maybe. Profitable? Definitely. | SPX Market Analysis 12 Mar 2025
You know that feeling when you wake up and wonder if you’re stuck in a time loop? Yeah, me too.
For what feels like the hundredth time, I’m reporting that the bear move is grinding lower. The difference? The profits keep stacking up—so I’m not complaining.
Yesterday’s rally was supposedly triggered by Canada pausing tariffs, but let’s be real—this market is looking for any excuse to bounce. Yet, the overall trend remains the same: a slow, stair-stepping drop. Based on this drop-pause-drop rhythm, I suspect we’re entering the next pause before another leg down.
My bear boots are full, my trade allocations are set, and I’m waiting for two tranches to exit profitably before considering any new plays. Until SPX clears 5850, the bullish setups stay on the shelf.
This is the good kind of waiting—the kind where the market moves for me instead of me chasing it.
---
Deeper Dive Analysis:
If it feels like Groundhog Day, you’re not alone. The bearish grind continues, slowly pushing lower, delivering small but steady wins. Unlike a panic-driven crash, this move is unfolding in slow motion, keeping traders on edge, wondering if a rally is lurking around the corner.
📌 A Market Looking for an Excuse to Bounce
Yesterday’s rally attempt was supposedly fueled by news that Canadian tariffs were being paused, but let’s be honest—this market is desperate for any reason to move higher. The reality? The larger bearish structure remains intact.
Every bounce so far has been short-lived.
The market keeps following a drop-pause-drop pattern.
We’re likely entering the next "pause" phase before another move down.
📌 My Trading Approach—Locked, Loaded, and Waiting
Right now, my bear boots are full, meaning I’m not adding new positions until my current tranches exit profitably.
Two tranches are set to exit with profits by the end of the week.
If we push lower or continue sideways, I’ll take my exits and reassess.
Until SPX clears 5850, I won’t even think about bullish setups.
📌 What’s Next? The Good Kind of Waiting
There’s no need to chase trades or force new entries. I’m simply letting my plan play out. If the market continues its slow-motion decline, I’ll collect my wins, reload selectively, and wait for the next prime setup.
For now, I sit back and enjoy the show—because this time, the market is working for me, not against me.
---
Fun Fact
📢 Did you know? In 2008, Porsche trapped hedge funds in one of the greatest short squeezes in history, briefly making it the most valuable company in the world—all thanks to a secretive stock manoeuvre.
💡 The Lesson? Markets don’t just move up and down—they can also turn traders inside out. The wrong bet at the wrong time can be devastating… unless, of course, you have a system that keeps you on the right side of the trade. 🚀

SPY S&P 500 etf Oversold on the RSI ! 2025 Price Target ! The SPDR S&P 500 ETF Trust (SPY) is flashing a major buy signal, with its Relative Strength Index (RSI) currently sitting at 28.33 — firmly in oversold territory. Historically, every time SPY has entered oversold levels on the RSI, institutional buyers have stepped in aggressively, driving sharp rebounds in the following weeks and months.
The last time SPY dipped below the 30 RSI threshold was during market pullbacks in 2022 and 2023 — both of which were followed by significant rallies as institutions capitalized on discounted valuations. The current setup is no different. With earnings growth stabilizing, inflation cooling, and the Federal Reserve signaling a potential shift toward rate cuts in the second half of the year, the backdrop for a recovery is aligning perfectly.
Technically, SPY is also approaching key support levels that have held strong in past market corrections. The combination of an oversold RSI and strong institutional appetite at these levels creates a compelling case for a bounce.
My price target for SPY by year-end is $640, representing over 15% upside from current levels. With sentiment stretched to the downside and technical indicators flashing green, SPY looks primed for a sharp and sustained rebound. Now could be the perfect time to position for the next leg higher.

SPX give target of 5900My prediction based on market geometry and trend convergence. 5900 by 8/4. I don't claim any accuracy but the probability is high. The level is confirmed by 61.8% fibbo retracement and the time by fibo time series , 21 days down and 21 days up

Nightly $SPY / $SPX Scenarios for March 12, 2025 🔮 🔮
🌍 Market-Moving News 🌍:
🇺🇦🇷🇺 Ceasefire Proposal in Ukraine 🇺🇦🇷🇺: Ukraine has expressed willingness to accept a month-long ceasefire proposal, leading to a surge in the euro to five-month highs. This development has introduced volatility in European and U.S. equity markets, influenced by ongoing U.S. tariff plans.
🇺🇸🇨🇦 U.S. Tariff Increases on Canadian Imports 🇺🇸🇨🇦: President Trump has threatened to double tariffs on Canadian steel and aluminum imports to 50%, escalating trade tensions and contributing to a deepening stock market sell-off. This move has raised concerns about inflation and economic growth, affecting investor confidence.
📊 Key Data Releases 📊:
📅 Wednesday, March 12:
📈 Consumer Price Index (CPI) (8:30 AM ET) 📈:The CPI measures the average change over time in prices paid by urban consumers for a basket of goods and services, serving as a key indicator of inflation.
Forecast: +0.2% month-over-month
Previous: +0.3% month-over-month
⚠️ Disclaimer: This information is for educational and informational purposes only and should not be construed as financial advice. Always consult with a professional financial advisor before making investment decisions.⚠️
📌 #trading #stockmarket #economy #news #trendtao #charting #technicalanalysis

S&P500 Channel Down good until cancelled.S&P500 / US500 is trading inside a 20day Channel Down that spearheaded the technical correction from last month's All Time High.
The 1hour RSI is on a bullish divergence and within this pattern this has signalled a temporary rebound near the 1hour MA100 for a Lower High rejection.
As long as the pattern holds, a tight SL sell position there is the most optimal trade, aiming at 5450.
A crossing over the 1hour MA200, invalidates the bearish sentiment and restores the buying bias. In that case, take the loss on the sell and buy, aiming at 6040 (Fibonacci 2.0 extension).
Follow us, like the idea and leave a comment below!!

Silly Speculation #1.Charting the bottom to our current downside move. I could be wrong...if so, I would say by 2-3%.

S&P 500 reversal target - 6151Looking at a potential reversal target for the S&P 500 as we move beyond the election year into 2025. When scanning backwards on the previous high from late 2021, we can see price action clearly retested the speed fib on multiple weeks before a final rejection that induced the mini bear market which ended Oct of '22. Following that same speed fib forward into 2024, we can clearly see price is NOW, once again, retesting this magnetic fib zone.
To figure out where this is all going, let's measure from the Jan '22 high into the Oct '22 low.
Here, we get a 1.854 and 2.0 fib extension which intersects with the speed fib in question. Making some assumptions that price will AGAIN, range and retest multiple times before resolving, we can overlay "bars pattern" (from Jan '21 HIGH - Oct '22 LOW) and see when and how this could play out.
Now, we wait and see how this movie ends!
Note: Not trading or investment advice. ENTERTAINMENT ONLY!

S&P 500 is gearing up for a drop to $348.11 or even $218.26.SP:SPX AMEX:SPY are gearing up for a potential crash. Markets and indices seem aligned for a downturn.
What will trigger it?
Hard to say, but watching the stock and crypto markets, it certainly looks that way.
My expectations for SPX / SPY:
➖ Fibonacci 161.80% targets have been reached.
➖ Key downside levels: $348.11 and $218.26.
TVC:DXY
The dollar index is leaning towards growth for now. I think it might follow this scenario. Let’s keep an eye on how things develop.


Most Probable Outcome (SPY, SPX)Looking at recent pullbacks and Shiller Cape. My most probable outcome for this S&P Correction is 5400. Finding the first big support under the 200 DMA. Shiller Cape around 35 at that level.

Glory to the Bear! - And My Plan is in MotionGlory to the Bear! - And My Plan is in Motion | SPX Market Analysis 11 Mar 2025
It’s time to salute the bear—SPX is nearly 10% down, officially flirting with correction territory. The NASDAQ has already crossed the line, and blue-chip stocks are falling fast, shedding high single and low double digits in a matter of days.
But here’s the difference—there’s no panic. This isn’t a blind sell-off; it’s structured, calculated, and methodical. The market isn’t falling apart in chaos—it’s crumbling with precision. That tells me one thing: this move has legs.
I’m already locked and loaded on the bearish side, with 5255 as my next major target. Until we see a meaningful reclaim of 5800, I won’t even consider flipping bullish. For now, it’s all about collecting profits—or watching for hedge triggers.
---
Deeper Dive Analysis:
The SPX correction is nearly here, and unlike past sell-offs, this one feels controlled, structured, and lacking in panic. That’s what makes it even more powerful.
The Market Breakdown – How We Got Here
The SPX is down 9.49%, inching closer to official correction levels. While the speed of the decline has been slow, the trend is now unmistakable—we are firmly in a bearish structure.
Monday’s move steepened the downtrend, confirming the break below the sideways channel.
The NASDAQ has already crossed correction territory, leading the decline.
Blue-chip stocks are getting slaughtered, dropping in high single and low double digits.
Technical Levels – Why This Bear Move Is Clear
One of my favourite things in technical analysis is when everything interlocks perfectly—and that’s exactly what’s happening.
The first bearish target on the daily charts has been reached, causing a minor bounce—likely profit-taking.
The larger expanding triangle breakout target is 5255, which just happens to be 200% of the previous target.
The next bullish play isn’t even on my radar until SPX reclaims 5800.
Trading Execution – No Need to Rush
With my bearish positions locked in, there’s no reason to chase or force trades. The plan is simple:
Let the market do its thing.
Wait for profits to roll in—or hedge triggers to fire.
No new bullish trades until SPX climbs back above 5800.
Right now, the market is rewarding patience. This is what structured trading looks like—sticking to the plan and executing with confidence.
---
Did you know? In 1929, stock tickers ran hours behind during the market crash, leaving traders guessing how much they had lost until the end of the day.
The Lesson? Market chaos rewards those who plan ahead. Unlike traders in 1929, you don’t have to wait for a newspaper headline to know what’s happening—but if you’re not following a strategy, you’re still guessing.

End of hibernation for the bears?AMEX:SPY is at a pivotal point and could potentially be at the top of the bullish cycle that began in October 2022. If this prediction proves accurate, I think we could see a maximum low of $510 for this year. There are a couple of caveats, including one that will be a clear indicator of whether or not this wave count is accurate, which I will explain later.
On the 1000R chart ($10), this uptrend was confirmed by Supertrend and volume activity. Volume drastically increased at the start of Wave (3) in March 2023 and did not taper off until the start of Wave (4) in July 2024. This was the strongest impulse in the trend, which is common for Wave 3. You can also see the ADX line of the DMI indicator (white line) was at its highest level during that period.
Assuming Wave (5) is already complete, we can observe that the volume in Wave (3) was considerably less than Wave (5).
Other observations supporting this wave count:
- Wave (4) retracing into the territory of Wave 4 of (3)
- Alternation in corrective patterns between Wave (2) and Wave (4); flat in (2) and straight down in (4)
- Wave (5) extending to nearly 1.618 of (1)
While the points I’ve made so far suggest that the market may be on the verge of a crash, the image gets more complicated when you take a closer look on the 250R chart ($2.50). I’ll start with what I’m counting as Wave 4 of (5). The price ended at ATH in Wave 3 and then corrected in an unmistakable five wave descending wedge pattern. This can only be a fourth wave of a larger impulse, so we can conclude with a fair amount of confidence that the wave that follows will be the last.
Here is where things get interesting. The price moved from $575 on January 13th to a slightly higher ATH of $609.24 on January 24th before being rejected again. This uptrend unfolded in a typical bullish pattern and left a notable gap at $584, which is the only gap still left unfilled. The trend change is confirmed on the moving averages. Notice the serious drop in volume that followed as well.
Despite the shift in volume, there are two issues I have with this wave count that are preventing me from calling this a confirmed correction:
1. Wave 5 of (5) was awfully short and only extended roughly $2 above the end of Wave 3 of (5). This does not break any rules, but it is unusual.
2. What I have labelled as Wave B of Wave (1) or (A) of the correction made a new ATH on Friday February 14th, which should invalidate this wave count since the end of Wave 5 of (5) should be the peak.
The second point is why some may think that we are about to resume the larger bull trend, however there is a possibility that they are mistaken based off the PA on the actual index SP:SPX and futures CME_MINI:ES1! . On the SP:SPX chart, we can see that the index did not break the ATH at $6128.18 set on January 25th, and instead rejected at $6,127.24.
CME_MINI:ES1! also failed to notch a new ATH on Friday and I have observed the price action create a nearly perfect bearish butterfly pattern. Also notice how the volume is significantly lower than in the uptrend that began on January 31st.
So the question remains: are we at a tipping point or will the bulls regain control? Right now it’s unclear, but I will keep my bearish sentiment until SP:SPX makes a new ATH, which will invalidate this theory. Since only the ETF that tracks it only made a slightly higher high on low volume, I’m skeptical of the PA on AMEX:SPY at the moment. This is why I entered puts on Friday.
If the trade plays out, I expect the price to quickly move to fill the gap at $584, which is still conveniently located at what I cam considering the 1.236 extension of Wave A, which is a common target extension in flat corrections. I will keep my puts open until this idea is invalidated, as the Wave C drop will likely be caused by a news event that could come at any time. Let me know if you guys are seeing the same thing or something different. Good luck to all!

$SPY Short Term Bullish atm.. idea for BullsWell... seeing is we hit my target, I thought I might bless the Bulls with a little bit of Eye Candy.... This is what you want...
The Fib breakdown of the Golden Pocket above at the 1.61... we hit the retracement... and now back to the .78
We hold here and it can get bullish quick.
Bearish Path in Next post... otherwise we make a lower high and fall to $525 and fast.

Nightly $SPY / $SPX Scenarios for March 11, 2025🔮 🔮
🌍 Market-Moving News 🌍:
🇯🇵🤝 Japan-U.S. Trade Discussions 🤝: Japanese Trade Minister Yoji Muto is visiting Washington from March 9–11 to engage in discussions with U.S. officials. The talks aim to strengthen economic ties and address trade concerns, including potential exemptions for Japanese exports from proposed U.S. tariffs. These negotiations could influence sectors such as automotive and steel, impacting market dynamics.
🇨🇳📊 China's National People's Congress (NPC) Developments 📊: The 2025 National People's Congress is underway in Beijing from March 5–11. Key economic targets and policy directions set during the NPC may affect global markets, including the U.S., especially in areas related to trade, technology, and foreign investment.
📊 Key Data Releases 📊:
📅 Tuesday, March 11:
📄 JOLTS Job Openings (10:00 AM ET) 📄:This report provides data on job openings, hires, and separations, offering a comprehensive view of the labor market's dynamics.
Forecast: 7.71 million
Previous: 7.6 million
⚠️ Disclaimer: This information is for educational and informational purposes only and should not be construed as financial advice. Always consult with a professional financial advisor before making investment decisions.⚠️
📌 #trading #stockmarket #economy #news #trendtao #charting #technicalanalysis

BITCOIN — THE SUPPORT LINEBitcoin’s ultimate support for bulls lies between the two black lines shown above.

AMAZON at important support. Positive days coming?AMZN looking at good support. We can see positive days if it works.
Many cryptocurrency dominance charts, as well as Nasdaq and other stock charts too, showing the same pattern. Is the reversal starting? Check my other analysis too.
We’ll see.
This is not investment advice. Please do your own research.
Wishing you best.
-YusufDeli

Bearish Outlook for VX1!Bearish Post Description for TradingView
Title: Bearish Outlook on VIX Futures - Time to Brace for a Pullback!
Hey traders, take a look at this VIX Futures chart (CBOE Volatility Index - VX1 Futures) published by FairValueBuffet on TradingView (Mar 10, 2025, 20:58 UTC). The technicals are screaming caution, and here’s why:
- Supply/Demand Zone Breakdown: We’ve hit a critical supply zone (highlighted in yellow) with a sharp spike, suggesting heavy selling pressure. The price action is showing rejection at this level, hinting at a potential reversal.
- Moving Averages: The 18-week and 52-week SMAs are converging, with the price breaking below the shorter-term SMA, reinforcing bearish momentum.
- Bearish Divergence: The RSI and Williams %R at the bottom show clear bearish divergence. Despite a price spike, the momentum indicators are declining, indicating weakening bullish strength.
- Seasonality Indicator: The bottom-right seasonality chart (COT data for VX Futures) shows a historical tendency for volatility spikes around this time, often followed by a correction.
With the VIX jumping to 24.700 and a volume of 137.66K, coupled with the bearish technical setup, I’m anticipating a pullback in the near term. Keep an eye on the 20.000 support level—failure to hold could see us testing lower grounds. Let’s stay cautious and consider short opportunities or hedging strategies!
---
CBOE:VX1! CME_MINI:ES1! AMEX:SPY
Bullish Case for S&P 500 - Fundamental Perspective
While the VIX chart suggests short-term volatility, the broader S&P 500 presents a compelling bullish case based on fundamentals as of March 10, 2025. Here’s why we might see upside potential:
- Economic Resilience: Recent data points to robust corporate earnings growth, with many S&P 500 companies exceeding Q4 2024 expectations. This earnings strength supports a sustained rally.
- Interest Rate Outlook: The Federal Reserve has signaled a dovish stance, with potential rate cuts on the horizon. Lower interest rates typically boost equity valuations, especially for growth stocks in the S&P 500.
- Gold and Bonds Correlation: The chart shows a dip in gold prices and bond yields stabilizing, which historically correlates with risk-on sentiment. This could drive capital back into equities, favoring the S&P 500.
- Market Sentiment: Despite short-term volatility (as seen in the VIX), investor confidence remains high, supported by strong consumer spending and improving global trade conditions.
Given these fundamentals, the S&P 500 could be poised for a bullish run, especially if volatility subsides and the 18-week SMA on the VIX chart starts to flatten. Consider long positions or adding exposure if the market holds key support levels. Stay tuned for confirmation!
---
Note: This analysis is based on the provided chart and my knowledge up to March 10, 2025. For the latest updates or to validate these trends, I can perform a web search or analyze additional X posts if requested!
Not Financial Advice

Start of bearish cycle for equities $SPXSP:SPX confirming trend reversal on high time frame as it attempts to breach the 50 weekly MA for the first time since the start of the 2022 bear market. Macroeconomic environment is full of uncertainty and recession signals, with POTUS Trump openly confirming that some short term pain in assets is needed for the US economy to reset and go on a better path forward.
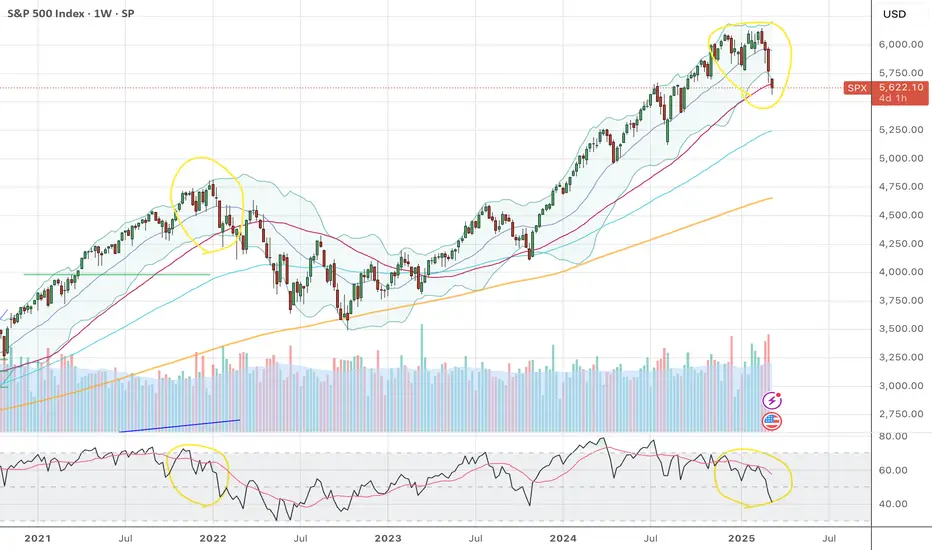
S&P500: Broke its 1W MA50 after 17 months. Recovery or collapse?The S&P500 turned oversold on its 1D technical outlook (RSI = 29.430, MACD = -85.410, ADX = 51.223) as it breached today its 1W MA50 for the first time since the week of October 30th 2023, i.e. almost 1.5 year. That was a week of a very aggressive recovery after a Channel Up correction, with the bullish sequence reaching 9 straight green weeks. With the 1D RSI ovesold and the 1W RSI almost on the 39.15 Support, which was the low of the October 23rd 2023 1W candle, the index couldn't have been technically on a better long term buy spot.
Needless to say, the market can't rise if the fundamentals are against it and right now the geopolitical tensions and more importantly the trade war isn't helping. If the index does find a positive catalyst to take advantage of, then the bullish technicals of the Channel Up bottom will prevail, and this week's candle may resemble the Max Pain 1W candle under the 1W MA50 of October 23rd 2023. Even if it doesn't rise as high as the 2.382 Fibonacci extension of that rally, we would expect in that instance a 2.0 Fib extension rally like the post August 2024 bullish wave (TP = 6,700). Failure to find support this week though, will most likely result in further collapse (even more aggressively so) to the 1W MA100.
## If you like our free content follow our profile to get more daily ideas. ##
## Comments and likes are greatly appreciated. ##

S&P 500 Breakdown at Key Support LevelThe S&P 500 is showing clear signs of technical weakness as it breaks below a key support level around 5,675, coinciding with the 200-day EMA. This breakdown follows a rejection at 6,130, a recent high that established a resistance zone.
With the index now trading below the 50-day EMA, downside risks are increasing. If the 5,668 level fails to hold, further declines toward the next major support zone could materialize. Traders will be watching for a potential retest of broken support as resistance before determining the next move.
Key Levels to Watch:
📉 Support: 5,668
📈 Resistance: 6,130
-MW
